
 Open Access Article
 This Open Access Article is licensed under a Creative Commons Attribution-Non Commercial 3.0 Unported Licence
Ammonia uptake by transmembrane pH gradient poly(isoprene)-block-poly(ethylene glycol) polymersomes†
Aaron C.
Schmidt
,
Erik R.
Hebels
,
Charlotte
Weitzel
,
Barbara
Stoessel
,
Yinyin
Bao
,
Karl-Heinz
Altmann
and
Jean-Christophe
Leroux
 *
*
Institute of Pharmaceutical Sciences, Department of Chemistry and Applied Biosciences, ETH Zurich, 8093 Zurich, Switzerland. E-mail: jleroux@ethz.ch
First published on 2nd March 2020
Abstract
Transmembrane pH gradient poly(isoprene)-block-poly(ethylene glycol) (PI-b-PEG) polymersomes were investigated for their potential use in the detoxification of ammonia, a metabolite that is excessively present in patients suffering from urea cycle disorders and advanced liver diseases, and which causes neurotoxic effects (e.g., hepatic encephalopathy). Polymers varying in PI and PEG block length were synthesized via nitroxide-mediated polymerization and screened for their ability to self-assemble into polymersomes in aqueous media. Ammonia sequestration by the polymersomes was investigated in vitro. While most vesicular systems were able to capture ammonia in simulated intestinal fluids, uptake was lost in partially dehydrated medium mimicking conditions in the colon. Polymeric crosslinking of residual olefinic bonds in the PI block increased polymersome stability, partially preserving the ammonia capture capacity in the simulated colon environment. These more stable vesicular systems hold promise for the chronic oral treatment of hyperammonemia.
Introduction
Ammonia is a nitrogen metabolite essential to the health of the human body (e.g., amino acid metabolism). It coexists with its protonated form ammonium (NH4+, pKa of 9.25)1 in an equilibrium, which is governed by pH (and is shifted towards the protonated species at plasma pH). The majority of systemic ammonia is produced in the large intestine by bacterial cleavage of urea, before entering systemic circulation. In healthy individuals, ammonia is detoxified in the liver by the urea cycle, as well as by glutamine synthesis in the muscles, and is excreted through the kidneys as urea.2 A diseased or dysfunctional liver can impair hepatic detoxification and cause a rise in systemic ammonia levels resulting in hyperammonemia (HA) (blood ammonia levels >50 μmol L−1 in adults and >100 μmol L−1 in newborns).3 Impairment of hepatic detoxification can be caused by an inherited metabolic disease, as is the case in urea cycle disorders, where the incidence is reported to be 1 in 35![[thin space (1/6-em)]](https://www.rsc.org/images/entities/char_2009.gif) 000 live births,4 or acquired, as is the case in liver cirrhosis.5,6 Ammonia and ammonium are capable of penetrating the blood brain barrier. Under hyperammonemic conditions the concentration of ammonia metabolites are neurotoxic, likely due to the accumulation of glutamine (produced by the condensation of glutamate with ammonia) within the brain. In the case of liver cirrhosis this is referred to as hepatic encephalopathy (HE).7,8 Neurotoxic effects range from cognitive impairment to coma and even death, depending on the severity of the disease.
000 live births,4 or acquired, as is the case in liver cirrhosis.5,6 Ammonia and ammonium are capable of penetrating the blood brain barrier. Under hyperammonemic conditions the concentration of ammonia metabolites are neurotoxic, likely due to the accumulation of glutamine (produced by the condensation of glutamate with ammonia) within the brain. In the case of liver cirrhosis this is referred to as hepatic encephalopathy (HE).7,8 Neurotoxic effects range from cognitive impairment to coma and even death, depending on the severity of the disease.
Current treatments for HE mainly target the generation and uptake of ammonia in the colon. These include the laxative, lactulose, and the marginally bioavailable antibiotic, rifaximin. Lactulose acidifies the colon, thereby impairing bacterial growth and reducing ammonia production; it also promotes ammonia excretion through its laxative effect.9 Rifaximin lowers ammonia levels by eliminating urease-producing bacteria.10,11 These approaches are viewed as poorly effective or might negatively affect normal human microbiota.12 Of further concern, and as relates to the use of rifaximin and other chronically applied antibiotics, antibiotic resistance is a growing concern; this generally renders chronic antibiotic therapy as ill-advised for long term use.13,14
In 2015, Forster et al. reported a transmembrane liposomal pH gradient formulation capable of effectively capturing ammonia when applied via peritoneal dialysis.15 This approach lowered plasma ammonia concentrations in bile duct ligated rats (a model of HA),16 implying its potential for the management of acute and severe hyperammonemic crises. The demonstration of effective liposome-based ammonia capture was a positive stepping-stone, but for chronic treatment of HA an oral formulation would be more practical. Liposomes have been investigated in oral drug delivery for years, but so far no oral product has been successfully developed, mainly due to poor stability within the conditions of the gastrointestinal (GI) tract.17,18 Polymersome HA therapeutic strategies, a variant of liposomal strategies, may bridge this gap.
In the past two decades polymersomes (synthetic analogues of liposomes) have emerged as biologically resilient, targetable drug delivery tools, and have therefore drawn the interest of the drug delivery community.19,20 These synthetic vesicles are more stable than their liposomal analogues due to thicker vesicle membranes,21 while simultaneously also being more functional,22 due to their capacity to be tuned by incorporating function-specific monomers. Recently, transmembrane pH gradient polymersomes consisting of poly(styrene)-b-PEG (PS-b-PEG) have been shown to efficiently sequester ammonia in simulated intestinal fluids.23 However, this system failed to lower ammonia levels in bile duct ligated rats after oral administration, possibly due to insufficient ammonia uptake and partial destabilization of the vesicles in the colon upon dehydration of the intestinal chyme. Our work explores optimization of these potential points of failure.
It is well known that the properties of the hydrophobic polymer block and especially its glass transition temperature (Tg) strongly influence functional and structural characteristics of the polymeric vesicles.24 We therefore hypothesized that hydrophobic polymer blocks having a low Tg, such as poly(isoprene) (Tg PI = −69 to −64 °C),25 might result in polymersomes with a more fluid bilayer and subsequently superior ammonia capture as compared to polymersomes containing a hydrophobic polymer block with a high Tg (resulting in a more crystalline membrane), such as poly(styrene) (Tg PS = 105–109 °C).26 We further hypothesized that the stability of the vesicle system could be increased by polymeric crosslinking of the vesicular bilayer.27 In this work, we screened different PI-b-PEG vesicles for the ability to take up ammonia under simulated intestinal conditions and subsequently optimized the system to improve vesicular stability.
Materials and methods
Materials
Isoprene, isobutyraldehyde, ammonium chloride (NH4Cl), 2-methyl-2-nitropropane, magnesium, bromobenzene, copperII acetate (Cu(OAc)2), sodium bicarbonate (NaHCO3), sodium hydroxide (NaOH), sodium sulfate (Na2SO4), poly(ethylene glycol) (PEG) monomethyl ether (Mn = 5000 g mol−1), potassium dihydrogen phosphate (KH2PO4), iodine, palladium on activated charcoal (10%), trisodium citrate dehydrate, bile salts (mixture of sodium cholate and sodium deoxycholate), alkaline hypochlorite solution, phenol nitroprusside solution, and 8-hydroxypyrene-1,3,6-trisulfonic acid trisodium salt (HPTS) (pyranine) were purchased from Sigma Aldrich (Steinheim, Germany). Copper powder, zinc powder, as well as N,N,N,N,N-pentamethyldiethylenetriamine (PMDETA) were supplied by Acros (Geel, Belgium). PEG monomethyl ether (Mn = 2000 g mol−1) was obtained from Fluka (Buchs, Switzerland). Sodium taurocholate and PEG monomethyl ether (Mn = 700 g mol−1) were obtained from ABCR (Karlsruhe, Germany). Triethylamine (Et3N) was purchased from Merck (Darmstadt, Germany). Citric acid monohydrate and sodium chloride (NaCl) were obtained from Fisher Scientific (Leicester, UK). CopperI bromide (CuBr) was obtained from Alfa Aesar (Kandel, Germany). 2-Hydroxy-4′-(2-hydroxyethoxy)-2-methylpropiophenone was purchased from TCI (Zwijndrecht, Belgium). SilicaFlash P60 (40–63 μm, 230–400 mesh) was obtained from Silicylce (Quebec City, QC, Canada). Deuterated chloroform (CDCl3) was supplied by Armar (Dottingen, Switzerland). Ammonium hydroxide (NH4OH) 25% aqueous solution was purchased from VWR (Fontenay-sous-Bois, France). All solvents were obtained from VWR, Fisher Scientific, Acros, or Sigma Aldrich. Metamucil® Regular (fiber and saccharose) was from Procter & Gamble (Petit-Lancy, Switzerland).2,2,5-Trimethyl-4-phenyl-3-azahexane-3-nitroxide (TIPNO, 95%) was synthesized as described elsewhere.28
Polymer synthesis and characterization
Three polymer libraries were synthesized using PEG monomethyl ether 700, 2000, or 5000 g mol−1, respectively, as the starting material (Scheme 1). The polymer syntheses were conducted in the same fashion for all three libraries, unless stated otherwise. The synthesis of several polymers of the PEG 2000 library is reported in a previous publication from our group (i.e., polymers with PI/PEG2000 (w/w) ratios of 1.32, 1.99, 2.30, 2.90, and 3.62).29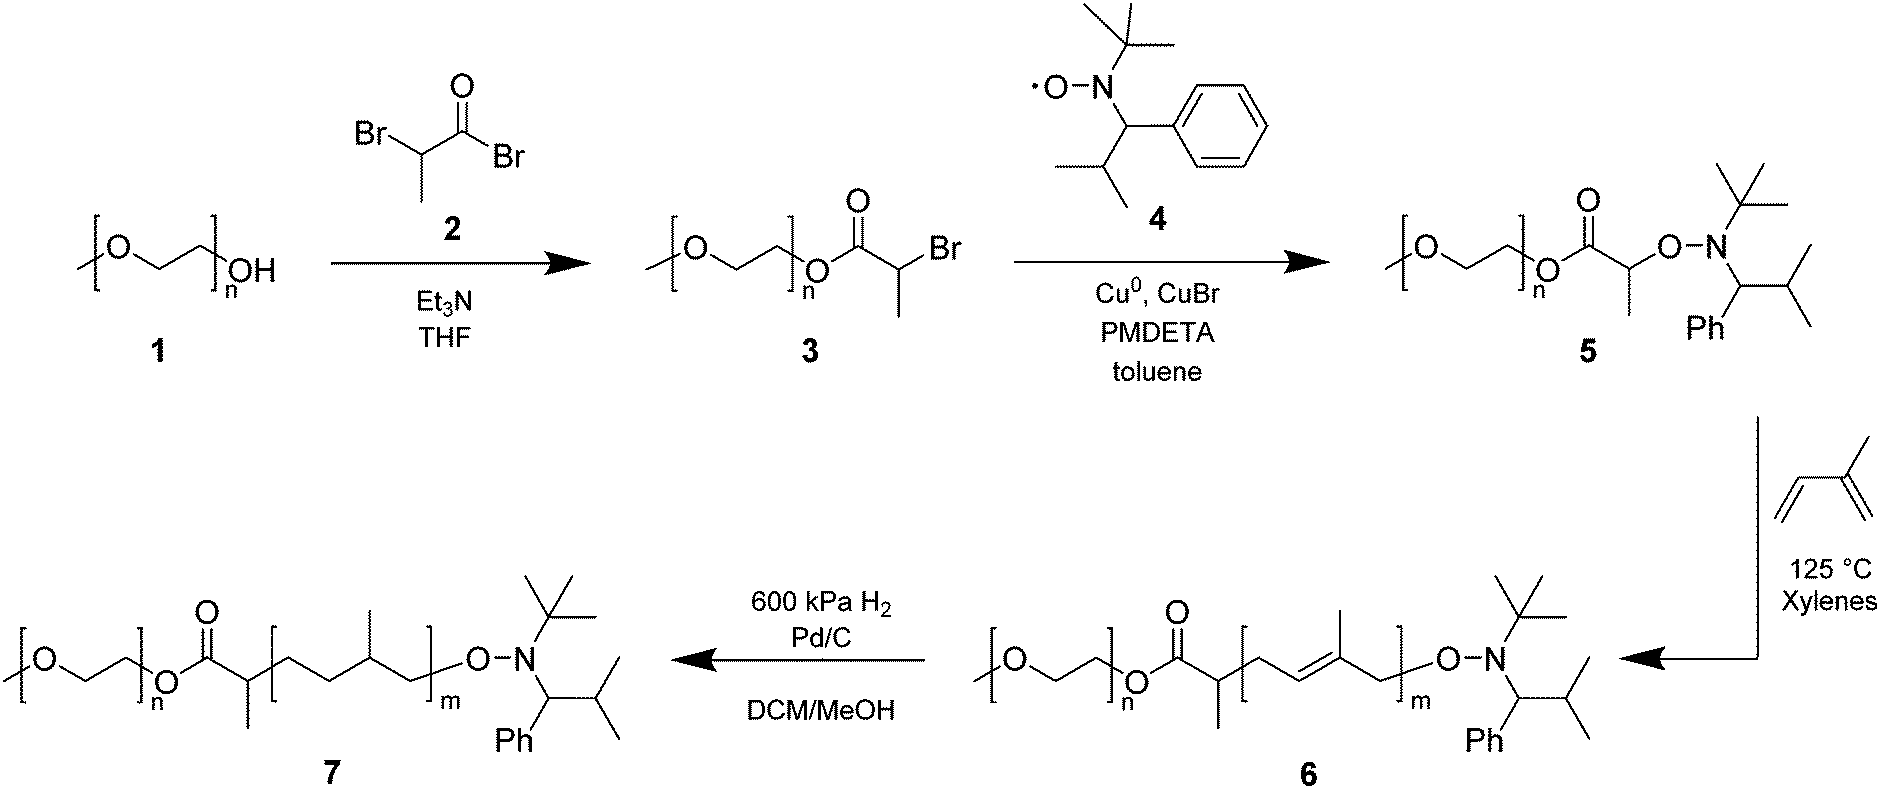 | ||
| Scheme 1 Synthesis of PI-b-PEG amphiphiles by NMP and subsequent hydrogenation. | ||
1H NMR (400 MHz, CDCl3) (Fig. S1–S3, ESI†): δ 4.34 (q, 1H), 4.25 (t, 2H), 3.78–3.37 (m, 4H per PEG unit), 3.31 (s, 3H), 1.76 (d, 3H).
:1 chloroform (CHCl3)/methanol (MeOH)). After concentration under reduced pressure, the residue was dissolved in CHCl3 and precipitated in cold Et2O, before being dried in vacuum. 5 was obtained as a white solid (slightly brown in case of PEG700-TIPNO) Yield: PEG700-TIPNO: 86%; PEG2000-TIPNO: 76%; PEG5000-TIPNO: 70%. In case of PEG700-TIPNO, a slightly modified purification process, based on the purification of TIPNO was used.28
1H NMR (400 MHz, CDCl3) (Fig. S4–S6, ESI†): δ 7.58–7.03 (m, 5H), 4.50 and 4.43 (q, 1H), 4.32–4.17 (m, 2H), 3.78–3.37 (m, 4H per PEG unit), 3.31 (s, 3H), 3.24 (d, 1H), 2.09 and 1.95 (m, 1H), 1.50 and 1.36 (d, 3H), 1.14 and 0.99 (d, 3H), 0.91 and 0.85 (s, 9H), 0.44 and 0.37 (d, 3H).
1H NMR (400 MHz, CDCl3) (Fig. S7–S9, ESI†): δ 5.79–5.59 (m, 1H per unit of 1,2-PI), 5.18–4.93 (m, 1H, 1,4-PI), 4.92–4.72 (m, 2H, 1,2-PI), 4.72–4.50 (m, 2H 3,4-PI), 4.17–4.05 (m, 2H), 3.79–3.35 (m, 4H 19 per unit of PEG), 3.31 (s, 3H), 2.09–1.84 (m, 2H, 1,4- and 3,4-PI), 1.68–1.45 (m, 3H, 1,4- and 3,4-PI).
1H NMR (400 MHz, CDCl3) (Fig. S7–S9, ESI†): δ 4.21–4.07 (m, 2H), 3.79–3.35 (m4, H 19 per unit of PEG), 3.31 (s, 3H), 1.71–0.52 (m, 10H per unit of isoprene).
Nuclear magnetic resonance spectroscopy (NMR). 1H NMR spectra were recorded on a AV-400 400 MHz spectrometer (Bruker, Billerica, MA). Samples were dissolved in CDCl3, at concentrations of roughly 10 mg mL−1. Measurements were performed at room temperature over 256 cycles. Chemical shifts, reported in ppm, were adjusted to the corresponding solvent peak (7.26 ppm).
Size exclusion chromatography (SEC). SEC was performed on a Viscotek TDAmax system (Viskotek, Houston, TX). The system consisted of two ViscoGEL columns (GMHHR-M, poly(styrene-co-divinylbenzene)), employing THF as the mobile phase. A differential refractive index detector (TDA 302, Viskotek) was used to determine macromolecular characteristics relative to a poly(methyl methacrylate) (PMMA) standard curve (PSS polymer Mainz, 2500–89
300 g mol−1). All samples were filtered using 0.2 μm syringe filters (PTFE) and measured at a flow rate of 0.5 mL min−1.
Vesicle preparation
Vesicles were prepared using a previously reported emulsification procedure.23 Briefly, 30 mg of polymer were dissolved in 100 μL of DCM and agitated for 1 h at room temperature. The mixture was then added to 1 mL sodium chloride-containing citrate buffer (250 mmol in citrate, pH = 2, 300 mOsmol kg−1), followed by sonication with a FB-705 sonic dismembrator (Thermo Fisher Scientific, Waltham, MA), at an amplitude of 5% for 1 min. During the sonication process, the sample was cooled using an ice bath. Afterwards, excess DCM was removed under vacuum (7 min, 40 °C, 70 kPa).In order to achieve an inner pH of 6.8, the above protocol was modified, switching to a sodium chloride-containing phosphate buffer (60 mM in phosphate, pH = 6.8, 300 mOsmol kg−1) instead of the citrate buffer.
Encapsulation of pyranine was achieved using the aforementioned vesicle preparation method, dissolving the hydrophilic dye pyranine in milliQ water (10 mM). Excess dye was removed using PD Miditrap G-25 size exclusion columns (GE healthcare, Uppsala, Sweden), applying the following protocol: after conditioning the column with milliQ water, 200 μL of pyranine-loaded vesicles were added, followed by 800 μL of milliQ water. Subsequently, 600 μL of milliQ water was added, and the eluent was collected.
Crosslinking of vesicles was performed using the photoinitiator 2-hydroxy-4-(2-hydroxyethoxy)-2-methylpropiophenone. Varying amounts of crosslinker were mixed with 1 mL vesicle solution in sodium chloride-containing citrate buffer (250 mM in citrate, pH = 2, 300 mOsmol kg−1), yielding crosslinker concentrations of 0.5, 1, 2, 5, and 10 mM. Crosslinking was carried out at room temperature under UV light (365 nm) for 6 h.
Vesicle characterization
Samples were analysed in phosphate buffer at pH 6.8, unless stated otherwise.Particle yield was calculated dividing the obtained polymer concentration by the maximal achievable concentration (30 mg mL−1).
Ammonia capture experiments
Ammonia capture in the absence of a pH gradient was conducted using the same setup, preparing the two cells as follows: the sample cell was prepared by mixing 2.97 mL of sodium chloride-containing phosphate buffer (60 mM in phosphate, pH = 6.8, 300 mOsmol kg−1) and 400 μL of vesicles in sodium chloride-containing phosphate buffer (60 mM in phosphate, pH = 6.8, 300 mOsmol kg−1, PI-b-PEG 10.2 mg mL−1). The reference cell was prepared using 3.375 mL of sodium chloride-containing phosphate buffer (60 mM in phosphate, pH = 6.8, 300 mOsmol kg−1). NH4Cl was added as described above.
Ammonia concentration was determined using the Berthelot assay.30 Briefly, samples, as well as a series of standards (62.5–1000 μM in NH4Cl) were pipetted in a 96-well plate (UV-Star, Greiner Bio-One, Kremsmünster, Austria). After addition of nitroprusside solution and alkaline hypochlorite solution to all wells (5:1 v/v solution/sample for both), the plate was incubated for 20 min at room temperature. Subsequent absorbance measurement at 636 nm on an infinite M200 PRO plate reader (TECAN, Männedorf, Switzerland) yielded ammonia concentrations. Ammonia capture (in μmol of ammonia per g of polymer) was calculated using the following formula (eqn (1)):
 | (1) |
Due to interference of Metamucil® with the Berthelot assay, ammonia concentrations were determined using the Randox assay kit (Randox Laboratories, Crumlin, UK).
Statistical analysis
Statistical analysis was performed using GraphPad Prism (Version 8.2.0). For the ammonia capture kinetic experiment, the area under the capture capacity vs. time curve from 0–8 h (AUC0–8h) were compared. For multiple groups, an ordinary one-way ANOVA and subsequent Tukey's multiple comparisons test was used. In case of two groups, an unpaired t-test was performed. For the assays performed in a colon-mimicking environment, and those involving crosslinked vesicles, statistical analysis was performed on the ammonia capture obtained after 24 h.Results and discussion
Polymer synthesis
The synthesis of PI-b-PEG polymers was carried out by nitroxide-mediated polymerization (NMP), following a previously published procedure.27 Briefly, PEG monomethyl ethers of different molecular weight (1) (700, 2000, and 5000 g mol−1) were reacted with methyl 2-bromopropionate (2) to yield PEG-functionalized bromopropionate (3). The latter was then radically coupled to the stable nitroxide TIPNO (4), which was synthesized following a procedure described by Hawker and coworkers,31 to form the corresponding PEG-functionalized alkoxyamine (5) (Scheme 1). Three PEG-based macroinitiators for NMP were obtained in high yields (>70%) and high purity (>95%) (Fig. S4–S6, ESI†). Subsequent polymerizations of isoprene were carried out under inert conditions at 125 °C in xylenes. For each of the three alkoxyamines a library of amphiphilic block copolymers with different PI/PEG (w/w) ratios was obtained and characterized by size exclusion chromatography (SEC) and 1H-NMR spectroscopy (Table 1).| PI/PEG [w/w] | M n [g mol−1] | Đ | d [nm] | PDIc | d [μm] | Spand | Yieldb [%] | |
|---|---|---|---|---|---|---|---|---|
| Abbreviations: Mn: number average molecular weight, Đ: dispersity; d: particle diameter, PDI: particle polydispersity index; span: width of distribution.a Calculated by 1H-NMR.b Measured by SEC in THF.c Determined by DLS.d Determined by LD.*Diameter larger than 800 nm; —No particles detected. PI-b-PEG2000 polymers (PI/PEG (w/w) ratios of 1.32, 1.99, 2.30, 2.90, 3.62) are the same as previously reported.29 | ||||||||
| PI-b-PEG700 | 0.92 | 1300 | 1.18 | 240 | 0.34 | — | — | 55 |
| 1.94 | 2100 | 1.23 | * | 5.28 | 1.14 | 42 | ||
| 3.03 | 2800 | 1.38 | * | 6.10 | 1.89 | 54 | ||
| 4.14 | 3600 | 1.25 | * | 10.3 | 1.73 | 44 | ||
| 5.76 | 4700 | 1.24 | * | 10.6 | 2.45 | 16 | ||
| PI-b-PEG2000 | 0.84 | 3700 | 1.34 | 120 | 0.30 | — | — | 45 |
| 1.32 | 4600 | 1.25 | 240 | 0.23 | — | — | 50 | |
| 1.99 | 6000 | 1.28 | * | 8.00 | 1.93 | 34 | ||
| 2.30 | 6600 | 1.30 | * | 6.99 | 1.82 | 39 | ||
| 2.38 | 6800 | 1.25 | * | 7.48 | 2.47 | 33 | ||
| 2.90 | 7800 | 1.25 | * | 6.23 | 1.09 | 24 | ||
| 3.44 | 8900 | 1.26 | * | 6.71 | 3.35 | 24 | ||
| 3.62 | 9200 | 1.27 | * | 7.79 | 2.55 | 24 | ||
| 4.52 | 11000 |
1.29 | * | 6.22 | 8.96 | 3 | ||
| PI-b-PEG5000 | 0.77 | 8900 | 1.20 | 120 | 0.27 | — | — | 46 |
| 1.51 | 12600 |
1.56 | 230 | 0.32 | — | — | 50 | |
| 2.37 | 16900 |
1.22 | * | 25.6 | 4.10 | 11 | ||
| 3.03 | 20200 |
1.17 | * | 18.7 | 6.63 | 2 | ||
| 4.63 | 28200 |
1.29 | — | — | — | — | 0 | |
To determine the number average molecular weights (Mn) by NMR, the proton-weighted ratio of the PEG-CH3 and the residual double bonds of the PI block were used (Fig. 1a). Further, the mode of incorporation of the isoprene units was characterized by 1H-NMR spectroscopy, comparing the integrals in the region between 4.5 and 6 ppm. Molar ratios of 1,4-isomers to 1,2- and 3,4-isomers of about 9:1 were obtained, which is in accordance with previous findings for the polymerization of isoprene (Table S1, ESI†).32–35
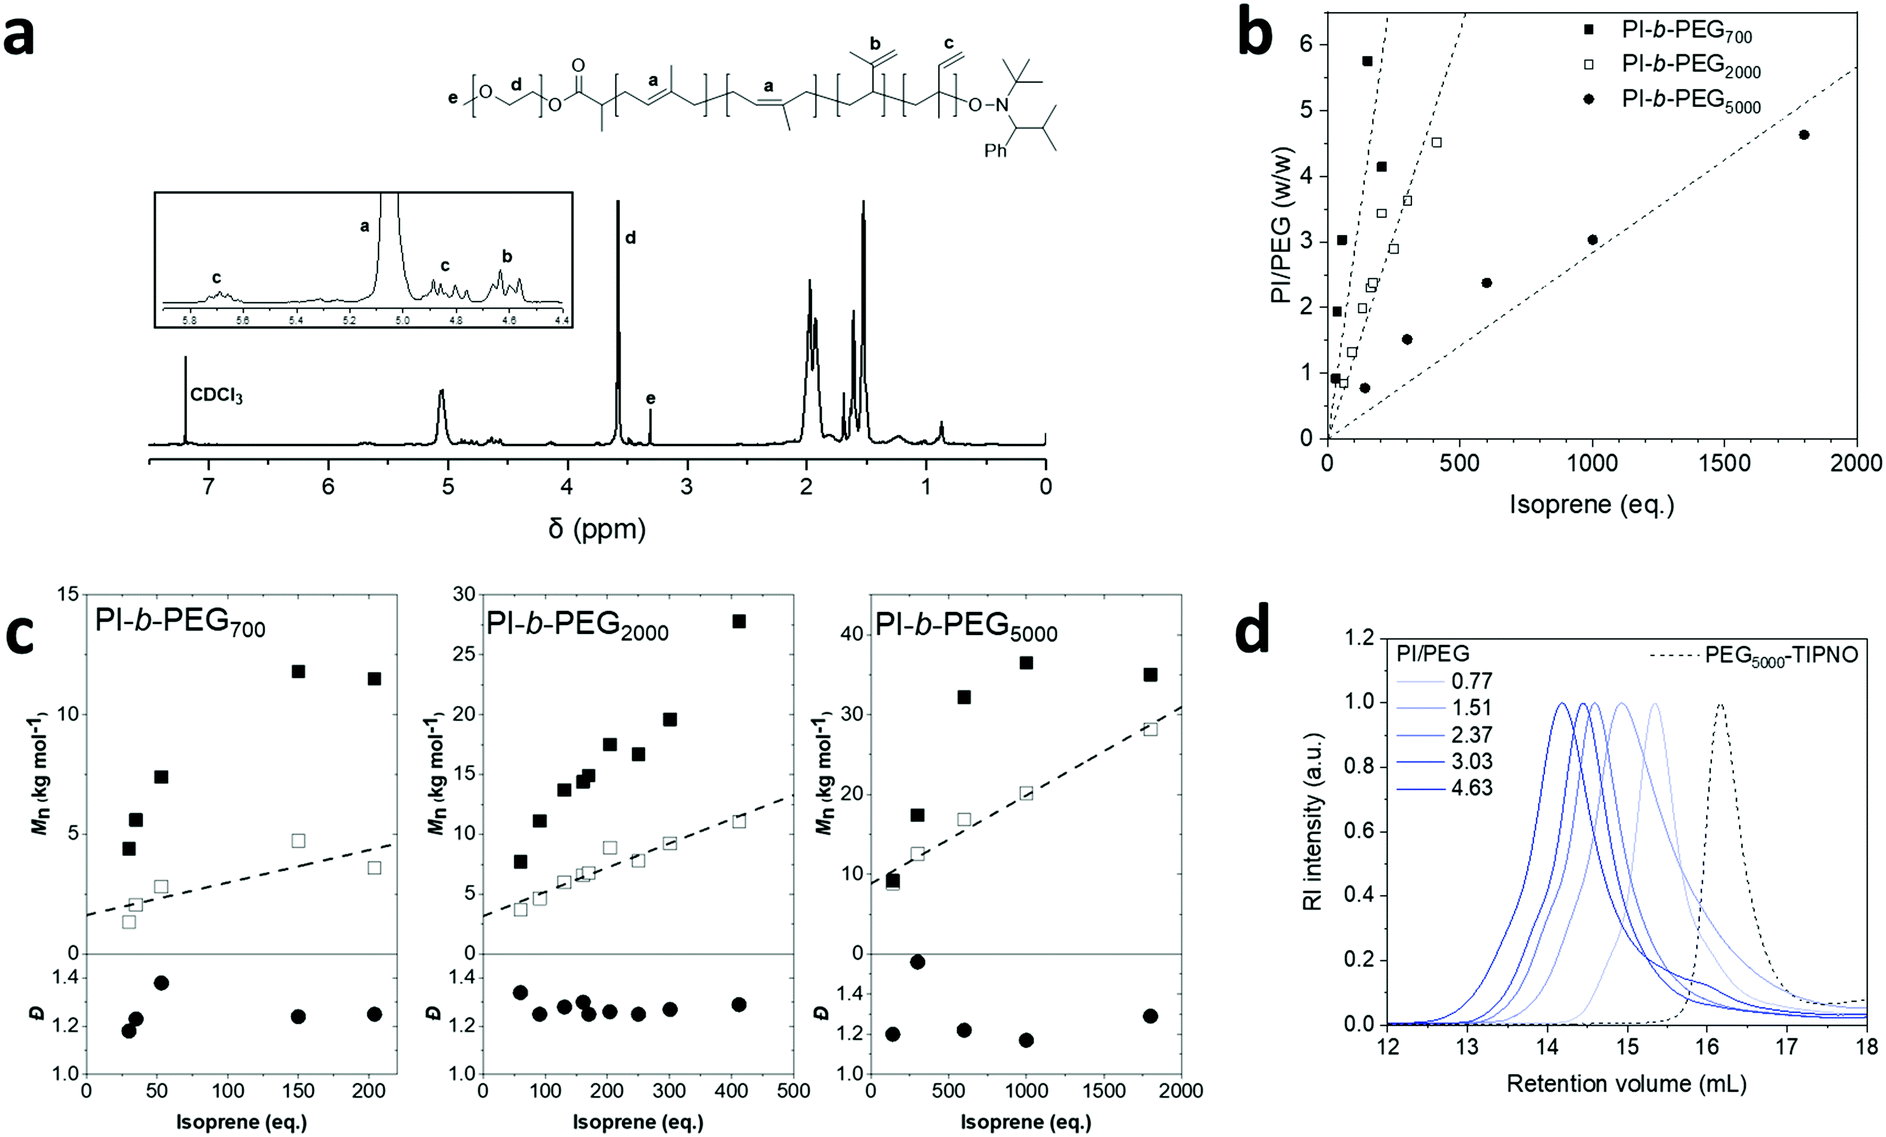 | ||
| Fig. 1 1H-NMR spectrum of PI-b-PEG polymer in CDCl3 (a). Ratios of PI/PEG (w/w) plotted against equivalents of isoprene after 48 h of polymerization (b). Molecular weights obtained by SEC (black squares), 1H-NMR (white squares), and dispersity values (black circles) obtained via SEC plotted against equivalents of isoprene after 48 h of polymerization (c). Size exclusion chromatograms of the PI-b-PEG5000 library (d). Polymers of the PEG 2000 series (ratios 1.32, 1.99, 2.30, 2.90, 3.62) are the same as previously reported.29 | ||
The PI/PEG (w/w) ratio was varied by changing the isoprene monomer feed while keeping the amount of alkoxyamine and the reaction conditions constant (Fig. 1b). Increasing the monomer feed, led to a linear increase in molecular weight, confirmed by 1H-NMR and SEC (Fig. 1c). The discrepancies between the molecular weights obtained by both methods can be explained by the use of PMMA standards to calibrate the SEC system. At lower monomer feed, the PI-b-PEG700 polymers deviated slightly from the linear trend. This can be ascribed to potential loss of monomer during freeze–thaw cycles due to the small isoprene quantities used in these reactions. Dispersities observed in the polymerizations (Đ = 1.2–1.3) were in accordance with a previous publication.27 While showing the typical shift to lower retention volumes with increasing monomer feed for all three of the libraries, the size exclusion chromatograms exhibited a slight shoulder peak at higher retention volumes, suggesting incomplete initiator coupling with increasing monomer feed (Fig. 1d). In fact, a previous report on alkoxyamine syntheses via radical coupling to TIPNO indicated a side reaction, namely the formation of the PEG-propionate ester with an up to 30% yield.27 However, the characteristic peaks of this by-product could not be found in any of the 1H-NMR spectra measured in this study. In addition, at lower retention volumes SEC also showed a small shoulder at higher monomer feeds in the PEG 2000 as well as PEG 5000 series, which are most likely caused by termination events, such as radical coupling.27 Therefore, our amphiphiles exhibited characteristics in line with a previous report.27
In an effort to change the characteristics of the hydrophobic block, several of the PI-b-PEG polymers were hydrogenated (Fig. S7–S9, Table S2, ESI†) yielding polymers 7 (PI(H)-b-PEG, Scheme 1). Completion of the hydrogenation reaction was confirmed by the disappearance of the olefinic protons in the 1H-NMR spectrum (Fig. S7–S9, ESI†). In addition, SEC of 7 confirmed that hydrogenation had no effect on the macromolecular characteristics (Fig. S10, ESI†). Therefore, libraries of PI-b-PEG polymers with varied length of both the hydrophobic and the hydrophilic block, as well as unsaturated and hydrogenated polymer backbones were obtained (Table 1 and Table S2, ESI†) and used in subsequent experiments.
Formation of polymersomes
Recently, our group described the formation of transmembrane pH gradient polymersomes comprised of PI-b-PEG block copolymers, that were able to capture the metabolite trimethylamine (TMA), showing promise for the topical symptomatic treatment of trimethylaminuria.29 Employing the optimized conditions found in this previous study, we attempted to prepare vesicles with our amphiphiles having an inside pH of 2.0 using an emulsification process.23 Sizes of macromolecular assemblies were analyzed by DLS. In cases where diameters obtained via DLS exceeded 800 nm, laser diffraction was employed (Table 1). Overall, diameters in the upper nanometer or lower micrometer range were targeted to minimize uptake of vesicles by intestinal cells and with that avoiding systemic exposure.36For all three of the libraries (PI-b-PEG700, 2000, or 5000), amphiphiles exceeding a PI/PEG (w/w) ratio of 1.5 resulted in structures in the low micron range with relatively narrow size distributions (Table 1 and Fig. S11, ESI†). Smaller diameters (<300 nm) were observed at ratios below 1.5, indicating the presence of another population than the expected micrometer-sized polymersomes.
To gain a better understanding of the effect of different PI/PEG (w/w) ratios on the morphology of the supramolecular assemblies, TEM experiments using the PI-b-PEG2000 polymersomes were performed (Fig. 2). At a PI/PEG (w/w) ratio of 0.84 (i.e., high fraction of PEG) mainly spherical structures with diameters of approximately 30 nm were detected (Fig. 2a), correlating with diameters usually reported for polymeric micelles.27 While increasing the length of the hydrophobic block (PI/PEG 1.32), formation of tubes and larger spherical/irregular structures was observed (Fig. 2b). In fact, large spherical structures with diameters in the range of 100–600 nm appeared to be the main species formed at PI/PEG (w/w) ratios over ∼2.0 (Fig. 2c–g). The vesicular structure of these larger spheres was confirmed by cryo-TEM measurements (Fig. 2h), revealing diameters in the range of 100–600 nm and a membrane thickness of approximately 20 nm. The observed changes in morphology, from micellar to tubular and ultimately vesicular structures with increasing length of the PI block, are in line with literature reports on other block copolymer systems.37,38
 | ||
| Fig. 2 Representative TEM images of the supramolecular assemblies of PI-b-PEG2000 polymers with different PI/PEG (w/w) ratios in phosphate buffer at pH 6.8 (scale bar set to 500 nm) (a–g). For more images see Fig. S13–S19 (ESI†). Cryo-TEM images (PI/PEG2000 1.99) (scale bar: 300 nm) (h). | ||
Besides changes in morphology, we observed a decrease in the amount of large vesicles in the TEM images whilst increasing the PI/PEG (w/w) ratio from 1.99 to 4.52 (Fig. 2c–g). This finding was further supported by calculations of particle yields, which showed a close to linear decrease with increasing length in PI (Fig. S12 (ESI†) and Table 1). This observation could be explained by the potential formation of aggregates during the vesicle preparation procedure, which is usually more pronounced for longer hydrophobic blocks.39,40
In a next step, we aimed at correlating these morphological data to the ability of the vesicles to capture and retain the metabolite ammonia.
Ammonia capture by pH gradient PI-b-PEG polymersomes in phosphate buffer
The ability of pH gradient PI-b-PEG vesicles (pHinside = 2.0) to sequester ammonia was investigated in side-by-side diffusion cells in the presence of phosphate buffer at pH 6.8 over 24 h (Fig. 3a–c). In comparison to PI-b-PEG5000, ammonia capture capacity was significantly higher for PI-b-PEG700 and PI-b-PEG2000 vesicles. However, almost all tested vesicles seemed to reach a plateau within the first 2 to 4 h, followed by a slight reduction in capture capacity towards longer times (24 h). This is most likely due to an increase in osmolarity of the vesicle core after initial ammonia uptake resulting in a loss of entrapped ammonia over time.41 Plotting ammonia capture capacity after 24 h vs. PI/PEG (w/w) ratio revealed a dependency on the length of the hydrophobic block, following a bell shaped curve distribution (mainly for PI-b-PEG2000 and PI-b-PEG5000 systems) with increasing PI/PEG ratios (Fig. S20 and Table S3, ESI†). This behavior was most noticeable for the PI-b-PEG2000 series, and in accordance with TEM experiments (Fig. 2). The ammonia capture of the PI-b-PEG2000 was directly correlated to the presence of the larger spherical structures. These were observed at PI/PEG (w/w) ratios above 0.84 and most pronounced at a ratio of 1.99 (Fig. 2c), which was also the polymer showing the highest ammonia capture capacity of all tested PI-b-PEG. The subsequent decrease in capture at higher ratios could be ascribed to the aforementioned decrease in vesicle concentration. Noteworthy, the ammonia uptake obtained with the polymer having a PI/PEG (w/w) ratio of 1.99 (720 μmol NH3 per g polymer, Table S3, ESI†) was similar to that previously achieved with liposomes (∼800 μmol g−1).23 Furthermore, the uptake exceeded those reported for PS-b-PEG polymersomes (∼500 μmol g−1)23 and AST120 (∼25 μmol g−1), a carbon microparticle based system, which has shown to lower ammonia levels in vivo.42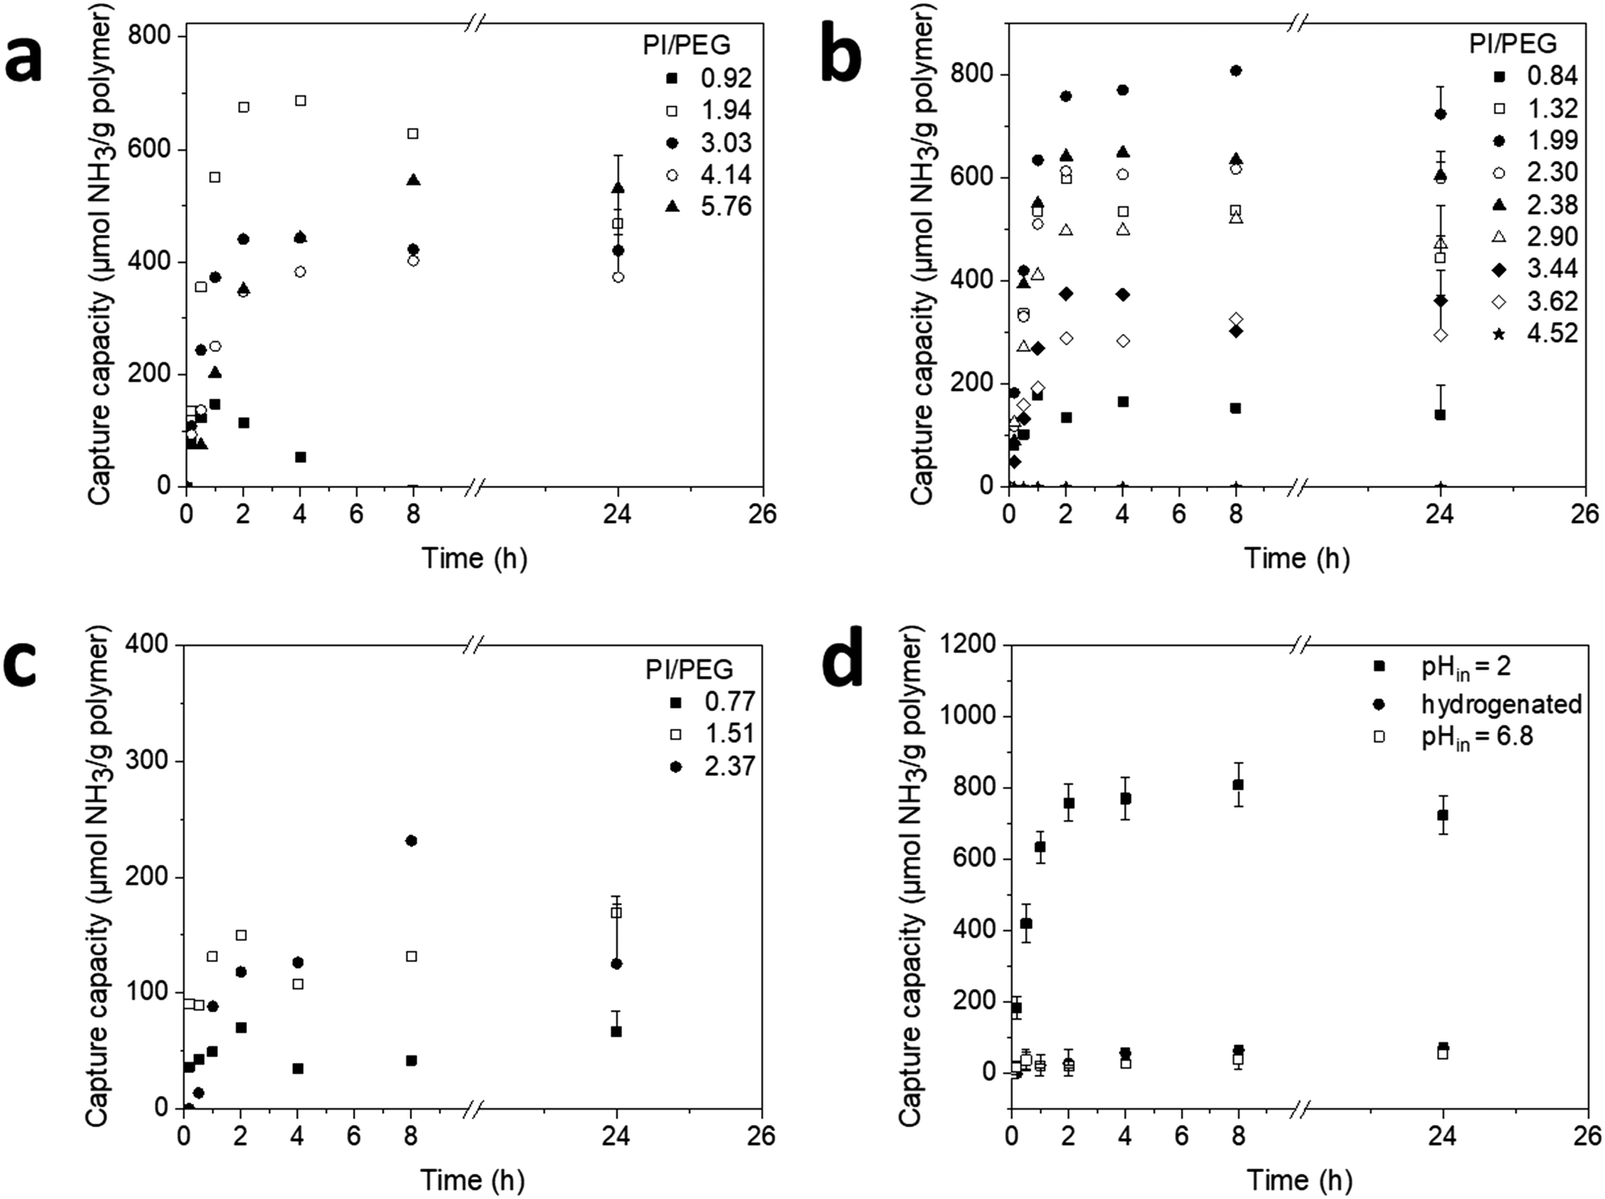 | ||
| Fig. 3 Ammonia capture capacity over time of PI-b-PEG polymersomes of the PEG 700 (a), PEG 2000 (b), and PEG 5000 (c) series (for clarity reasons error bars are only plotted for the last data points). Ammonia capture by polymersomes comprised of PI-b-PEG2000 (PI/PEG of 1.99) in the presence (same data as in b), or absence of a pH gradient, and its hydrogenated analogue in the presence of a pH gradient (d). Data are presented as mean + SD for a–c, and mean ± SD for d (n = 3). Statistics were performed on the area under the capture capacity vs. time curve from 0–8 h (AUC0–8h) for a–d (Tables S4 and S7, ESI†). | ||
In case of PI-b-PEG700 highest uptake of ammonia was obtained for PI/PEG (w/w) ratios of 1.9–5.8 (∼450 μmol g−1, Table S3, ESI†). In contrast, ammonia capture was rather low for PI-b-PEG5000 (highest amount was 170 μmol g−1 for PI/PEG (w/w) 1.51, Table S3, ESI†). To investigate the effect of PI hydrophobicity on the polymersome properties, the hydrogenated polymers (PI(H)-b-PEG) were also tested for their ability to capture ammonia. These polymersomes yielded rather low values (<170 μmol g−1) (Fig. 3d and Table S2, ESI†).
To ensure that ammonia sequestration of PI-b-PEG vesicles was indeed occurring as a result of the transmembrane pH gradient, a control experiment using vesicles having an internal pH of 6.8 was performed (Fig. 3d). As expected, ammonia capture was negligible, confirming that encapsulation was driven by the pH gradient.
In order to confirm that vesicular structures of the supramolecular assemblies were obtained at certain PI/PEG (w/w) ratios, encapsulation experiments were carried out, using the hydrophilic, negatively charged dye, pyranine, which can only be associated to polymersomes when entrapped in the aqueous core. For PI-b-PEG2000, encapsulation experiments were reported previously and the data confirmed a vesicle structure for PI-b-PEG2000 with PI/PEG (w/w) ratios of 1.32 to 2.90.29 Encapsulation experiments with PI-b-PEG700 indirectly revealed a high proportion of hollow structures (Fig. S21, ESI†), supporting the elevated ammonia capture values at high PI/PEG700 (w/w) ratios. At the same time, supramolecular assemblies of PI-b-PEG5000 showed very little encapsulation of the dye (Fig. S21, ESI†), indirectly confirming the low proportion of vesicular structures. Particles prepared with hydrogenated polymers resulted in poor encapsulation of pyranine revealing a low vesicle yield (Fig. S21, ESI†) and were not investigated further. It is to note, that the solubility of hydrogenated polymers with PI(H) blocks exceeding 4000 g mol−1 was limited in DCM resulting in highly viscous solutions at concentrations ≥30 mg mL−1, rendering particle formation difficult (Table S2, ESI†). This was most likely caused by the decreased polarity of PI(H) chains as compared to PI.
Since the PI-b-PEG2000 amphiphiles yielded vesicles with the highest capture capacity, these polymers were selected for further experiments.
Ammonia capture in simulated intestinal fluid and mimicked colon environment
One of the main challenges related to the oral administration of phospholipid vesicles (liposomes) are their degradation by GI lipases and destabilization by intestinal surfactants (i.e., bile salts).43 As PI-b-PEG is not biodegradable, vesicles made from this polymer would not be digested by GI enzymes. To assess ammonia capture capacity by the vesicles in the presence of bile salts, the assay buffer was supplemented with cholate, deoxycholate, and taurocholate at high concentrations (30 mM each) to simulate intestinal fluid. The concentrations used exceed what is typically found in GI fluids by a factor of 2,44 and were reported to not only destabilize liposomes45 but also vesicles comprised of the amphiphilic diblock poly(butadiene)-b-PEG in vitro.23 Vesicles prepared with the lead polymer (PI-b-PEG2000, PI/PEG (w/w) of 1.99) were able to take up ammonia in bile salt-supplemented medium, showing a decrease of only ∼25% in capture after 24 h compared to the experiment performed in phosphate buffer (540 μmol g−1 in bile salt vs. 720 μmol g−1 in phosphate buffer) (Table S3, ESI†). Although the overall ammonia uptake by the vesicles was reduced due to the presence of the intestinal surfactants, ammonia capture plateaued after ∼2 to 4 h (Fig. 4a and Fig. S22, ESI†), as was also observed for vesicles in phosphate buffer. Plotting ammonia capture capacity after 24 h vs. PI/PEG (w/w) ratio revealed the same bell-shaped curve profile as seen in phosphate buffer, although with slightly reduced uptake values (Fig. 4b and Table S3, ESI†). | ||
| Fig. 4 Ammonia capture capacity over time of PI-b-PEG2000 polymersomes (PI/PEG (w/w) ratio of 1.99) in phosphate buffer and simulated intestinal fluids (with bile salts) (a). Ammonia capture capacity vs. PI/PEG (w/w) ratio of PI-b-PEG2000 polymersomes in phosphate buffer and simulated intestinal fluids (with bile salts) (b). Ammonia capture capacity of PI-b-PEG2000 polymersomes (PI/PEG (w/w) ratio of 1.99 and 2.30) after a 24 h incubation in media containing different concentrations of dietary fiber (Metamucil®) (c). Data are presented as mean ± SD for (a and b), and mean + SD for (c), (n = 3). Statistics were performed on the area under the capture capacity vs. time curve from 0–8 h (AUC0–8h) for (a) (Table S7, ESI†) and on the 24 h capture capacity values for (c) (Table S8, ESI†). | ||
During transit of the polymersomes through the GI tract, the external medium in which they are suspended becomes dehydrated, due to the absorption of water in the colon.46 Such an environment may further destabilize the vesicles.23 In order to evaluate the performance of PI-b-PEG polymersomes in a simulated colon environment, the two polymersome formulations (PI-b-PEG2000, PI/PEG (w/w) 1.99 and 2.30) showing the highest ammonia capture in bile salt-supplemented medium were further tested in dietary fiber (Metamucil®)-based hydrogels containing 50% water.23 In this partially dehydrated medium, ammonia uptake was abolished for both vesicle systems (Fig. 4c). These results are in accordance with a previous report, showing the destabilization of the PS-b-PEG polymersomal bilayer, and loss of the pH gradient in this medium partly mimicking conditions in the colon.23
Increasing stability of polymersomes in the environment of the colon by polymeric crosslinking
In the past, polymeric crosslinking has been reported to stabilize both PI-b-PEG micelles, and liposomes.27,47 Therefore, we decided to investigate whether crosslinking of the residual olefinic bonds in the PI block would enhance vesicle stability (Fig. 5a) in the environment of the colon. Each isoprene unit bears one olefinic bond, which can be used for further chemical modification48,49 or crosslinking.50,51 UV-triggered crosslinking was performed by mixing different amounts of the photoinitiator 2-hydroxy-4′-(2-hydroxyethoxy)-2-methylpropiophenone with PI-b-PEG2000 vesicles for 6 h under UV exposure. After the crosslinking process, vesicles were insoluble upon lyophilization and resuspension in organic solvents, such as DCM (Fig. S23, ESI†). Conventional TEM and cryo-TEM experiments of the crosslinked vesicles confirmed that the vesicular structure was maintained, showing diameters and membrane thickness (∼20 nm) (Fig. 5d–e) similar to the native vesicles (Fig. 2c and h). Hence, the crosslinking step did not affect vesicle morphology. | ||
| Fig. 5 Schematic representation of the crosslinking reaction (a). Ammonia capture capacity of crosslinked PI-b-PEG2000 polymersomes (PI/PEG (w/w) ratio of 1.99) in phosphate buffer after 24 h (b). Ammonia capture capacity of native and crosslinked PI-b-PEG2000 (PI/PEG 1.99) polymersomes after a 24 h incubation in medium containing different concentrations of dietary fiber (Metamucil®) (c). Representative TEM (d, scale bars: 500 nm) and cryo-TEM images (e, scale bars: 300 nm) of PI-b-PEG2000 vesicles (PI/PEG 1.99) after crosslinking. Data are presented as mean + SD (n = 3). Statistics were performed on the 24 h capture capacity values in (b) and (c) (Tables S8–S9, ESI†). | ||
Subsequently, we investigated the ammonia capture capacity of crosslinked PI-b-PEG2000 vesicles (PI/PEG (w/w) 1.99). In phosphate buffer, the uptake decreased with increasing concentration of crosslinker, levelling out at a concentration of 2 mM (Fig. 5b). This was most likely due to a decrease in permeability of the bilayer membrane after crosslinking.52 In order to minimize this effect, a concentration of 1 mM of crosslinker was chosen and ammonia capture was tested under partially dehydrated conditions to mimic colon environment. After incubation in 50% dietary fiber (Metamucil®)-based medium for 24 h, ammonia capture was at 200 μmol g-1 (Fig. 5c). Hence, crosslinked vesicles proved to be far superior to their non-crosslinked analogues in this environment, preserving approximately 35% of their capture capacity in phosphate buffer. Furthermore, uptake values were significantly higher than those reported for PS-b-PEG polymersomes,23 which did not show significant capture after incubation in dietary fiber-based medium.
Conclusion
In summary, we reported the synthesis of a range of PI-b-PEG amphiphiles and their hydrogenated analogues, employing nitroxide-mediated polymerization. Several PI-b-PEG polymers, especially PI-b-PEG2000, were able to self-assemble into vesicular structures and were found to display superior ammonia uptake than other vesicular systems investigated for GI delivery to-date. We discovered that ammonia capture capacity is highly dependent upon the PI/PEG (w/w) ratio of the polymersomes. The best polymer was PI-b-PEG2000 with a PI/PEG ratio of 1.99, which produced polymersomes in high yields. The function and integrity of polymersomes could be further increased through polymeric crosslinking. The latter proved quite important because although PI-b-PEG vesicles showed a quite preserved ammonia capture capacity in simulated intestinal fluids (bile salts), they readily destabilized under conditions mimicking the colonic environment. Olefinic bond crosslinking increased vesicle stability in this environment, preserving roughly 35% of the ammonia capture capacity of the polymersome in phosphate buffer. This illustrates the potential for crosslinking as a key to maintaining vesicular stability within the colon. The PI-b-PEG polymersomes presented in this study hold great promise for the development of a stable and efficient oral biodetoxification system.Conflicts of interest
J.-C. L. owns shares in Versantis AG, which is developing vesicles for the treatment of hyperammonemia.Acknowledgements
The authors gratefully acknowledge funding from the Swiss National Science Foundation (grant 2-77082-16). The authors further thank Frank Steiniger (Electron Microscopy Center of the University Hospital Jena, Germany) and Stephan Handschin (ScopeM, ETH Zurich, Switzerland) for performing the EM measurements.References
- P. A. Bromberg, E. D. Robin and C. E. Forkner, J. Clin. Invest., 1960, 39, 332 CrossRef PubMed.
- G. Wright, L. Noiret, S. W. M. Olde Damink and R. Jalan, Liver Int., 2011, 31, 163 CrossRef PubMed.
- J. Häberle, Arch. Biochem. Biophys., 2013, 536, 101 CrossRef PubMed.
- M. L. Summar, S. Koelker, D. Freedenberg, C. Le Mons, J. Haberle, H. S. Lee and B. Kirmse, Mol. Genet. Metab., 2013, 110, 179 CrossRef PubMed.
- S. W. M. Olde Damink, R. Jalan, D. N. Redhead, P. C. Hayes, N. E. P. Deutz and P. B. Soeters, Hepatology, 2002, 36, 1163 CrossRef PubMed.
- T. Gerber and H. Schomerus, Drugs, 2000, 60, 1353 CrossRef CAS PubMed.
- J. P. Ong, A. Aggarwal, D. Krieger, K. A. Easley, M. T. Karafa, F. Van Lente, A. C. Arroliga and K. D. Mullen, Am. J. Med., 2003, 114, 188 CrossRef CAS.
- P. Ott and H. Vilstrup, Metab. Brain Dis., 2014, 29, 901 CrossRef CAS.
- D. H. Patil, D. Westaby, Y. R. Mahida, K. R. Palmer, R. Rees, M. L. Clark, A. M. Dawson and D. B. Silk, Gut, 1987, 28, 255 CrossRef CAS.
- K. R. Lawrence and J. A. Klee, Pharmacotherapy, 2008, 28, 1019 CrossRef CAS.
- D. J. Kang, G. Kakiyama, N. S. Betrapally, J. Herzog, H. Nittono, P. B. Hylemon, H. Zhou, I. Carroll, J. Yang, P. M. Gillevet, C. Jiao, H. Takei, W. M. Pandak, T. Iida, D. M. Heuman, S. Fan, O. Fiehn, T. Kurosawa, M. Sikaroodi, R. B. Sartor and J. S. Bajaj, Clin. Transl. Gastroenterol., 2016, 7, e187 CrossRef CAS.
- M. J. Blaser, Science, 2016, 352, 544 CrossRef CAS.
- C. Costelloe, C. Metcalfe, A. Lovering, D. Mant and A. D. Hay, BMJ, 2010, 340, 1120 CrossRef.
- B. G. Bell, F. Schellevis, E. Stobberingh, H. Goossens and M. Pringle, BMC Infect. Dis., 2014, 14, 13 CrossRef PubMed.
- V. Forster, R. D. Signorell, M. Roveri and J.-C. Leroux, Sci. Transl. Med., 2014, 6, 258ra141 CrossRef.
- V. Agostoni, S. H. Lee, V. Forster, M. Kabbaj, C. R. Bosoi, M. Tremblay, M. Zadory, C. F. Rose and J.-C. Leroux, Adv. Funct. Mater., 2016, 26, 8382 CrossRef CAS.
- T. X. Nguyen, L. Huang, M. Gauthier, G. Yang and Q. Wang, Nanomedicine, 2016, 11, 1169 CrossRef CAS.
- C. Zylberberg and S. Matosevic, Drug Delivery, 2016, 23, 3319 CrossRef CAS.
- J. S. Lee and J. Feijen, J. Controlled Release, 2012, 161, 473 CrossRef CAS.
- F. Meng, Z. Zhong and J. Feijen, Biomacromolecules, 2009, 10, 197 CrossRef CAS PubMed.
- J. C.-M. Lee, M. Santore, F. S. Bates and D. E. Discher, Macromolecules, 2002, 35, 323 CrossRef CAS.
- D. H. Levine, P. P. Ghoroghchian, J. Freudenberg, G. Zhang, M. J. Therien, M. I. Greene, D. A. Hammer and R. Murali, Methods, 2008, 46, 25 CrossRef CAS.
- S. Matoori, Y. Bao, A. Schmidt, E. J. Fischer, R. Ochoa-Sanchez, M. Tremblay, M. Oliveira, C. F. Rose and J.-C. Leroux, Small, 2019, 1902347 CrossRef.
- S. Hocine, D. Cui, M. N. Rager, A. Di Cicco, J. M. Liu, J. Wdzieczak-Bakala, A. Bruîlet and M. H. Li, Langmuir, 2013, 29, 1356 CrossRef.
- J. M. Widmaier and G. C. Meyer, Macromolecules, 1981, 14, 450 CrossRef.
- J. Rieger, J. Therm. Anal., 1996, 46, 965 CrossRef.
- J. K. Wegrzyn, T. Stephan, R. Lau and R. B. Grubbs, J. Polym. Sci., Part A: Polym. Chem., 2005, 43, 2977 CrossRef.
- D. Benoit, V. Chaplinski, R. Braslau and C. J. Hawker, J. Am. Chem. Soc., 1999, 121, 3904 CrossRef.
- A. C. Schmidt, E. Hebels, C. Weitzel, A. Kletzmayr, Y. Bao, C. Steuer and J.-C. Leroux, Adv. Sci., 2020 DOI:10.1002/advs.201903697.
- T. T. Ngo, A. P. H. Phan, C. F. Yam and H. M. Lenhoff, Anal. Chem., 1982, 54, 46 CrossRef CAS.
- D. Benoit, V. Chaplinski, R. Braslau and C. J. Hawker, J. Am. Chem. Soc., 1999, 121, 3904 CrossRef CAS.
- D. Benoit, E. Harth, P. Fox, R. M. Waymouth and C. J. Hawker, Macromolecules, 2000, 33, 363 CrossRef CAS.
- V. Jitchum and S. Perrier, Macromolecules, 2007, 40, 1408 CrossRef CAS.
- Y. Bao, T. Boissenot, E. Guégain, D. Desmaële, S. Mura, P. Couvreur and J. Nicolas, Chem. Mater., 2016, 28, 6266 CrossRef.
- Y. Bao, E. Guégain, J. Mougin and J. Nicolas, Polym. Chem., 2018, 9, 687 RSC.
- M. P. Desai, V. Labhasetwar, E. Walter, R. J. Levy and G. L. Amidon, Pharm. Res., 1997, 14, 1568 CrossRef.
- G. Srinivas, D. E. Discher and M. L. Klein, Nat. Mater., 2004, 3, 638 CrossRef.
- L. Zhang and A. Eisenberg, J. Am. Chem. Soc., 1996, 118, 3168 CrossRef.
- K. Letchford and H. Burt, Eur. J. Pharm. Biopharm., 2007, 65, 259 CrossRef.
- T. Riley, S. Stolnik, C. R. Heald, C. D. Xiong, M. C. Garnett, L. Illum, S. S. Davis, S. C. Purkiss, R. J. Barlow and P. R. Gellert, Langmuir, 2001, 17, 3168 CrossRef.
- N. Bertrand, C. Bouvet, P. Moreau and J. C. Leroux, ACS Nano, 2010, 4, 7552 CrossRef.
- C. R. Bosoi, C. Parent-Robitaille, K. Anderson, M. Tremblay and C. F. Rose, Hepatology, 2011, 53, 1995 CrossRef PubMed.
- R. N. Rowland and J. F. Woodley, Biochim. Biophys. Acta, Lipids Lipid Metab., 1980, 620, 400 CrossRef.
- T. T. Kararli, Biopharm. Drug Dispos., 1995, 16, 351 CrossRef.
- K. Andrieux, L. Forte, S. Lesieur, M. Paternostre, M. Ollivon and C. Grabielle-Madelmont, Eur. J. Pharm. Biopharm., 2009, 71, 346 CrossRef.
- R. Jensen, D. Buffangeix and G. Covi, Clin. Chem., 1976, 22, 1351 CrossRef.
- J. Okada, S. Cohen and R. Langer, Pharm. Res., 1995, 12, 576 CrossRef.
- A. Brydon and G. G. Cameron, Prog. Polym. Sci., 1975, 4, 209 CrossRef.
- J. C. Brosse, I. Campistron, D. Derouet, A. El Hamdaoui, S. Houdayer, D. Reyx and S. Ritoit-Gillier, J. Appl. Polym. Sci., 2000, 78, 1461 CrossRef.
- M. Maskos and J. R. Harris, Macromol. Rapid Commun., 2001, 22, 271 CrossRef.
- K. Procházka, M. K. Baloch and Z. Tuzar, Die Makromol. Chemie, 1979, 180, 2521 CrossRef.
- X. Wang, G. Liu, J. Hu, G. Zhang and S. Liu, Angew. Chem., Int. Ed., 2014, 53, 3138 CrossRef.
Footnote |
| † Electronic supplementary information (ESI) available. See DOI: 10.1039/d0sm00183j |
| This journal is © The Royal Society of Chemistry 2020 |