 Open Access Article
Creative Commons Attribution 3.0 Unported Licence
Proving and interpreting the spontaneous formation of bulk nanobubbles in aqueous organic solvent solutions: effects of solvent type and content†
Ananda J.
Jadhav
and
Mostafa
Barigou
 *
*
School of Chemical Engineering, University of Birmingham, Edgbaston, Birmingham, B15 2TT, UK. E-mail: m.barigou@bham.ac.uk
First published on 15th April 2020
Abstract
We show that the mixing of organic solvents with pure water leads to the spontaneous formation of suspended nano-entities which exhibit long-term stability on the scale of months. A wide range of solvents representing different functional groups are studied: methanol, ethanol, propanol, acetone, DMSO and formamide. We use various physical and chemical analytical techniques to provide compounded evidence that the nano-entities observed in all these aqueous solvent solutions must be gas-filled nanobubbles as they cannot be attributed to solvent nanodroplets, impurities or contamination. The nanobubble suspensions are characterized in terms of their bubble size distribution, bubble number density and zeta potential. The bubble number density achieved is a function of the type of solvent. It increases sharply with solvent content, reaching a maximum at an intermediate solvent concentration, before falling off to zero. We show that, whilst bulk nanobubbles can exist in pure water, they cannot exist in pure organic solvents and they disappear at some organic solvent-water ratio depending on the type of solvent. The gas solubility of the solvent relative to water as well as the molecular structure of the solvent are determining factors in the formation and stability of bulk nanobubbles. These phenomena are discussed and interpreted in the light of the experimental results obtained.
1. Introduction
Bulk nanobubbles (BNBs) are an emerging field which is attracting much attention from researchers and industrial practitioners alike. Their existence has been reported in a number of recent experimental studies1–4 and strong indirect evidence has been provided to show that such nano-entities must be gas bubbles.5,6 Nonetheless, considerable speculation and controversy still exist about the existence and nature of BNBs, their origin and their extraordinary longevity which contradicts predictions of the diffusive gas transport based on the Epstein and Plesset theory.7 Those who dispute the existence of BNBs tend to attribute them to supramolecular structures, solvent or oil nanodroplets or simply impurities and contamination, based on either questionable experimentation or sheer speculation.8–15 A similar debate which lasted for many years took place after surface nanobubbles emerged and became the focus of attention about two decades ago.16 The present situation is exacerbated by the lack of a full rational explanation of the mechanism behind the long-term stability of BNBs.6,17–19 A number of speculative interpretations have been postulated but a complete physical model has yet to emerge.Despite such scepticism, however, many applications have been suggested for BNBs, including control of the nucleation mechanism in cavitation/boiling,20 facilitating oxygen supply to marine/aquatic life (plant and fish),21 detoxification of water,3,22 enhanced remediation of organic contaminants,23 drag reduction,24 prevention of surface fouling,25,26 enhanced ultrasound imaging of small cell lung cancer,27–29 oxygenation of hypoxic conditions for cardiac resuscitation,30 enhanced seed germination,31,32 and improved efficiency of IC engines.33,34 This nonexhaustive list highlights the wide and versatile interest in BNBs. BNBs offer significant advantages over microbubbles due to their persistence, negligible buoyancy and huge relative surface area. However, it is still not understood how they can be produced in an efficient, consistent and controlled fashion, especially in large volumes, and how they can be efficiently exploited in all the pertinent technologies.
Various techniques have been suggested for BNB production, including hydrodynamic and acoustic cavitation,6,18,35–38 fluidic oscillation,39 and nano-membrane filtration.40 These methods suffer from a number of drawbacks as they tend to be energy intensive; they are prone to contamination arising from detachment of nanoparticles from surfaces; they lack control of bubble size, uniformity and concentration; and have low resistance to corrosive chemicals, which restricts the use of reactive gases and solutions. The method of solvent exchange by which a local supersaturated environment is created, has been widely used in studies of surface nanobubbles,41–44 but has not been fully exploited in the formation and study of BNBs.
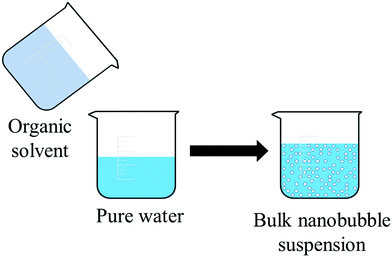
In this paper, we study the spontaneous formation of BNBs resulting from the mixing of pure water with an organic solvent. An extensive range representing different functional groups of aqueous organic solvents is investigated. We use a range of physical and chemical analytical techniques to show that the nano-entities formed must be gas-filled nanobubbles, as follows:
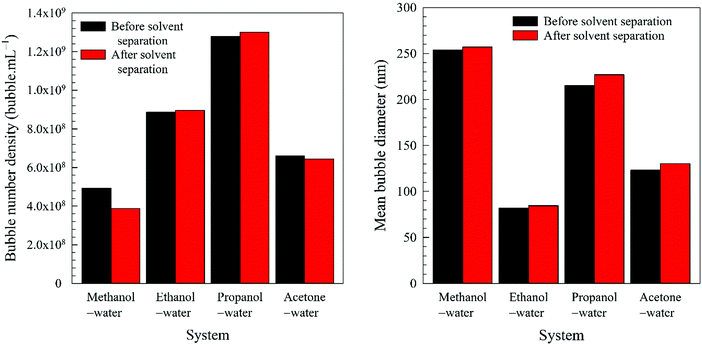
1. In the case of an organic solvent with a lower boiling point than water, we separate the solvent from the nanobubble suspension and analyse the nanobubble size distribution and bubble number density to confirm that they remain unaffected;
2. We use Fourier transform infrared spectroscopy (FT-IR) to analyse and compare the functional groups present in pure water and in nanobubble suspensions;
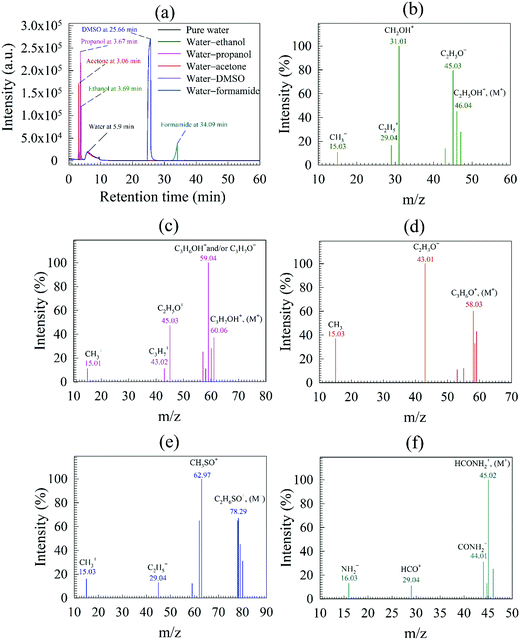
3. We analyse pure water and nanobubble suspensions using gas chromatography-mass spectroscopy (GC-MS) to examine for any organic contamination;
4. We analyse pure water and nanobubble suspensions using inductive coupled plasma mass spectroscopy (ICP-MS) to detect any inorganic contamination;
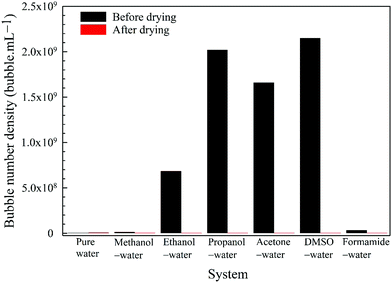
5. For each organic solvent considered, we completely evaporate the water and solvent from the nanobubble suspension and examine if there is any residue.
The BNB suspensions are visualized and the nanobubbles measured by a nanoparticle tracking analysis technique, and their surface charge is measured in terms of their zeta potential. We study the influence of the type of solvent and its mole fraction on the existence of BNBs and their bubble number density. We also monitor the long-term stability of the BNB suspensions over a period of over three months. In the light of the experimental results obtained, we address a number of fundamental questions relating to the existence and behaviour of BNBs in aqueous solvent solutions.
2. Experimental section
2.1 Materials
Ultrapure water (type-1), henceforth referred to as simply pure water, from a Millipore purification system (Avidity Science, UK), of electrical conductivity 0.055 μS cm−1 and pH 6.7 at a temperature of 20 °C, was used in all experiments. All solvents and reagents used were of the highest purity grade available on the market. All glassware was cleaned by immersion for 30 min in a 10% aqueous solution of potassium hydroxide (KOH, Sigma Aldrich, UK) placed inside an ultrasonic bath, followed by rinsing with ultrapure water, drying in a microwave oven and flushing with a stream of high-purity dry nitrogen gas. Analytical grade (99.9% pure) methanol, ethanol, 2-propanol, acetone, dimethyl sulfoxide (DMSO) and formamide were purchased from Fisher Scientific (UK) and were handled in glassware in order to avoid contamination from plastic products. Prior to experimentation, purified water and all stock solutions were initially examined for any nanoscale entities using the Nanosight instrument (described further below) employed for the measurement of BNBs, and no significant levels of impurity were observed.2.2 Methods
3. Results and discussion
We shall start by assuming that the entities formed in the aqueous solvent solutions are BNBs and make some general observations about their characteristics and behaviour. We will then present multiple pieces of evidence to show that the observed entities are indeed BNBs and not any of the common nano-scale impurities sometimes associated with BNBs. Subsequently, we shall address a number of fundamental questions relating to the existence of BNBs and their behaviour in aqueous solvent solutions.3.1 General observations
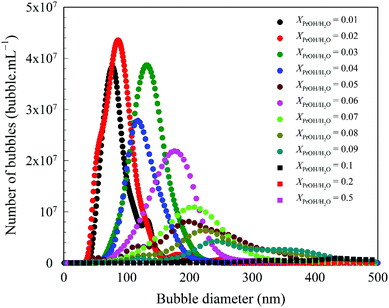
All the solvents studied exhibited qualitatively similar nanobubble size distributions. Typical nanobubble size distributions in propanol–water mixtures are presented in Fig. 2, showing a flattening of the peak, i.e. a reduction in Kurtosis going from leptokurtic to platykurtic distribution as the solvent fraction increases. The bubble number density is an important parameter to compare nanobubble populations formed in different solvent–water mixtures, as shown in Fig. 3. For example, the bubble number density rises sharply to a maximum value of ∼2.65 × 10⁹ bubble mL−1 as the propanol mole fraction increases to ∼0.03 and falls off sharply at higher propanol fractions, reaching zero bubble mL−1 at ∼0.2 mole fraction of propanol. Other organic solvents exhibit a similar trend, with a maximum number of nanobubbles formed at a mole fraction of ∼0.2 for methanol, ∼0.06 for ethanol, ∼0.05 for acetone, ∼0.1 for DMSO and ∼0.05 for formamide, falling off to zero thereafter, as depicted in Fig. 3.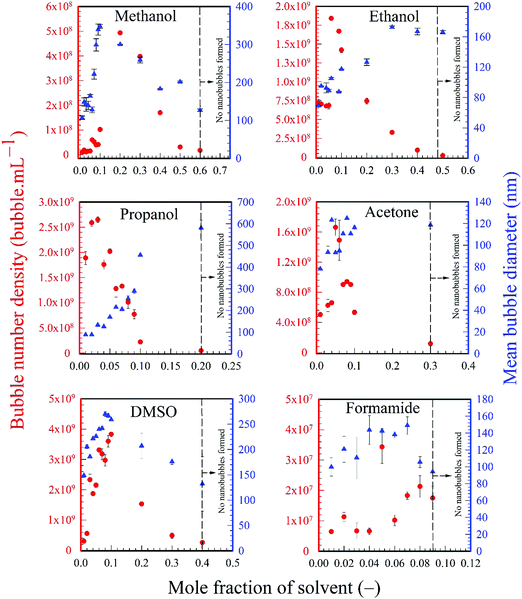 | ||
| Fig. 3 Variation of bubble number density and mean bubble size as a function of solvent mole fraction. | ||
The variations of the number mean bubble diameter are also presented in Fig. 3. The mean bubble diameter generally increases with solvent mole fraction up to the point where the maximum bubble number density is reached. Beyond that point, different solvents exhibit different trends which cannot be easily explained without a more detailed study.
3.2 Evidence of existence of BNBs in aqueous organic solvent solutions
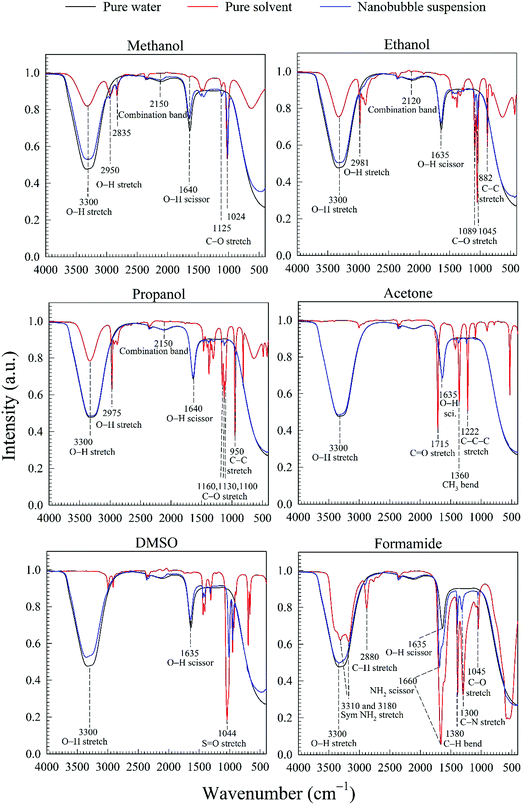
The water–solvent BNB suspensions exhibit extra peaks, as shown in Fig. 5. The three alcohols display three extra peaks representing in order from left to right, the O–H stretching mode, the C–O stretching mode and the C–C stretching mode, which together indicate in each case the presence of either methanol, ethanol or propanol. Similarly, acetone exhibits three characteristic peaks representing in turn, the C![[double bond, length as m-dash]](https://www.rsc.org/images/entities/char_e001.gif) O stretching mode, the CH3 bending mode and the C–C–C stretching mode, which together indicate the presence of acetone. DMSO, on the other hand, presents a characteristic peak representing the S
O stretching mode, the CH3 bending mode and the C–C–C stretching mode, which together indicate the presence of acetone. DMSO, on the other hand, presents a characteristic peak representing the S![[double bond, length as m-dash]](https://www.rsc.org/images/entities/char_e001.gif) O stretching mode which indicates the presence of DMSO. Finally, formamide presents six characteristic peaks representing, respectively, the symmetric NH2 stretching mode, the C–H stretching mode, the NH2 scissoring mode, the C–H bending mode, C–N stretching mode and the C–O stretching mode, which together indicate the presence of formamide.
O stretching mode which indicates the presence of DMSO. Finally, formamide presents six characteristic peaks representing, respectively, the symmetric NH2 stretching mode, the C–H stretching mode, the NH2 scissoring mode, the C–H bending mode, C–N stretching mode and the C–O stretching mode, which together indicate the presence of formamide.
To confirm that these extra peaks do not mask the presence of other chemical compounds of similar functional groups, we conducted the same FT-IR analysis on the collected water after complete separation of the solvents in the rotary evaporator, using the procedure described above. All of the extra peaks disappeared, and the corresponding FT-IR spectrum coincided with that of pure water. In conclusion, therefore, the nano-entities observed in the different water–solvent solutions cannot be attributed to any type of FT-IR detectable contamination.
In conclusion, the various physical and chemical analytical techniques used above have produced multiple evidence which, taken together, provides conclusive proof that the nano-entities spontaneously formed by water–solvent mixing cannot be attributed to solvent nanodroplets or any type of common impurities or contamination as speculated in some literature reports8–15 and, therefore, must be indeed gas-filled BNBs.
3.3 Fundamental questions relating to the existence and behaviour of BNBs in aqueous solvent solutions
On the basis of the findings of this study, the formation of BNBs in water–solvent mixtures raises a number of key questions which we will address, as follows. | (1) |
 | (2) |
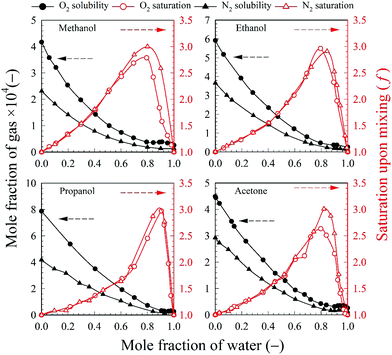
The relevant O2 and N2 solubility data for methanol, ethanol, propanol and acetone are plotted in Fig. 8 together with the calculated f values. The O2 solubility in methanol, ethanol propanol and acetone is, respectively, 16, 22, 30, and 17 times higher than in pure water; whereas the N2 solubility is, respectively, 17, 27, 31, and 21 times higher than in pure water. However, as shown in Fig. 8, even though O2 and N2 are more soluble in pure solvent than in pure water, the maximum gas (O2 and N2) saturation level that can be achieved upon mixing corresponds to a high water mole fraction approximately in the range 0.80–0.90 depending on the type of solvent. Thus, the amount of gas contributed from the organic solvent phase is small and, at high solvent fractions, O2 and N2 have a much higher solubility in the aqueous mixture than in pure water. It is noteworthy that for each one of the volatile solvents considered, the water mole fraction yielding the highest level of gas saturation corresponds, within experimental error, to the solvent mole fraction at which the maximum bubble number density is observed (Fig. 3). This result seems to explain why the bubble number density is maximum at a certain mole fraction of solvent and falls off thereafter to zero as the solution becomes richer in solvent.
To illustrate these differences, the values of the maximum number density of BNBs formed in the aqueous solutions of these volatile solvents are compared in Fig. 9. Graphs of O2 and N2 solubility in the pure solvents are also plotted alongside these data. The bubble number density is highest for aqueous propanol followed successively order by aqueous ethanol, acetone and methanol. These results are consistent with the trends of variation of O2 and N2 solubility, i.e. propanol having relatively the highest gas solubility and methanol the lowest at any mole fraction.56–58 A higher gas solubility in an organic solvent relative to water implies a higher gas availability for the nucleation of BNBs via gas oversaturation and, thus, a higher bubble number density at a lower mole fraction, i.e. 0.03 for propanol, 0.06 for ethanol, 0.05 for acetone and 0.2 for methanol (Fig. 3).
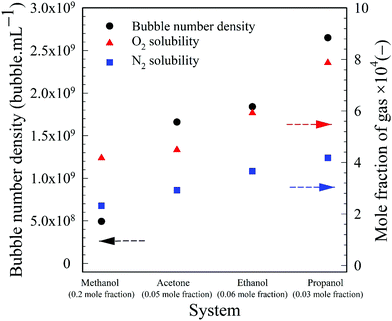 | ||
| Fig. 9 Maximum bubble number density in aqueous volatile organic solvent solutions, plus O2 and N2 solubility values in the same pure solvents. | ||
The low number of BNBs in methanol can be explained by its low gas solubility relative to water, and this argument can also be used to explain the extremely low number of BNBs in the case of formamide (Fig. 3). Formamide has the same oxygen solubility as pure water (∼1.3 mM;56 data for N2 are not available) which means that the gas oversaturation is extremely low and, hence, the lack of gas release to form BNBs in the mixture.
In the case of DMSO the O2 solubility is 0.33 mM, an order of magnitude lower than in water.56 Nonetheless, there is considerable gas oversaturation in the mixture (albeit less than in the case of methanol, ethanol, propanol and acetone) which acts as the driving force behind the generation of BNBs. The solubility relative to water, therefore, is clearly one of the determining factors behind the nucleation of BNBs, but on its own does not fully explain why DMSO produces the highest BNB concentration amongst all the solvents considered here (Fig. 3). Consequently, the chemical structure of DMSO must also play an important direct or indirect role in stabilising the BNBs formed and, hence, influencing their number density. In the case of methanol, ethanol, propanol and acetone, the molecules of these solvents adsorb on the nanobubble interfaces and provide stability to the BNBs.5,18 In the case of DMSO, it seems that the chemical structure of this solvent plays an even more important role in stabilising BNBs which seems to more than compensate for its comparatively low relative gas solubility. The exact mechanism by which this stabilising effect takes place in the case of DMSO is not a priori clear, however, and necessitates further study which is beyond the scope of this paper.
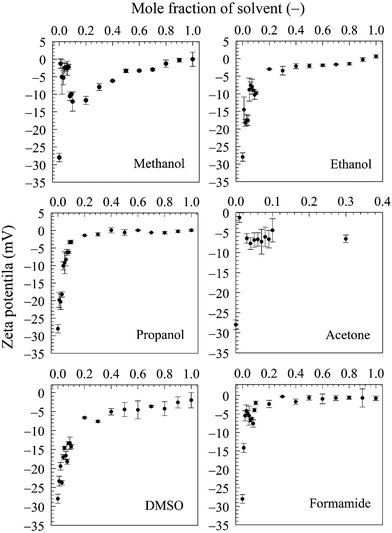
The stability of BNBs in pure water is attributed to the presence of a significant charge afforded by the adsorption of hydroxyl ions on the interface. Although hydroxyl ions are present in water because of self-ionization, this is not the case in pure organic solvents which do not autoionize and, therefore, BNBs cannot exist in concentrated aqueous organic solvent solutions. Because of preferential adsorption of organic solvent molecules at the nanobubble interfaces, the surface charge of the nanobubbles decreases with solvent content, but the strong hydrogen bonding near their interfaces ensures their stability.18 The observed reduction in zeta potential can, therefore, be explained by the increased adsorption of solvent molecules on the nanobubble interfaces.
Further evidence comes from the solvent evaporation experiment discussed above. After complete separation of the volatile solvents (methanol, ethanol, propanol, acetone) in the rotary evaporator, the zeta potential of BNBs in the remaining solvent-free water rose to about −26.5 mV which is approximately the same as for nanobubbles produced in pure water (−28.0 mV). This result confirms that the molecules of these solvents do adsorb on the nanobubble interfaces and provide long-term stability to the BNBs.5,18 For the solvents which produced stable nanobubbles, we monitored the BNB suspensions with the maximum bubble number density in 20 mL air-tight glass vials at room temperature. After a period of three months, the bubble number density and the bubble size distribution were unchanged within experimental error (± 1 to 5% depending on the solvent and its concentration).
4. Conclusions
The spontaneous formation of BNB suspensions and their stability in various aqueous organic solvent solutions have been studied. Multiple evidence has been provided which shows that the nano-entities formed by water–solvent mixing cannot be attributed to solvent nanodroplets, impurities or contamination and must therefore be gas-filled. Such BNBs enjoy long-term stability on the scale of months. The bubble number density increases sharply with solvent content, reaching a maximum at an intermediate solvent concentration depending on the type of solvent. This behaviour is attributed to gas oversaturation of water which is expected to be maximum at such mole fractions of solvent. Beyond this maximum, the bubble number density falls off sharply with no nanobubbles forming when the solvent content exceeds a certain mole fraction depending on the type of solvent. A pure organic solvent acts as a gas sink removing any excess gas from the solution and thus does not form nanobubbles. In an aqueous solvent solution, the gas solubility of the solvent relative to water is a determining factor in the number of BNBs formed. A solvent such as formamide with a gas solubility similar to that of water, i.e. approximately zero relative gas solubility, produces a negligible amount of BNBs. The stabilising effect afforded directly or indirectly to BNBs by the molecular structure of the solvent is another crucial factor in their formation and persistence. For solvents with a similar molecular structure (methanol, ethanol, propanol, acetone), a higher relative gas solubility leads to a maximum bubble number density at lower mole fractions. A solvent such as DMSO, whilst having a comparatively low relative gas solubility, produces considerably more BNBs.Conflicts of interest
There are no conflicts of interest to declare.Acknowledgements
This work was supported by EPSRC Grant EP/L025108/1.References
- J. Zhu, H. An, M. Alheshibri, L. Liu, P. M. J. Terpstra, G. Liu and V. S. J. Craig, Langmuir, 2016, 32, 11203–11211 CrossRef CAS PubMed.
- K. Ohgaki, N. Q. Khanh, Y. Joden, A. Tsuji and T. Nakagawa, Chem. Eng. Sci., 2010, 65, 1296–1300 CrossRef CAS.
- A. Agarwal, W. J. Ng and Y. Liu, Chemosphere, 2011, 84, 1175–1180 CrossRef CAS PubMed.
- S. H. Oh and J.-M. Kim, Langmuir, 2017, 33, 3818–3823 CrossRef CAS PubMed.
- A. J. Jadhav and M. Barigou, Langmuir, 2020, 36, 1699–1708 CrossRef CAS PubMed.
- N. Nirmalkar, A. W. Pacek and M. Barigou, Langmuir, 2018, 34, 10964–10973 CrossRef CAS PubMed.
- P. B. August 2012, Big troubles over tiny bubbles, https://www.chemistryworld.com/features/big-troubles-over-tiny-bubbles/5306.article, accessed December 13, 2019.
- F. Jin, J. Ye, L. Hong, H. Lam and C. Wu, J. Phys. Chem. B, 2007, 111, 2255–2261 CrossRef CAS PubMed.
- M. Sedlák and D. Rak, J. Phys. Chem. B, 2013, 117, 2495–2504 CrossRef PubMed.
- M. Alheshibri and V. S. J. Craig, J. Phys. Chem. C, 2018, 122, 21998–22007 CrossRef CAS.
- M. Alheshibri and V. S. J. Craig, J. Colloid Interface Sci., 2019, 542, 136–143 CrossRef CAS PubMed.
- M. Alheshibri, M. Jehannin, V. A. Coleman and V. S. J. Craig, J. Colloid Interface Sci., 2019, 554, 388–395 CrossRef CAS PubMed.
- A. Häbich, W. Ducker, D. E. Dunstan and X. Zhang, J. Phys. Chem. B, 2010, 114, 6962–6967 CrossRef PubMed.
- V. Leroy and T. Norisuye, ChemPhysChem, 2016, 17, 2787–2790 CrossRef CAS PubMed.
- D. Rak, M. Ovadová and M. Sedlák, J. Phys. Chem. Lett., 2019, 10, 4215–4221 CrossRef CAS PubMed.
- P. E. Theodorakis and Z. Che, Adv. Colloid Interface Sci., 2019, 272, 101995 CrossRef CAS PubMed.
- N. Nirmalkar, A. W. Pacek and M. Barigou, Soft Matter, 2018, 14, 9643–9656 RSC.
- N. Nirmalkar, A. W. Pacek and M. Barigou, Langmuir, 2019, 35, 2188–2195 CrossRef CAS PubMed.
- J. N. Meegoda, S. Aluthgun Hewage and J. H. Batagoda, Environ. Eng. Sci., 2018, 35, 1216–1227 CrossRef CAS.
- K. A. Mørch, Interface Focus, 2015, 5, 20150006 CrossRef PubMed.
- K. Ebina, K. Shi, M. Hirao, J. Hashimoto, Y. Kawato, S. Kaneshiro, T. Morimoto, K. Koizumi and H. Yoshikawa, PLoS One, 2013, 8, e65339 CrossRef CAS PubMed.
- T. Temesgen, T. T. Bui, M. Han, T. Kim and H. Park, Adv. Colloid Interface Sci., 2017, 246, 40–51 CrossRef CAS PubMed.
- L. Hu and Z. Xia, J. Hazard. Mater., 2018, 342, 446–453 CrossRef CAS PubMed.
- A. Ushida, T. Hasegawa, T. Nakajima, H. Uchiyama and T. Narumi, Exp. Therm. Fluid Sci., 2012, 39, 54–59 CrossRef CAS.
- Z. Wu, X. Zhang, X. Zhang, G. Li, J. Sun, Y. Zhang, M. Li and J. Hu, Surf. Interface Anal., 2006, 38, 990–995 CrossRef CAS.
- Z. Wu, X. Zhang, X. Zhang, J. Sun, Y. Dong and J. Hu, Chin. Sci. Bull., 2007, 52, 1913–1919 CrossRef CAS.
- W. B. Cai, H. L. Yang, J. Zhang, J. K. Yin, Y. L. Yang, L. J. Yuan, L. Zhang and Y. Y. Duan, Sci. Rep., 2015, 5, 13725 CrossRef PubMed.
- J. Du, X.-Y. Li, H. Hu, L. Xu, S.-P. Yang and F.-H. Li, Sci. Rep., 2018, 8, 3887 CrossRef PubMed.
- J.-P. Wang, X.-L. Zhou, J.-P. Yan, R.-Q. Zheng and W. Wang, Oncotarget, 2017, 8, 78153–78162 Search PubMed.
- N. Matsuki, T. Ishikawa, S. Ichiba, N. Shiba, Y. Ujike and T. Yamaguchi, Int. J. Nanomed., 2014, 9, 4495–4505 CrossRef PubMed.
- S. Liu, S. Oshita, Y. Makino, Q. Wang, Y. Kawagoe and T. Uchida, ACS Sustainable Chem. Eng., 2016, 4, 1347–1353 CrossRef CAS.
- S. Liu, Y. Kawagoe, Y. Makino and S. Oshita, Chem. Eng. Sci., 2013, 93, 250–256 CrossRef CAS.
- S. H. Oh, J. G. Han and J.-M. Kim, Fuel, 2015, 158, 399–404 CrossRef CAS.
- S. H. Oh, S. H. Yoon, H. Song, J. G. Han and J.-M. Kim, Int. J. Hydrogen Energy, 2013, 38, 14849–14853 CrossRef CAS.
- F. Y. Ushikubo, T. Furukawa, R. Nakagawa, M. Enari, Y. Makino, Y. Kawagoe, T. Shiina and S. Oshita, Colloids Surf., A, 2010, 361, 31–37 CrossRef CAS.
- R. Etchepare, H. Oliveira, M. Nicknig, A. Azevedo and J. Rubio, Miner. Eng., 2017, 112, 19–26 CrossRef CAS.
- S.-H. Cho, J.-Y. Kim, J.-H. Chun and J.-D. Kim, Colloids Surf., A, 2005, 269, 28–34 CrossRef CAS.
- J.-Y. Kim, M.-G. Song and J.-D. Kim, J. Colloid Interface Sci., 2000, 223, 285–291 CrossRef CAS PubMed.
- W. B. Zimmerman, V. Tesař and H. C. H. Bandulasena, Curr. Opin. Colloid Interface Sci., 2011, 16, 350–356 CrossRef CAS.
- A. K. A. Ahmed, C. Sun, L. Hua, Z. Zhang, Y. Zhang, W. Zhang and T. Marhaba, Chemosphere, 2018, 203, 327–335 CrossRef PubMed.
- S.-T. Lou, Z.-Q. Ouyang, Y. Zhang, X.-J. Li, J. Hu, M.-Q. Li and F.-J. Yang, J. Vac. Sci. Technol., B: Microelectron. Nanometer Struct. – Process., Meas., Phenom., 2000, 18, 2573–2575 CrossRef CAS.
- S. Yang and A. Duisterwinkel, Langmuir, 2011, 27, 11430–11435 CrossRef CAS PubMed.
- S. Peng, T. L. Mega and X. Zhang, Langmuir, 2016, 32, 11265–11272 CrossRef CAS PubMed.
- S. R. German, X. Wu, H. An, V. S. J. Craig, T. L. Mega and X. Zhang, ACS Nano, 2014, 8, 6193–6201 CrossRef CAS PubMed.
- W. Drost-Hansen, Science, 1969, 166, 861 CrossRef.
- B. Louise Mojet, S. Dalgaard Ebbesen and L. Lefferts, Chem. Soc. Rev., 2010, 39, 4643–4655 RSC.
- M. Mekala and V. R. Goli, Data in Brief, 2018, 18, 947–960 CrossRef PubMed.
- K. Yasuda, H. Matsushima and Y. Asakura, Chem. Eng. Sci., 2019, 195, 455–461 CrossRef CAS.
- Q. Wang, H. Zhao, N. Qi, Y. Qin, X. Zhang and Y. Li, Sci. Rep., 2019, 9, 1–9 CrossRef PubMed.
- J. Jin, Z. Feng, F. Yang and N. Gu, Langmuir, 2019, 35, 4238–4245 CrossRef CAS PubMed.
- R. Battino, T. R. Rettich and T. Tominaga, J. Phys. Chem. Ref. Data, 1984, 13, 563–600 CrossRef CAS.
- R. Battino, T. R. Rettich and T. Tominaga, J. Phys. Chem. Ref. Data, 2009, 12, 163 CrossRef.
- K. Tsuji, K. Ichikawa, H. Yamamoto and J. Tokunaga, Kagaku Kogaku Ronbunshu, 1987, 13, 825–830 CrossRef CAS.
- P. S. Epstein and M. S. Plesset, J. Chem. Phys., 1950, 18, 1505–1509 CrossRef CAS.
- H. Liu and G. Cao, Sci. Rep., 2016, 6, 23936 CrossRef CAS PubMed.
- C. Franco and J. Olmsted, Talanta, 1990, 37, 905–909 CrossRef CAS PubMed.
- D. Dvoranová, Z. Barbieriková and V. Brezová, Molecules, 2014, 19, 17279–17304 CrossRef PubMed.
- M. Quaranta, M. Murkovic and I. Klimant, Analyst, 2013, 138, 6243–6245 RSC.
Footnote |
| † Electronic supplementary information (ESI) available. See DOI: 10.1039/d0sm00111b |
| This journal is © The Royal Society of Chemistry 2020 |

