 Open Access Article
Creative Commons Attribution 3.0 Unported Licence
Topological defects of dipole patchy particles on a spherical surface
Uyen Tu
Lieu
 *a and
Natsuhiko
Yoshinaga
 ab
ab
aMathematics for Advanced Materials-OIL, AIST, 2-1-1 Katahira, Aoba, 980-8577 Sendai, Japan. E-mail: uyen.lieu@aist.go.jp
bWPI-Advanced Institute for Materials Research (WPI-AIMR), Tohoku University, 2-1-1 Katahira, Aoba, 980-8577 Sendai, Japan. E-mail: yoshinaga@tohoku.ac.jp
First published on 17th August 2020
Abstract
We investigate the assembly of dipole-like patchy particles confined to a spherical surface by Brownian dynamics simulations. The surface property of the spherical particle is described by the spherical harmonic Y10, and the orientation of the particle is defined as the uniaxial axis. On a flat space, we observe a defect-free square lattice with nematic order. On a spherical surface, defects appear due to the topological constraint. As for the director field, four defects of winding number +1/2 are observed, satisfying the Euler characteristic. We have found many configurations of the four defects lying near a great circle. Regarding the positional order for the square lattice, eight grain boundary scars proliferate linearly with the sphere size. The positions and orientations of the eight grain boundary scars are strongly related to the four +1/2 defect cores.
1 Introduction
Patchy particles are particles of colloidal size and have patches acting as specific interactive sites on the particles. Due to the anisotropic interaction, patchy particles are capable of assembling into complex structures whose properties are fundamentally different from “conventional” materials.1 Recent developments in synthesis techniques2–4 have made feasible the fabrication of patchy particles of high degrees of freedom2,5–9 and research has focused on the self-assembly of patchy particles. Practical applications of the particle assembly require knowledge of the principal design of the particle for a specific structure and vice versa, and how to produce high yield target structures. Understanding the principles of controlling defects is important for these tasks. Defects are imperfections and singularities in an ordered structure. From a microscopic point of view, defects can serve as interacting sites for chemical linkers to promote the formation of large scale structures.10,11 On the macroscopic length-scale, defects are inevitable during crystallisation and affect the overall properties. In particular, using curvature is one method to study defects because the defects are topologically protected, meaning that they cannot disappear upon continuous deformation of the order parameter. We focus on the spherical surface due to its substantial applicability, such as in crystalline membranes, the design of crystalline materials, and the fabrication of patchy colloids.The in-plane order of a two-dimensional crystal on a curved surface is a much more complicated problem than that on a flat space because the geometrical and topological constraints have to be taken into account. The ground state of isotropic particles on a two-dimensional plane is a defect-free triangular lattice containing 6-fold coordinated particles. On a spherical surface, such a translational symmetry is broken, and at least twelve 5-fold coordinated particles are required to compensate the topology of the sphere. This is similar to the truncated icosahedron pattern of a soccer ball whose twelve pentagons are icosahedrally arranged among the hexagons.12,13 Aside from affecting the positional order of the particle system, the curved surface also influences the orientational order. For example, rod-like particles confined to a spherical surface form four +1/2 or two +1 defects10,14–17 instead of a defect-free nematic phase (long-range orientational but no long-range positional order on a flat space).
Patchy particles have both positional and orientational order, which has been studied only separately. For each separate case, although the appearance of the topological defects is generally accepted as a consequence of the embedded geometry and topology, many issues are still recent subjects of study: the underlying mechanism for the formation of defects12,18 and the dependence on the system size,13 the influence of the particle–particle and particle–curvature interaction on the defect. When the interplay between positional and orientational order may appear, our understanding of defects of these two orders remains primitive. In order to address the above problems, we consider the most simple form of anisotropic particle exhibiting both positional and orientational order, that is, a spherical particle with dipole-like patches that behaves somewhat similarly to a magnetic bead. We dynamically simulate and compare the assembly of such patchy particles confined to a planar geometry and a spherical surface.
1.1 Topological defects on a curved surface
It is useful to discuss the basics and the relevant studies on the topological defects of ordered structures embedded in curved surfaces. Suppose a closed surface is facetted and divided into a number of V vertices, E edges, and F faces, Euler theorem states that V − E + F = χ, where the Euler characteristic χ = 2(1 − g), and g is the genus of the closed surface. For instance, V − E + F = 2 is applied to all polyhedra because they are topologically equal to a sphere with χ = 2.19 If we restrict every face to having c vertices, and let Nz be the number of vertices that have z connections with the others, then the Euler theorem can be written as (see Appendix A.1) | (1) |
Consider point particles on a surface triangularly facetted (c = 3) by the points, it is well known that on a flat space, the isotropic particles, most of the time, form a triangular lattice resulting in a 6-fold symmetry with z = 6. A disclination in this case refers to a vertex whose z deviates from six and the charge of the disclination is defined as 6 − z.20 When such a particle system is confined to a spherical surface, it is straightforward from eqn (1) that a net charge of  is required. For sphere size below a critical value, the twelve 5-fold coordinated particles are icosahedrally located among the otherwise 6-fold ones due to the repulsion of the like-sign charge.20 As the sphere size increases, the 5-fold disclinations are screened by additional dislocations, which are pairs of 5- and 7-fold coordinated particles;21 note that the pairs may consist of 4- or 8-fold coordinated particles as long as the sum of charge is neutral. The interaction between the clouds of dislocations eventually leads to the formation of twelve grain boundary scars where each scar consists of pairs of 5- and 7-fold coordinated particles with a net charge of +1. The grain boundary scars in spherical crystals are observed in both experiments and simulations.12,13,22,23 Due to the formation of the defect scars, the interaction between the disclinations is believed to be screened and less important. The arrangement of these twelve defect scars is unusual, complex and not fully understood, especially in the large sphere limit.21 On the ellipsoidal or toroidal surface, the positions of the grain boundary scars are dependent on the local Gaussian curvature of the surface.24 For a square lattice on the sphere, evidence of how disclinations distribute is still lacking. However, it can be conjectured that by employing a quadrilateral mesh (c = 4) for a square lattice, a disclination is now the vertex whose connection differs from four. Eqn (1) becomes
  , meaning that at least eight disclinations of z = 3 are required for a square lattice on a sphere. The development of dislocations that are now viewed as bound disclination pairs of 3- and 5-fold coordinated particles25 is expected to occur as the system size increases.
The in-plane orientation on a two-dimensional surface is described by a unit vector field tangent to the surface. In general, p-atic vectors are invariant under rotations of 2nπ/p (n is integer) about the surface normal.14 The strength of a defect in this case is characterised by the winding number k, defined as the amount of rotation of the vector field around a counter-clockwise circuit enclosing the defect core on the order parameter space, k = Δθ/(2π/p), where Δθ is the angle of the vector that rotates in one counter-clockwise circuit.26 On a closed surface, the net strength is equal to the Euler characteristic according to the Poincaré–Hopf theorem.27 For instance, the in-plane order structure of a vector field (p = 1) on a sphere requires at least two +1 defects at the two opposite poles; nematics (p = 2) have either four +1/2 or two +1 defects. The detailed configuration of spherical p-atic order depends on the interaction energy of the system. According to the Frank free energy approach for spherical nematics, in the one elastic constant limit, i.e., splay constant equals bending constant, the ground state exposes four +1/2 defects at the vertices of a tetrahedron inscribed in the sphere.10,14,28 In contrast, in the extreme limit when splay is much softer (or harder) than bending, some Monte Carlo simulation studies suggest that a +1 defect can split into two +1/2 defects without costing energy. As a result, an infinite number of states of four +1/2 defects lying near a great circle can be obtained by the cut-and-rotate surgery of the sphere with two +1 defects.16,17 Such behaviours are also confirmed via the Onsager approach minimising the mean-field free energy of hard rods on a sphere.29–31 It has also been found that the defects of nematic order on a curved surface accumulate at a larger Gaussian curvature.32,33 Another relevant case is spherical tetratics (p = 4), where the particles are square-shaped or cross-shaped. The low energy states consist of eight +1/4 defects that may position on the vertices of an anti-cube14,34 or a cube.35,36 Such a difference is perhaps caused by the different types of interaction for simulation and the forms of free energy for the continuum description. It is worth noting that the p-atic particles in these mentioned systems have a purely rotational degree of freedom, hence the existence of positional order remains unclear.
2 Methods
2.1 Brownian dynamics
We employ the Brownian dynamics simulation algorithm for particles in Euclidean space in the overdamped limit.37,38 The model is successfully applied for particles confined to a flat space. The translational and rotational motions of the particles confined to a spherical surface are given as follows | (2a) |
 | (2b) |
 and
and  , where each component of δGi is independently chosen from a Gaussian distribution with zero mean and unit variance. Force F and torque T are derived from the pairwise potential. In order to capture the dynamics of particle position on the tangent plane, we apply the algorithm in ref. 39, in which the tangential parts of the interacting force F and noise δr in eqn (2a) at the point where a particle is located are considered; finally harmonic terms FH = κ(r − R)r/r are added to enforce the confinement after the translation of each time step.
The patchy particle possesses a patterned surface related to its physical or chemical properties, which induces the anisotropic interaction of the particles. Such a pattern can be systematically described by means of spherical harmonics Ylm. In this study, the dipole-like pattern of a unit particle of radius a = 1 is given as  , where
 ![[p with combining circumflex]](https://www.rsc.org/images/entities/b_i_char_0070_0302.gif) is defined as the orientation of the particle (Fig. 1). This pattern has positive and negative hemispheres similar to the Janus particle.8,40,41 The interaction potential for a pair of particles i and j comprises an isotropic Week–Chandler–Anderson potential VWCA preventing the overlapping of the particle, and an orientation-dependent Morse potential VM:
is defined as the orientation of the particle (Fig. 1). This pattern has positive and negative hemispheres similar to the Janus particle.8,40,41 The interaction potential for a pair of particles i and j comprises an isotropic Week–Chandler–Anderson potential VWCA preventing the overlapping of the particle, and an orientation-dependent Morse potential VM:
V = VWCA(r) − Ξ(![[p with combining circumflex]](https://www.rsc.org/images/entities/b_i_char_0070_0302.gif) i, i,![[p with combining circumflex]](https://www.rsc.org/images/entities/b_i_char_0070_0302.gif) j, j,![[r with combining circumflex]](https://www.rsc.org/images/entities/b_i_char_0072_0302.gif) )VM(r) )VM(r) | (3) |
![[r with combining circumflex]](https://www.rsc.org/images/entities/b_i_char_0072_0302.gif) = rij/r, the unit vectors
= rij/r, the unit vectors ![[p with combining circumflex]](https://www.rsc.org/images/entities/b_i_char_0070_0302.gif) i,
i, ![[p with combining circumflex]](https://www.rsc.org/images/entities/b_i_char_0070_0302.gif) j are the directors of particles i and j, respectively, and
j are the directors of particles i and j, respectively, and | (4) |
 | (5) |
![[p with combining circumflex]](https://www.rsc.org/images/entities/b_i_char_0070_0302.gif) i,
i,![[p with combining circumflex]](https://www.rsc.org/images/entities/b_i_char_0070_0302.gif) j,
j,![[r with combining circumflex]](https://www.rsc.org/images/entities/b_i_char_0072_0302.gif) ) depends only on the mutual orientation of the particles and is given as
) depends only on the mutual orientation of the particles and is given as | (6) |
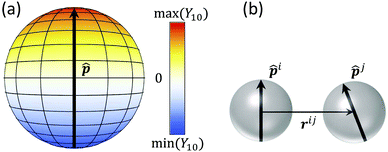 | ||
| Fig. 1 Illustration of (a) the patterned surface of the Y10 particle and (b) a pair of particles characterised by their orientations and relative positions. | ||
The simulation is conducted in the dimensionless form, where the characteristic length, energy, and time are denoted as a, ε, and a2/DT, respectively. The time step is taken so that under the condition of one unit of force and kBT/ε = 0.1, the particle on average moves 10−3a in one step. The packing fraction ρ is defined as the ratio of the volume of particles to that of the space confining them, which is L × L × 2a for the planar geometry and 4/3π[(R + a)3 − (R − a)3] for the sphere of radius R. The periodic boundary condition in the L direction is applied for the planar geometry case. The initial positions and orientations of the particles are randomly distributed. The temperature kBT/ε decreases from 0.5 to 0.05 by intervals of 0.01, and 0.5 × 10⁶ simulation steps are performed for each value of kBT/ε. In this article, we show the structures at the last time step. Verification of the simulation on repulsive isotropic particles is performed by setting the anisotropic function fixed as Ξ = 1.
Last but not least, the particles possibly fluctuate between certain thicknesses of the spherical layer. This effect, however, is negligible, thanks to the small enough time step and suitable harmonic potential, which is comparable to the particle–particle interaction. The systems in the study contain many interacting particles, and there is a possibility that metastable states are obtained instead of true ground states. We report a statistical result including all possible states.
2.2 Structure analysis
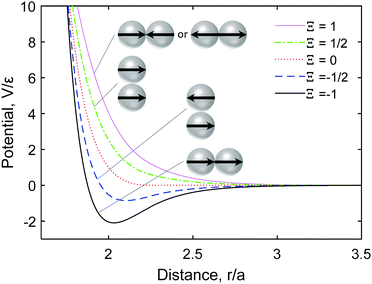
The coordination number Ni of particle i is estimated by combining the conventional Delaunay triangulation whose vertices are the particle positions,13 and a distance constraint. The particles further away than a certain value are not considered as neighbours due to the relatively short-range interaction (Fig. 2). Such a distance constraint is based on the first trough of the pairwise distance distribution, which is approximately 2.5a. Then, the local positional order of particle i is calculated by the two-dimensional bond-orientational order parameter ψn:13,20 | (7) |
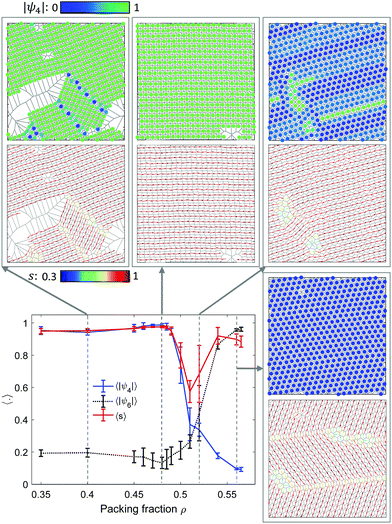
Since the head to tail alignment is the most stable configuration (Fig. 2), string-like structures with alternating orientation at their sides are expected to form (see also Fig. 4). Therefore, we evaluate the orientational order of the particles via the nematic order where the head and tail of the vector are treated similarly. The local order parameter tensor Qi is calculated by averaging the orientation ![[p with combining circumflex]](https://www.rsc.org/images/entities/b_i_char_0070_0302.gif) of particle i and its coordinated particle Ni:
of particle i and its coordinated particle Ni:
 | (8) |
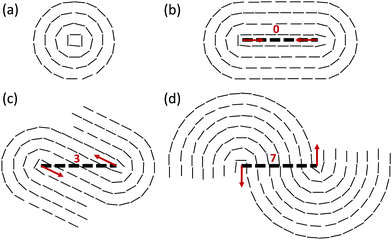
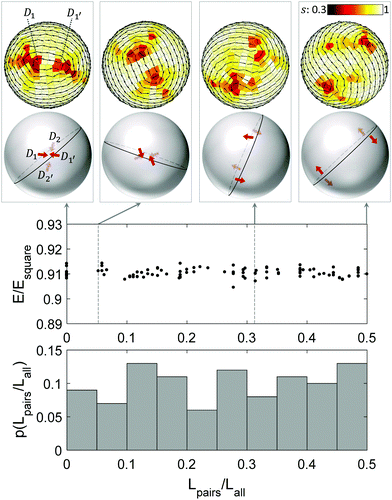
The nematic order parameter s is then three halves the positive eigenvalue of Qi. The position of the topological defect of the director field is approximated via data of the local nematic order parameter and winding number. The orientation of a defect is simply obtained by averaging the nematic orientation in the defect core region. In particular, for the comet-like +1/2 defect, the defect orientation is defined from the head to the tail of the comet. Fig. 3 displays some configurations of a pair of +1/2 defects whose orientation is almost anti-parallel. Regarding the distance between the defects, aside from the ordinary Euclidean distance, we implement another parameter taking into account the orientation of the defects. As shown in Fig. 3, we may follow the line by connecting the orientation of the particles. Each line forms a layer. The number of layers L between a pair of +1/2 defects intrinsically includes the information of the relative position and orientation of a pair of defects, estimated by L = [d![[thin space (1/6-em)]](https://www.rsc.org/images/entities/char_2009.gif) sin
sin![[thin space (1/6-em)]](https://www.rsc.org/images/entities/char_2009.gif) α/h], where d is the distance between the defect cores, α is the angle between the defect direction and the distance vector of the defect cores, and h is the thickness of the two consecutive layers. It is shown in Fig. 3 that the number of layers between a pair of +1/2 defects varies although the Euclidean distance is fixed.
α/h], where d is the distance between the defect cores, α is the angle between the defect direction and the distance vector of the defect cores, and h is the thickness of the two consecutive layers. It is shown in Fig. 3 that the number of layers between a pair of +1/2 defects varies although the Euclidean distance is fixed.
3 Results
3.1 Particles confined to planar geometry
The assembly of the dipole patchy particles on a flat space is investigated. Fig. 4 shows the average properties over all particles in terms of the bond-orientational order parameter 〈|ψn|〉 and the nematic order parameter 〈s〉, and typical snapshots at various packing fraction ρ from 0.35 to 0.565. The highly ordered, almost defect-free structures exhibited via the square lattice (〈|ψ4|〉 ≈ 1) and well aligned orientation (〈s〉 ≈ 1) are more frequently obtained at the packing fraction comparable to ρ ≈ 0.48. In these cases, the particle orientations are head to tail, whereas the side by side ones are anti-parallel. At ρ < 0.48, grain boundaries emerge because an excess of voids induces more degrees of freedom of the grains. On the other hand, at dense packing ρ > 0.48, clusters of 5- and/or 6-fold coordinated particles increase in size, thus resulting in a decrease in 〈|ψ4|〉 and an increase in 〈|ψ6|〉 with ρ. We then perform simulations at the packing fraction ρ = 0.48 so that a square lattice structure is formed.3.2 Particles confined to the spherical surface
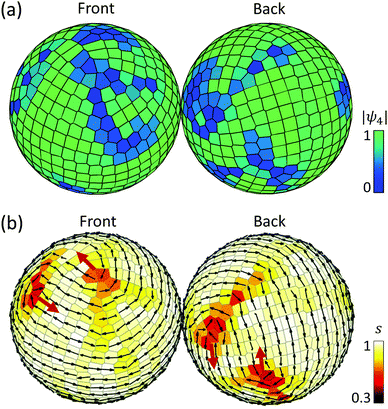
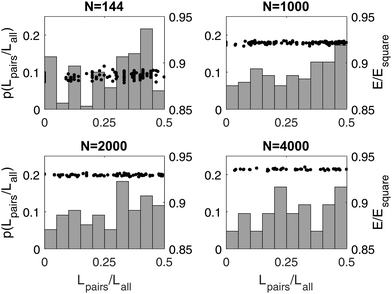
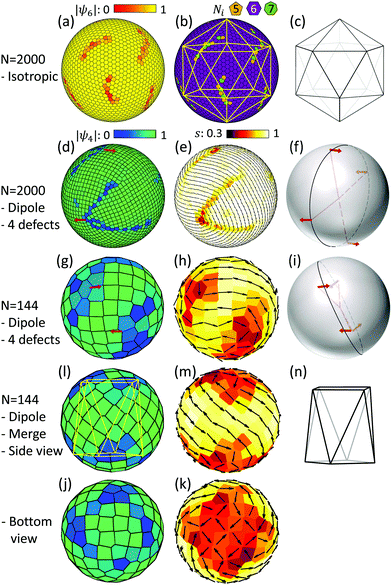
Simulations of dipole-like particles confined to a spherical surface are conducted under conditions identical to the planar geometry case. Fig. 5 illustrates the assembly of particles on the sphere at the volume packing for the square lattice ρ = 0.48. Different from the almost defect-free highly ordered structures in the flat space, the assembled structure on the sphere includes regions lacking both 4-fold order |ψ4| and nematic order s. There are four low nematic order regions whose winding number is +1/2, thus the Euler characteristic of +2 for the sphere is preserved. The anti-parallel direction of the defect core suggests that there are two pairs of +1/2 defects.For a large system size, the relaxation time to reach an equilibrium structure becomes longer. Even on the flat surface, defects tend to survive in the large system size. When there are extra defects on a sphere before reaching the equilibrium state, they affect the position of the four +1/2, and as a result, the numbers of layers of the pair (D1, D1′) and (D2, D2′) are no longer equal. We make sure that the system reaches the equilibrium state so that there is no disclination in the flat space and four +1/2 disclinations on a sphere for the analysis.
 | ||
| Fig. 9 Snapshot of dipole patchy particles on the sphere with the local coordination number and |ψ3|, |ψ5|, and |ψ7| for the case N = 2000 shown in Fig. 8d. | ||
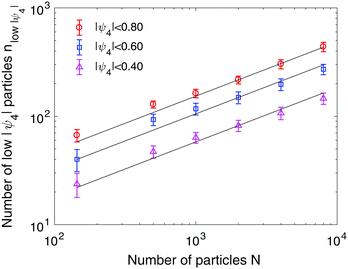
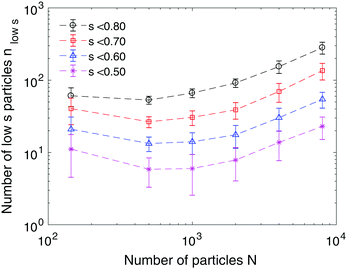
Fig. 10 and 11 show the dependence of the number of particles whose local bond-orientational order parameter |ψ4| and nematic order parameter s are lower than a threshold on the system size N. The relation of the number of low |ψ4| particles to the total number of particles is displayed in Fig. 10. Irrespective of the threshold of |ψ4|, the relation between the low |ψ4| particles and the system size is nlow|ψ4| ∝ N0.5, implying that the grain boundary scars increase almost linearly with the radius of the sphere. Such a linear dependence has been observed for isotropic particles on a sphere, wherein the excess disclinations including 5- and 7-fold particles linearly increase with the sphere radius.21,42 The dependence of the number of low nematic order particles on system size is different from that of |ψ4| in terms of scale and trend (Fig. 11). The number of low s particles increases with the system size for the threshold s < 0.8 and s < 0.7. However, as the threshold is lowered to s < 0.6, the number of low s particles is reduced to a few dozens regardless of the size of the sphere. As given in Fig. 8d and e, there is a strong connection between the low |ψ4| and low s regions. However, the orientations of the particles at the grain boundary scars are distorted at a different level: the nematic order near the +1/2 defect core is significantly lower than the others (Fig. 8e). In other words, the defects of the orientational order consist of their cores surrounded by fringes on which the nematic order s has an intermediate value. The defects of the positional order at which particles do not form the square lattice appear as 1-dimensional lines, which have uniformly low |ψ4|. This observation suggests that the nematic order exhibits point (0-dimensional) +1/2 disclinations, but due to the interaction with the positional order, the cores of the +1/2 disclinations may have tails. The number of particles involved in the cores does not grow as the system size increases, whereas the number of particles in the tails may grow similarly to the defects of the positional order. We expect that these tails are unique in our system that has both positional and orientational order.
4 Discussion and summary
We have performed the assembly of dipole patchy particles on a spherical surface. Defects appear as a requirement due to the topology of the sphere. As for the orientations of the particles, there are many states of the four +1/2 defects near a great circle. The appearance of many stable states of four half-strength defects of the director field is also observed in spherical smectics,43,44 spherical nematics in the extreme elastic constant limit,16,17 and block copolymer assembly.45 In these studies, the four +1/2 defects can be explained by the cut-and-rotate on a sphere of two +1 defects. This operation seems to be applied well to our system. However, we have not found the clear appearance of two +1 defects in the form of concentric layers of particle orientation (Fig. 3a). Even when the two +1/2 defects are very close and topologically equal to a +1 defect (see Fig. 3b for illustration), the two separated clusters of +1/2 defects are clearly identified (see Fig. 6-upper left for simulation). Such a difference is possibly brought about by either the non-zero temperature simulation or the soft, anisotropic interacting potential used in our study.Regarding the topological defect of the square lattice order, the emergence of the grain boundary scars and its linear relation with the sphere radius are moderately analogical to that of the hexagonal lattice.12 The grain boundary scars are revealed to be associated with the four +1/2 defects, rather than sitting at the vertices of a cube. This is expected to be unique in our particle system where both orientational order and positional order are present. In our system, there are two elastic constants associated with the orientational and positional order. They are not independent, but interrelated with each other. For example, when εM in eqn (5) vanishes, there is no longer orientational order, but in this case, the particles do not form the square lattice and break the positional order. The elastic constants set the correlation length of the orientational and positional order. Therefore, it would be an interesting future study to extend our system so that the elastic constants of orientational and positional order can be controlled independently.
Although the 4-fold bond-orientational order parameter ψ4 is sufficient enough to evaluate the disclination, it is still inadequate to determine the exact 3-fold or 5-fold coordinated particles in a square lattice. This is in contrast to the hexagonal lattice formed by isotropic particles (Fig. 8b). The defect scars in the hexagonal lattice are clearly identified by chains of disclinations with their alternating topological charges. One should consider further development for the quadrilateral mesh, especially the irregular regions near a defect. This also gives rise to a question on defect analysis for more complex structures.
While the simulations in our study focus on patchy particle assembly on a thin shell, it is worth extending the study to the effect of the shell's thickness. For spherical nematics, as the thickness increases, the behaviour of defects becomes more complicated because a three-dimensional problem is involved, and the inhomogenity of thickness may be induced.28,46 Regarding the effect of surface shape, it is known that the shape has a strong impact on the localisation of defect scars (for isotropic particles)12,24,47 and disclinations (for nematics).33,48,49 Investigating such effects for patchy particle systems that have higher degrees of freedom than the aforementioned ones seems promising for theoretical and practical applications.
The complex interaction between the positional order and orientational order of particles on a sphere is of fundamental interest for two-dimensional melting. Tuning the potential, e.g., varying the current short-range interaction to the long-range one, or the type of patchy particle, or deformability of the surface, may give rise to a better understanding on the role of the energy-driven factor in the in-plane order. From the materials science aspect, knowing the precise defect structure is important for fabricating the building block, for example, the eight scars in the study can be functionalised by chemical linkers, which can then serve as interacting sites.
Conflicts of interest
There are no conflicts to declare.A Appendix
A.1 Derivation of minimum number of positional defects from Euler theorem
Suppose a closed surface is facetted and divided into a number of V vertices, E edges, and F faces. Euler theorem states that| V − E + F = χ | (9) |
| E = cV/2 | (10) |
On the other hand, each node or vertex of the net may have z connection with the others i.e., there would be Nz dual polygons with z sides. One may find
 | (11) |
 | (12) |
After substituting, we obtain
 | (13) |
For example, applying the above equation for the triangular lattice (c = 3) and quadrilateral lattice (c = 4) gives  and
and  , respectively. This means that on a sphere, the minimum number of disclinations is twelve 5-fold coordinated nodes for the triangular lattice and eight 3-fold coordinated nodes for the quadrilateral one.
Acknowledgements
The authors are grateful to Dr Toru Kajigaya for his helpful discussions. The authors acknowledge the support from JSPS KAKENHI Grant number JP20K14437 to U. T. L., and JP20K03874 and JP20H05259 to N. Y.References
- Q. Chen, S. C. Bae and S. Granick, Nature, 2011, 469, 381–384 CrossRef CAS PubMed.
- Q. Chen, E. Diesel, J. K. Whitmer, S. C. Bae, E. Luijten and S. Granick, J. Am. Chem. Soc., 2011, 133, 7725–7727 CrossRef CAS PubMed.
- Y. Wang, Y. Wang, D. R. Breed, V. N. Manoharan, L. Feng, A. D. Hollingsworth, M. Weck and D. J. Pine, Nature, 2012, 491, 51–55 CrossRef CAS PubMed.
- R. M. Choueiri, E. Galati, H. Thérien-Aubin, A. Klinkova, E. M. Larin, A. Querejeta-Fernández, L. Han, H. L. Xin, O. Gang, E. B. Zhulina, M. Rubinstein and E. Kumacheva, Nature, 2016, 538, 79–83 CrossRef CAS PubMed.
- F. Romano, E. Sanz and F. Sciortino, J. Chem. Phys., 2010, 132, 184501 CrossRef.
- F. Romano, E. Sanz, P. Tartaglia and F. Sciortino, J. Phys.: Condens. Matter, 2012, 24, 064113 CrossRef PubMed.
- F. Romano and F. Sciortino, Nat. Commun., 2012, 3, 975 CrossRef PubMed.
- L. Hong, A. Cacciuto, E. Luijten and S. Granick, Nano Lett., 2006, 6, 2510–2514 CrossRef CAS PubMed.
- L. Hong, A. Cacciuto, E. Luijten and S. Granick, Langmuir, 2008, 24, 621–625 CrossRef CAS PubMed.
- D. R. Nelson, Nano Lett., 2002, 2, 1125–1129 CrossRef CAS.
- Z.-L. Zhang, A. S. Keys, T. Chen and S. C. Glotzer, Langmuir, 2005, 21, 11547–11551 CrossRef CAS PubMed.
- M. J. Bowick and L. Giomi, Adv. Phys., 2009, 58, 449–563 CrossRef CAS.
- R. E. Guerra, C. P. Kelleher, A. D. Hollingsworth and P. M. Chaikin, Nature, 2018, 554, 346–350 CrossRef CAS PubMed.
- T. C. Lubensky and J. Prost, J. Phys. II, 1992, 2, 371–382 CrossRef CAS.
- T. Lopez-Leon, V. Koning, K. B. S. Devaiah, V. Vitelli and A. Fernandez-Nieves, Nat. Phys., 2011, 7, 391–394 Search PubMed.
- H. Shin, M. J. Bowick and X. Xing, Phys. Rev. Lett., 2008, 101, 0037802 CrossRef PubMed.
- M. A. Bates, J. Chem. Phys., 2008, 128, 104707 CrossRef PubMed.
- A. M. Turner, V. Vitelli and D. R. Nelson, Rev. Mod. Phys., 2010, 82, 1301–1348 CrossRef.
- S. Hyde, B. W. Ninham, S. Andersson, K. Larsson, T. Landh, Z. Blum and S. Lidin, The Language of Shape, Elsevier, 1997, pp. 1–42 Search PubMed.
- D. R. Nelson, Defects and Geometry in Condensed Matter Physics, Cambridge University Press, Cambridge, New York, 2002 Search PubMed.
- M. J. Bowick, D. R. Nelson and A. Travesset, Phys. Rev. B: Condens. Matter Mater. Phys., 2000, 62, 8738–8751 CrossRef CAS.
- S. Giarritta, M. Ferrario and P. Giaquinta, Phys. A, 1993, 201, 649–665 CrossRef.
- T. Einert, P. Lipowsky, J. Schilling, M. J. Bowick and A. R. Bausch, Langmuir, 2005, 21, 12076–12079 CrossRef CAS PubMed.
- F. L. Jiménez, N. Stoop, R. Lagrange, J. Dunkel and P. M. Reis, Phys. Rev. Lett., 2016, 116, 104301 CrossRef PubMed.
- K. J. Strandburg, Rev. Mod. Phys., 1988, 60, 161–207 CrossRef CAS.
- P. M. Chaikin and T. C. Lubensky, Principles of Condensed Matter Physics, Cambridge University Press, 1st edn, 1995 Search PubMed.
- R. D. Kamien, Rev. Mod. Phys., 2002, 74, 953–971 CrossRef.
- V. Vitelli and D. R. Nelson, Phys. Rev. E: Stat., Nonlinear, Soft Matter Phys., 2006, 74, 021711 CrossRef CAS PubMed.
- W.-Y. Zhang, Y. Jiang and J. Z. Y. Chen, Phys. Rev. E: Stat., Nonlinear, Soft Matter Phys., 2012, 85, 061710 CrossRef PubMed.
- W.-Y. Zhang, Y. Jiang and J. Z. Y. Chen, Phys. Rev. Lett., 2012, 108, 057801 CrossRef PubMed.
- Q. Liang, S. Ye, P. Zhang and J. Z. Y. Chen, J. Chem. Phys., 2014, 141, 244901 CrossRef PubMed.
- S. Kralj, R. Rosso and E. G. Virga, Soft Matter, 2011, 7, 670–683 RSC.
- V. Koning and V. Vitelli, Fluids, Colloids and Soft Materials, John Wiley & Sons, Ltd, 2016, pp. 369–385 Search PubMed.
- Y. Li, H. Miao, H. Ma and J. Z. Y. Chen, Soft Matter, 2013, 9, 11461 RSC.
- O. V. Manyuhina and M. J. Bowick, Phys. Rev. Lett., 2015, 114, 117801 CAS.
- D. Wang, M. Hermes, R. Kotni, Y. Wu, N. Tasios, Y. Liu, B. de Nijs, E. B. van der Wee, C. B. Murray, M. Dijkstra and A. van Blaaderen, Nat. Commun., 2018, 9, 2228 CrossRef PubMed.
- D. L. Ermak and J. A. McCammon, J. Chem. Phys., 1978, 69, 1352–1360 CrossRef CAS.
- E. Dickinson, S. A. Allison and J. A. McCammon, J. Chem. Soc., Faraday Trans. 2, 1985, 81, 591–601 RSC.
- P. Castro-Villarreal, A. Villada-Balbuena, J. M. Méndez-Alcaraz, R. Castañeda-Priego and S. Estrada-Jiménez, J. Chem. Phys., 2014, 140, 214115 Search PubMed.
- M. M. Moghani and B. Khomami, Soft Matter, 2013, 9, 4815 RSC.
- R. A. DeLaCruz-Araujo, D. J. Beltran-Villegas, R. G. Larson and U. M. Córdova-Figueroa, Soft Matter, 2016, 12, 4071–4081 RSC.
- A. R. Bausch, M. J. Bowick, A. Cacciuto, A. D. Dinsmore, M. F. Hsu, D. R. Nelson, M. G. Nikolaides, A. Travesset and D. A. Weitz, Science, 2003, 299, 1716–1718 CrossRef CAS PubMed.
- X. Xing, J. Stat. Phys., 2009, 134, 487–536 Search PubMed.
- F. Serafin, M. J. Bowick and S. R. Nagel, Eur. Phys. J. E: Soft Matter Biol. Phys., 2018, 41, 143 CrossRef PubMed.
- T. L. Chantawansri, A. W. Bosse, A. Hexemer, H. D. Ceniceros, C. J. García-Cervera, E. J. Kramer and G. H. Fredrickson, Phys. Rev. E: Stat., Nonlinear, Soft Matter Phys., 2007, 75, 031802 CrossRef PubMed.
- D. Seč, T. Lopez-Leon, M. Nobili, C. Blanc, A. Fernandez-Nieves, M. Ravnik and S. Žumer, Phys. Rev. E: Stat., Nonlinear, Soft Matter Phys., 2012, 86, 020705 CrossRef PubMed.
- W. T. M. Irvine, V. Vitelli and P. M. Chaikin, Nature, 2010, 468, 947–951 CrossRef CAS PubMed.
- L. Mesarec, W. Góźdź, A. Iglič and S. Kralj, Sci. Rep., 2016, 6, 27117 CrossRef CAS PubMed.
- L. Mesarec, W. Góźdź, A. Iglič, V. Kralj-Iglič, E. G. Virga and S. Kralj, Sci. Rep., 2019, 9, 19742 CrossRef CAS PubMed.
| This journal is © The Royal Society of Chemistry 2020 |

