 Open Access Article
Creative Commons Attribution 3.0 Unported Licence
Discrete fluidization of dense monodisperse emulsions in neutral wetting microchannels†
Linlin
Fei
a,
Andrea
Scagliarini
 b,
Kai H.
Luo
 *c and
Sauro
Succi
 bde
bde
aCenter for Combustion Energy, Key Laboratory for Thermal Science and Power Engineering of Ministry of Education, Department of Energy and Power Engineering, Tsinghua University, Beijing 100084, China. E-mail: fll15@mails.tsinghua.edu.cn
bIstituto per le Applicazioni del Calcolo, Consiglio Nazionale delle Ricerche, Via dei Taurini 19, 00185 Rome, Italy. E-mail: andrea.scagliarini@cnr.it
cDepartment of Mechanical Engineering, University College London, Torrington Place, London WC1E 7JE, UK. E-mail: K.Luo@ucl.ac.uk
dCenter for Life Nano Science at La Sapienza, Istituto Italiano di Tecnologia, 295 Viale Regina Elena, I-00161 Roma, Italy. E-mail: sauro.succi@gmail.com
eHarvard Institute for Applied Computational Science, Cambridge, Massachusetts 02138, USA
First published on 29th November 2019
Abstract
The rheology of pressure-driven flows of two-dimensional dense monodisperse emulsions in neutral wetting microchannels is investigated by means of mesoscopic lattice Boltzmann simulations, capable of handling large collections of droplets, in the order of several hundreds. The simulations reveal that the fluidization of the emulsion proceeds through a sequence of discrete steps, characterized by yielding events whereby layers of droplets start rolling over each other, thus leading to sudden drops of the relative effective viscosity. It is shown that such discrete fluidization is robust against loss of confinement, namely it persists also in the regime of small ratios of the droplet diameter over the microchannel width. We also develop a simple phenomenological model which predicts a linear relation between the relative effective viscosity of the emulsion and the product of the confinement parameter (global size of the device over droplet radius) and the viscosity ratio between the disperse and continuous phases. The model shows excellent agreement with the numerical simulations. The present work offers new insights to enable the design of microfluidic scaffolds for tissue engineering applications and paves the way to detailed rheological studies of soft-glassy materials in complex geometries.
1 Introduction
Dense emulsions and suspensions of soft particles are widespread in natural as well as engineering applications, ranging from biofluids and food to pharmaceutical and cosmetic industrial processes.1,2 A deeper understanding of the basic rheology of these soft glassy materials (SGMs) is therefore beneficial to the advancement of many fields of science and technology.3,4The flow characteristics of these systems depend, often in a not trivial way, on many parameters, such as volume fraction, interfacial properties, deformability of the elementary, constituents, confinement, etc. Consequently, depending on the load conditions, SGMs display a variety of non-Newtonian features like yielding, shear thinning/thickening, rheopexy and thixotropy that make their rheology an outstanding open issue in non-equilibrium statistical physics.1 During the past decades, significant attention has been paid to the microstructures of colloidal crystals and foams and their transformations under shear stress.5–9 For example, Chen et al. studied structural changes and orientational order for dense colloidal suspensions under shear.5 At low shear, the lattice structure will change from a crystalline state to a polycrystalline state, while at large shear, they reported the appearance of a sliding layer flow.5 Debregeas et al. investigated the deformation and flow of 2D foam (composed of jammed bubbles) under continuous shear in a Couette geometry.7 They found rapid decay of the average velocity from the moving inner wall to the fixed outer wall, as well as large velocity fluctuations with self-similar dynamical structures inbetween. They also developed a stochastic model relating the plastic flow to the stress fluctuations. Cicuta et al. reported rheological measurements on dense soft glass with an interfacial stress rheometer (ISR).8 They found an interesting response of the elastic modulus:8 a transition from viscous liquid towards an elastic solid with the increase of concentration, and an inverse transition (from elastic to viscous) with the increase of shear frequency.
The shear rheology of a wide class of SGMs10–12 can be described by the Herschel–Bulkley relation13 between the applied stress σ and the responsive shear rate ![[small gamma, Greek, dot above]](https://www.rsc.org/images/entities/i_char_e0a2.gif) ,
,
σ = σY + K![[small gamma, Greek, dot above]](https://www.rsc.org/images/entities/char_e0a2.gif) c c | (1) |
Different from the previous study within the Couette geometry,5,7,8,19,20 the present work focuses on the deformation and flow of two-dimensional (2D) emulsions in the Poiseuille geometry. When a pressure difference is imposed along a neutral wetting microchannel, the shear stress varies linearly from wall to wall, being maximum at the sidewalls and zero in the channel center. With the increase in pressure difference, it is possible to achieve a fluid-like state near the wall, i.e., σw > σY, where σw indicates the wall stress. However, if the material develops a non-vanishing yield stress σY, there will always be a region, in the middle of the channel, where the emulsion is below yield and must be expected to move as a plug. For the meso-constituents near the wall, different from sliding on a non-wetting microchannel,22 they are expected to stick on the neutral-wetting wall. In such a setup, the way a soft-glassy material fluidizes, i.e. the plug-to-fluid flow transition, still lacks a full understanding. As we mentioned, the microstructure in which the meso-constituents (droplets in the case of emulsions) are arranged is known to play a determining role; two structural indicators are crucial in this respect, namely the polydispersity, that measures the statistical distribution of sizes of the meso-constituents, and the degree of order in their spatial arrangement (crystalline vs. amorphous).23–25 In addition, a high volume fraction Φ of the dispersed droplets is necessary to support such a microstructure transition. For example, recent studies on the T1 transition in complex microchannels are mainly based on emulsions/foams with Φ ≳ 0.85.26–28
The rest of the paper is organized as follows. In Section 2, we give a brief introduction of the numerical model: the two-species lattice Boltzmann (LB) model with suitable pseudo-potential interactions. The main features of the adopted numerical model are discussed and well validated. In Section 3, we prepare perfectly 2D monodisperse dense emulsions (constituted of soft droplets), with crystalline order, confined in microchannels and driven by a pressure gradient. The droplets are packed at the jamming volume fraction, such that the emulsion behaves as an elastic solid for vanishingly low applied loads. We focus, then, on the fluidization of the material and find that the latter takes place as a discontinuous process with the increase of pressure gradient, characterized by successive local yielding events, where layers of droplets, starting from those closer to the boundaries, are more and more deformed and roll over each other. Scanning the imposed forcing, we observe that these events cause sudden drops of the relative effective viscosity between from one plateau to another; the relative effective viscosity is, therefore, “quantized”, in the sense that it takes values only over a discrete set. The first and largest jump occurs for a critical pressure difference, which we find to be such that the wall stress equals the yield stress of the material. We show, moreover, that the value of the relative effective viscosity in the plug state depends, in a way that we characterize quantitatively, on the viscosity ratio between the disperse and continuous phases and confinement parameter (channel height over droplet radius). Finally, a brief summary and some research perspectives are given in Section 4.
2 Model description and validation
We perform numerical simulations based on a two-species lattice Boltzmann (LB) model, with suitable pseudo-potential interactions. Recently, the LB method has become a very efficient and powerful simulation method for complex flows.29–40 The LB equation takes the form:41–44 | (2) |
 are the time step and lattice sound speed, respectively. During the evolution of eqn (2), the density and momentum for each species are calculated as,
 | (3) |
 , where the total density is
  .
.
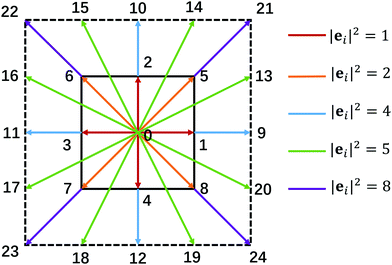 | ||
| Fig. 1 The discrete lattice used in our two-species LB model. The fluid lives in the sub-lattice (D2Q9), while the interactions extend to the full lattice (D2Q25). | ||
For the two-species system, a repulsive force between species, promoting a positive surface tension, is given as usual,45
 | (4) |
![[k with combining macron]](https://www.rsc.org/images/entities/i_char_006b_0304.gif) = G
= G![[k with combining macron]](https://www.rsc.org/images/entities/i_char_006b_0304.gif) k is the strength coefficient for the inter-component interaction, and the weights are w(0) = 4/9, w(1) = 1/9, and w(2) = 1/36. A crucial characteristic of our adopted two species LB model is the competing mechanism between a short range attraction and a mid-range repulsion within each species.46 The short-range attraction acts between the nearest-neighbor D2Q9 lattice nodes, while the mid-range repulsion acts between the next-to-nearest-neighbor lattice nodes extending up to the D2Q25 lattice ej (j = 0, 1,…,24, see Fig. 1). The competing interaction is explicitly written as,46
k is the strength coefficient for the inter-component interaction, and the weights are w(0) = 4/9, w(1) = 1/9, and w(2) = 1/36. A crucial characteristic of our adopted two species LB model is the competing mechanism between a short range attraction and a mid-range repulsion within each species.46 The short-range attraction acts between the nearest-neighbor D2Q9 lattice nodes, while the mid-range repulsion acts between the next-to-nearest-neighbor lattice nodes extending up to the D2Q25 lattice ej (j = 0, 1,…,24, see Fig. 1). The competing interaction is explicitly written as,46 | (5) |
![[thin space (1/6-em)]](https://www.rsc.org/images/entities/char_2009.gif) 120. The pseudo-potential function originally suggested in ref. 45 and 47, ψk(ρk) = ρ0(1 − e−ρk/ρ0) (with an identical reference density ρ0 = 1.0 for each component) is adopted. Supplemented with the body force Fbk, the total force imposed on each species is Fk = Fbk + Frk + Fck.
120. The pseudo-potential function originally suggested in ref. 45 and 47, ψk(ρk) = ρ0(1 − e−ρk/ρ0) (with an identical reference density ρ0 = 1.0 for each component) is adopted. Supplemented with the body force Fbk, the total force imposed on each species is Fk = Fbk + Frk + Fck.
The above definition of Fck is to mimic the spatially complex (non-monotonic) interactions among molecules within each species. For example, the interplay between the competing interactions can give rise to a rich density-field configuration, which has proved fairly successful in reproducing many features of soft flowing systems, such as structural frustration, aging, elastoplastic rheology, in confined and unbounded flows.9,25,48,49 In addition, it has been shown that by appropriately tuning the strengths of the two interactions, a positive disjoining pressure Π, which emerges as a repulsive force per unit area between opposing interfaces, can be obtained at sufficiently low film thickness.48 Moreover, such a positive disjoining pressure can be tuned independently of the viscosity ratio between the two species, as recently proposed in ref. 22.
To verify the adopted LB model, we first consider two flat interfaces among three fluid domains (occupied by species 1, 2 and 1, respectively), separated by a distance h (the width of the middle fluid domain). According to,48,50 the disjoining pressure Π is defined as,
 | (6) |
 . Supplemented with the boundary conditions, γf(h→∞) = 2γ and Π(h→∞) = 0, the disjoining pressure Π at a given h can be calculated using standard numerical integration methods.22 The obtained disjoining pressure based on the above theory is shown in Fig. 2. It can be seen that for the original pseudo-potential model45 (Gk,1 = 0, Gk,2 = 0, i.e., without the competing interaction), the disjoining pressure is always negative and decreases with decreasing h. By tuning the competing interaction appropriately (Gk,1 = −10 and Gk,2 = 8), the disjoining pressure first increases with the decrease of h and then goes down, achieving positive values in between. Moreover, the disjoining pressure profile is independent of the viscosity ratio χ between the two species within a moderate range.
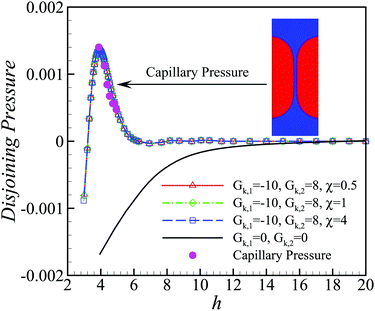 | ||
| Fig. 2 Lines: theoretical disjoining pressure curves by eqn (6) for different cases; pink filled circle: capillary pressure curve based on the two hemispherical droplets system at Gk,1 = − 10, Gk,2 = 8 and χ = 1; inset: a stable two hemispherical droplets system. The positive disjoining pressure between the close-contact interfaces stabilizes the thin film inbetween. | ||
To test the above theory, we then perform a numerical measurement based on the method suggested in ref. 48: two hemispherical droplets (species 1) are pushed against each other to form a thin film (species 2) inbetween. According to the mechanical equilibrium, the disjoining pressure in the thin film must be equal to the capillary pressure at the curved interface, defined as the pressure difference from both sides of the curved interface. By changing the radii of the droplets, we can obtain the capillary pressure at different values of the film width h. A good agreement between the theoretical disjoining pressure and the measured capillary pressure can be clearly seen in Fig. 2. It is noted that the capillary pressure curves at varying viscosity ratio χ are essentially identical and only the case of χ = 1 is shown in Fig. 2.
Therefore, the novelty of our improved numerical model, recently proposed in ref. 22, resides in a number of original features which prove key to probing the high packing regime typical of dense emulsions, in particular: (i) the emergence of a positive disjoining pressure between close-contact interfaces, which stabilizes the thin films between colliding droplets and prevents their coalescence, (ii) the possibility to tune the dynamic viscosity ratio between the two species, independently of surface tension and disjoining pressure, within a moderate range, and (iii) the highly efficient implementation of dense emulsions with up to hundreds of dispersed droplets, due to the explicit and simple algorithm for only two species probabilities fk,i (k = 1, 2).
3 Numerical results and discussion
3.1 Discrete fluidization
We prepare the monodisperse soft suspensions by packing equal sized droplets, of radius R = 18 lattice units, in a 2D microchannel, with the length and width varied in the range L ∈ [200, 800] and H ∈ [201, 804], respectively; no-slip boundary conditions for the velocity and neutral wetting conditions for the two fluids (contact angle of 90°) are imposed on both walls. Large values of L × H, with up to ≈500 droplets, are necessary to verify that the discontinuous rheological response is not an artifact due to small sizes, and let us unravel the impact of confinement. We would like to stress that such sizes would be computationally unfeasible with other LB methods where coalescence is prevented by introducing a distinct species for each droplet,21 even equipped with advanced acceleration algorithm based on the exclusion principle.52We introduce the two non-dimensional parameters that play a key role in the dynamics: the confinement parameter ξ = H/R, where R is the droplet radius (large ξ means low confinement and vice versa), and the viscosity ratio χ = μD/μC, where μD and μC are the dynamic viscosity of the droplets and continuous phase, respectively. The viscosity ratio is tuned by changing μD with fixed μC = 0.1. The pressure difference Δp between inlet and outlet is imposed via a homogeneous body force Δp/L; the lattice interaction parameters are chosen as, Gk![[k with combining macron]](https://www.rsc.org/images/entities/i_char_006b_0304.gif) = G
= G![[k with combining macron]](https://www.rsc.org/images/entities/i_char_006b_0304.gif) k = 2.33, Gk,1 = −10, Gk,2 = 8, to realize a surface tension (γ ≈ 0.02), such that the corresponding Laplace pressure for droplets is pL ≡ γ/R ≈ 10−3 (LB units) and to achieve a positive disjoining pressure, sufficient to prevent droplet coalescence (see Fig. 2). We performed a set of runs spanning the 2D parameter space (ξ,χ), at effective volume fraction of the dispersed phase Φ ≈ 0.9.53,54
k = 2.33, Gk,1 = −10, Gk,2 = 8, to realize a surface tension (γ ≈ 0.02), such that the corresponding Laplace pressure for droplets is pL ≡ γ/R ≈ 10−3 (LB units) and to achieve a positive disjoining pressure, sufficient to prevent droplet coalescence (see Fig. 2). We performed a set of runs spanning the 2D parameter space (ξ,χ), at effective volume fraction of the dispersed phase Φ ≈ 0.9.53,54
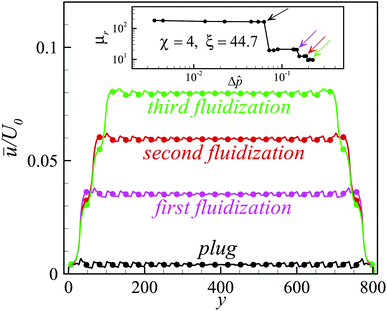
In Fig. 3(a) and (b), we show two typical snapshots of the simulated system (the density field of the dispersed phase fluid ρD is depicted, the red/blue colours indicating high/low values; see also the ESI,† Movies S1 and S2): an emulsion with viscosity ratio χ = 4 and under low confinement, ξ = 44.7, is subject to low [panel (a)] and high forcing [panel (b)]. The corresponding streamwise velocity profiles ū(y) (averaged along the x-direction and in time, over the steady state) are plotted in Fig. 3c, with blue/red lines standing for low/high pressure gradients, respectively. In both cases the profiles flatten (as compared to the parabolic profile expected for a Poiseuille flow in a simple liquid), signalling that a portion of bulk remains below yield. However, while for the lower forcing this region extends over the whole volume, such that the material moves coherently as a solid block (a “plug”), for the higher forcing the droplets in the two layers next to the walls are more deformed and the droplets in the next-to-nearest layer roll over those in direct contact with the wall periodically: in other words, the emulsion starts to be “fluidized” (see Movie S2, ESI†). This is confirmed in the inset of the same figure, where we plot the velocities of the first two layers of droplets (counting from the bottom wall), called u1 and u2: in the plug state these two values coincide (no deformation within the material, as it would be for a solid), whereas, at increasing the pressure difference, they bifurcate, with u2 > u1 and periodic velocity oscillations.
One may wonder whether other activation events of this kind will involve more and more droplet layers, for larger and larger imposed pressure gradients. This is, indeed, what happens, as we can grasp from the main panel of Fig. 4, by inspection of the velocity profiles (same system as in Fig. 3, i.e. with χ = 4 and ξ = 44.7), where, by second and third fluidization, we mean the activation of the third and fourth droplet layers (and the symmetric ones on the top wall side) that extends the region of shear localization towards the bulk.
To characterize the different flow regimes, at changing the imposed pressure drop, we define the relative effective viscosity, μr = Q0/Q,55 where Q0 is the flow rate for the pure continuous phase for a given Δ![[p with combining circumflex]](https://www.rsc.org/images/entities/i_char_0070_0302.gif) (defined later) and
(defined later) and  is the emulsion flow rate. The dependence of μr on Δ
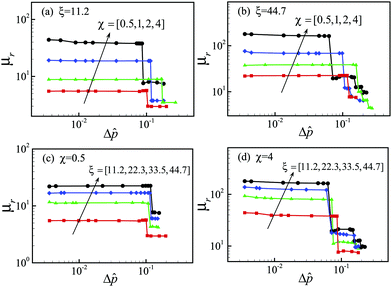
![[p with combining circumflex]](https://www.rsc.org/images/entities/i_char_0070_0302.gif) for various viscosity ratios and confinement parameters is shown in Fig. 5: for fixed confinement and varying viscosity ratio (Fig. 5(a), ξ = 11.2, and Fig. 5(b), ξ = 44.7), and for fixed viscosity ratio and varying confinement (Fig. 5(c), χ = 0.5, and Fig. 5(d), χ = 4), respectively. In every data set, we observe an initial steep decrease of μr for very low pressure differences (Δ
for various viscosity ratios and confinement parameters is shown in Fig. 5: for fixed confinement and varying viscosity ratio (Fig. 5(a), ξ = 11.2, and Fig. 5(b), ξ = 44.7), and for fixed viscosity ratio and varying confinement (Fig. 5(c), χ = 0.5, and Fig. 5(d), χ = 4), respectively. In every data set, we observe an initial steep decrease of μr for very low pressure differences (Δ![[p with combining circumflex]](https://www.rsc.org/images/entities/i_char_0070_0302.gif) ≤ 10−3, not shown in the figure), followed by a clear-cut step-wise behaviour: μr is roughly constant, μr ≈ μPr (the superscript P standing for “plug state”), over a certain range of Δ
≤ 10−3, not shown in the figure), followed by a clear-cut step-wise behaviour: μr is roughly constant, μr ≈ μPr (the superscript P standing for “plug state”), over a certain range of Δ![[p with combining circumflex]](https://www.rsc.org/images/entities/i_char_0070_0302.gif) values, and then suddenly jumps to a lower plateau μFr (“fluidized state”), as the pressure difference is increased beyond a “critical” threshold Δ
values, and then suddenly jumps to a lower plateau μFr (“fluidized state”), as the pressure difference is increased beyond a “critical” threshold Δ![[p with combining circumflex]](https://www.rsc.org/images/entities/i_char_0070_0302.gif) c. The applied pressure drops (on the x-axis) are made dimensionless, hereafter, as follows:
c. The applied pressure drops (on the x-axis) are made dimensionless, hereafter, as follows:
 | (7) |
![[p with combining circumflex]](https://www.rsc.org/images/entities/i_char_0070_0302.gif) is increased further, the relative effective viscosity develops more additional jumps (see Fig. 5(b)and (d), as well as the inset of Fig. 4), and related after-jump plateaux. Essentially, the material responds elastically to the increasing applied load (whence the μr-plateaux), up to a point where the stress cannot be sustained any more and the system yields (corresponding to the μr-jumps), with successive boundary trains of droplets that start to roll over each other (see Movies S3 and S4, ESI†). This phenomenology is what we dub discrete fluidization, with an accompanying discrete relative effective viscosity. Let us underline that jumps at higher Δ
is increased further, the relative effective viscosity develops more additional jumps (see Fig. 5(b)and (d), as well as the inset of Fig. 4), and related after-jump plateaux. Essentially, the material responds elastically to the increasing applied load (whence the μr-plateaux), up to a point where the stress cannot be sustained any more and the system yields (corresponding to the μr-jumps), with successive boundary trains of droplets that start to roll over each other (see Movies S3 and S4, ESI†). This phenomenology is what we dub discrete fluidization, with an accompanying discrete relative effective viscosity. Let us underline that jumps at higher Δ![[p with combining circumflex]](https://www.rsc.org/images/entities/i_char_0070_0302.gif) are smaller and smaller, suggesting that the fluidization process is recovering continuity and eventually the material starts flowing as a viscous, non-Newtonian, fluid.
are smaller and smaller, suggesting that the fluidization process is recovering continuity and eventually the material starts flowing as a viscous, non-Newtonian, fluid.
Recently, Foglino et al. also found the first and largest jump for emulsions with unit viscosity ratio in a small channel (χ = 1 and ξ = 12).21 In the present work, such a behaviour is further confirmed and significantly extended, and its robustness is well verified, in the sense that we find even more jumps in a larger parameter space (χ, ξ). In addition, the first jump was interpreted as a discontinuous shear thinning behaviour.21 We would like to stress that the shear-thinning process happens in a material which is well beyond yield, i.e., σ > σY, as we have discussed in the Introduction. In our simulations, the first discontinuity in the μrvs. Δ![[p with combining circumflex]](https://www.rsc.org/images/entities/i_char_0070_0302.gif) curve, instead, coincides for all ξ's, upon the proper rescaling eqn (7), at roughly the same critical pressure drop Δ
curve, instead, coincides for all ξ's, upon the proper rescaling eqn (7), at roughly the same critical pressure drop Δ![[p with combining circumflex]](https://www.rsc.org/images/entities/i_char_0070_0302.gif) ≈ 0.1. Remarkably, the latter condition is equivalent to,
≈ 0.1. Remarkably, the latter condition is equivalent to,
 | (8) |
Taking the channel height H as the characteristic length, V = Q/H as the characteristic velocity, the Reynolds number and Capillary number can be defined, respectively, as Re = ρDVH/μD and Ca = μDV/γ. For all the cases considered in the present work (i.e., Fig. 5), the Re and Ca span approximately from 0.015 to 500 and 0.0006 to 0.7, respectively. It is noted that the maximum Capillary numbers in the plug state, indicated as Ca*, for all the considered cases, almost collapse around 0.01–0.03, as shown in Fig. 6, while we do not find a similar collapse for the critical Reynolds number. This criterion is consistent with the previous study for the dislocation dynamics in 2D emulsion crystal in a tapered channel that horizontal slip planes parallel to the x axis are observed at Ca ≳ 10−2.26 In the experiments, the extrusion speed of the crystal needs to be sufficiently small (Ca < 10−2), so that the flowing foam is in the solid-like plug state (below yield) and the spatial distributions of T1 evens remain localized in distinct rearrangement zones.26,28 In other words, the collapse of the critical Capillary number, Ca* ∼ 10−2, further supports our previous argument that the plug-to-fluid transitions indicate local yielding events.
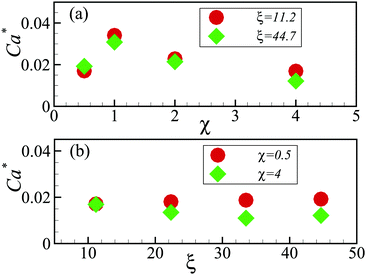 | ||
| Fig. 6 Variation of the maximum Capillary number in the plug state, Ca*, with viscosity ratio χ (panel (a)), and with confinement parameter ξ (panel (b)). | ||
3.2 Dependence on confinement and viscosity ratio
We then move to address the confinement and viscosity ratio dependence of the rheological response more quantitatively, we focus next on the value of μr at the first plateau, denoted as μPr. In Fig. 7(a) we plot μPr, averaged over the low Δ![[p with combining circumflex]](https://www.rsc.org/images/entities/i_char_0070_0302.gif) plateau, as a function of the viscosity ratio χ, finding a linear scaling, μPr ∝ χ, highlighted by the dashed line. This growth of the μPr with χ is a consequence of the lower deformability of droplets, as their intrinsic viscosity exceeds that of the continuous phase. The linear scaling, which is less obvious and to which we will return shortly, is preserved also for larger system sizes (Fig. 7(b)), albeit with a larger prefactor. Analogous plots, showing the effective plug viscosity as a function of the confinement parameter ξ, for two different viscosity ratios, are reported in Fig. 7(c) and (d). In either case, μPr increases linearly with ξ, μPr∝ξ, with a χ-dependent prefactor.
plateau, as a function of the viscosity ratio χ, finding a linear scaling, μPr ∝ χ, highlighted by the dashed line. This growth of the μPr with χ is a consequence of the lower deformability of droplets, as their intrinsic viscosity exceeds that of the continuous phase. The linear scaling, which is less obvious and to which we will return shortly, is preserved also for larger system sizes (Fig. 7(b)), albeit with a larger prefactor. Analogous plots, showing the effective plug viscosity as a function of the confinement parameter ξ, for two different viscosity ratios, are reported in Fig. 7(c) and (d). In either case, μPr increases linearly with ξ, μPr∝ξ, with a χ-dependent prefactor.
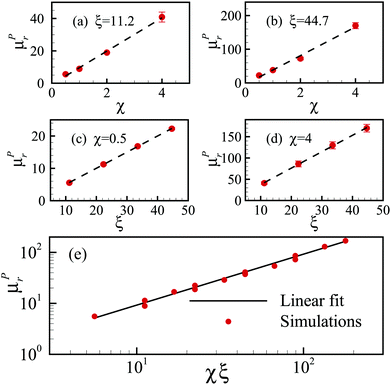 | ||
| Fig. 7 Relative effective viscosity at the plug state, μPr. Panels (a)–(d): μPr as a function of the viscosity ratio (panels (a) and (b)) and of the confinement parameter (panels (c) and (d)), respectively. The dashed lines represent linear scalings. Panel (e): μPr as a function of the product of viscosity ratio and confinement parameter, χξ. The solid line represents the linear relation μPr ∼ χξ in eqn (11). | ||
We now proceed to rationalize the results on the plug viscosity under the light of simple phenomenological arguments grounded on mechanical considerations. Let us first notice that, since in the plug state the whole material moves as a solid, the mass flux is QP ≈ UH, where U is the travelling speed shared by all droplet layers and whose value is dictated by the sliding velocity of the droplets on the walls, that we need to evaluate. To this purpose, we recall that, when a pressure gradient Δp/L is applied to a continuum system limited by solid walls (at a distance H far apart), the force balance provides a wall stress σw = ΔpH/(2L). A droplet in contact with the wall will be, then, subjected to a force F ∝ ΔpHR/(2L), delivering a power input ![[scr P, script letter P]](https://www.rsc.org/images/entities/char_e52f.gif) in ∝ ΔpHRU/(2L); such input has to be balanced by the total dissipated power
in ∝ ΔpHRU/(2L); such input has to be balanced by the total dissipated power ![[scr P, script letter P]](https://www.rsc.org/images/entities/char_e52f.gif) diss inside the droplet, which can be estimated as the product of the viscous dissipation rate per unit volume εμD ≈ μD(U/R)2 and the droplet “volume”, ∝R2i.e.:57,58
diss inside the droplet, which can be estimated as the product of the viscous dissipation rate per unit volume εμD ≈ μD(U/R)2 and the droplet “volume”, ∝R2i.e.:57,58 ![[scr P, script letter P]](https://www.rsc.org/images/entities/char_e52f.gif) diss ∼ μD(U/R)2R2 = μDU2. Although this estimate and the one for the force acting on a droplet are based on a 2D system, it is easy to notice that the scaling relation for U remains the same in 3D. Solving the balance equation
diss ∼ μD(U/R)2R2 = μDU2. Although this estimate and the one for the force acting on a droplet are based on a 2D system, it is easy to notice that the scaling relation for U remains the same in 3D. Solving the balance equation ![[scr P, script letter P]](https://www.rsc.org/images/entities/char_e52f.gif) in =
in = ![[scr P, script letter P]](https://www.rsc.org/images/entities/char_e52f.gif) diss for U yields:
diss for U yields:
| U ∼ [Δp/(2L)]HR/μD, | (9) |
| QP ≈ UH ∼ [Δp/(2L)]RH2/μD. | (10) |
Since the mass flux in pure continuous phase Poiseuille flow is Q0 = (2H/3)U0 = ΔpH3/(12LμC), we readily obtain for the relative effective plug viscosity μPr:
 | (11) |
To check the validity of our prediction in eqn (11), we plot in Fig. 7(e) the values of μPr as a function of the product χξ, for all combinations of (χ,ξ) considered in this work, which span the ranges χ ∈ [0.5;4] and ξ ∈ [11.2;44.7]. We observe that all points tend to collapse, over a comparatively wide range of parameter values, onto a unique master curve which is well fitted by a single linear relation μPr = Aξχ, in agreement with eqn (11), with a prefactor A ≈ 0.92.
3.3 Effect of polydispersity
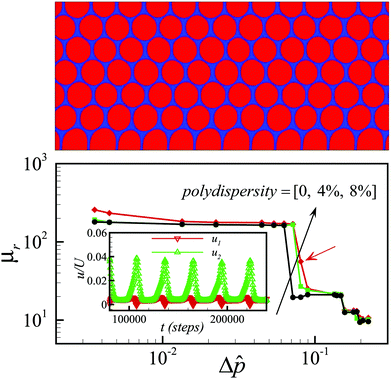
Although the monodisperse emulsions have been used in many microfluidic systems,26,28,59 the realization of perfectly monodisperse emulsions is essentially impossible in experimental systems. Nevertheless, using the advanced experimental techniques,60,61 monodisperse droplets can be generated with very small volume polydispersity, e.g., less than 3%.27,59 To link the present work with future experiments, it is necessary to discuss the effect of small volume polydispersity on the discrete fluidization process. To this end, we initialize the monodisperse emulsions, with some perturbations for each droplet's density (ρ = ρ0 + δρ). As a result, a emulsion system with finite volume polydispersity can be produced in the steady state, and a snapshot for the case with 8% polydispersity is shown in the top panel of Fig. 8.We then perform the same pressure-driven simulations as before and obtain the relative effect viscosity curves for the produced polydisperse emulsions. We find that, for small and experimentally achievable volume polydispersity (4%), the presented phenomenon is well preserved, in the sense that we still observe a steep change in the relative effective viscosity around a characteristic pressure difference, but the “plug”–“fluidized” transition is gradually smoothed out with the increase of polydispersity (see Fig. 8). For example, we can see a metastable state for the 8% polydispersity case (marked by the red arrow in Fig. 8), in the sense that the first and second layer droplets coincide and bifurcate periodically (in the inset of the bottom panel) and as a result the relative effective viscosity at the specified pressure gradient switches between the “plug” and “fluidized” state intermittently.
4 Conclusions
In summary, monodisperse crystalline dense emulsions in a pressure-driven microchannel flow have been investigated numerically, using a new mesoscopic lattice kinetic model. Our study unveils the discrete nature of the relative effective viscosity of this kind of soft materials under confinement and rationalizes their discrete fluidizations. We show, for the first time, that such a phenomenon is preserved in large (low confined) systems and even at changing viscosity ratio between the two phases. We also provide physical interpretation of the phenomenon that the discrete fluidization is ascribed to local yielding events. Furthermore, we have proposed a theoretical argument for the scaling relation of the relative effective viscosity of the “plug” state with confinement and viscosity ratio, and established its validity over a wide parameter range.We would like to stress that our results might be of more general applicability. We expect that our model of SGMs, within suitable constraints on the imposed forcing, can capture the physics of a broad family of monodisperse suspensions of deformable particles (droplets and bubbles, as in foams, vesicles, etc.) densely packed and confined in a microchannel.
Due to the simplicity of the configuration, it would be completely realistic to recreate the discrete fluidization in the lab, via suspensions of soft and non-coalescing droplets. In the future, it would also be informative to study the fluidization of dense emulsions or foams in more realistic geometries.27,28
Conflicts of interest
There are no conflicts to declare.Acknowledgements
The research leading to these results has received funding from the MOST National Key Research and Development Programme (Project No. 2016YFB0600805) and the European Research Council under the European Union Horizon 2020 Framework Programme (No. FP/2014-2020)/ERC Grant Agreement No. 739964 (COPMAT). Supercomputing time on ARCHER is provided by the UK Consortium on Mesoscale Engineering Sciences (UKCOMES) under the UK Engineering and Physical Sciences Research Council Grant No. EP/R029598/1.References
- R. G. Larson, The Structure and Rheology of Complex Fluids, Oxford University Press, New York, 1999 Search PubMed.
- P. Coussot, Rheometry of pastes, suspensions, and granular materials: applications in industry and environment, John Wiley & Sons, 2005 Search PubMed.
- P. Sollich, F. Lequeux, P. Hébraud and M. E. Cates, Phys. Rev. Lett., 1997, 78, 2020 CrossRef CAS.
- D. Bonn, M. M. Denn, L. Berthier, T. Divoux and S. Manneville, Rev. Mod. Phys., 2017, 89, 035005 CrossRef.
- L. Chen, C. Zukoski, B. Ackerson, H. Hanley, G. Straty, J. Barker and C. Glinka, Phys. Rev. Lett., 1992, 69, 688 CrossRef CAS.
- C. F. Brooks, G. G. Fuller, C. W. Frank and C. R. Robertson, Langmuir, 1999, 15, 2450–2459 CrossRef CAS.
- G. Debregeas, H. Tabuteau and J.-M. D. Meglio, Phys. Rev. Lett., 2001, 87, 178305 CrossRef CAS.
- P. Cicuta, E. J. Stancik and G. G. Fuller, Phys. Rev. Lett., 2003, 90, 236101 CrossRef.
- B. Dollet, A. Scagliarini and M. Sbragaglia, J. Fluid Mech., 2015, 766, 556–589 CrossRef CAS.
- P. Coussot, Soft Matter, 2007, 3, 528–540 RSC.
- R. Höhler and S. Cohen-Addad, J. Phys.: Condens. Matter, 2005, 17, R1041 CrossRef.
- L. Bécu, S. Manneville and A. Colin, Phys. Rev. Lett., 2006, 96, 138302 CrossRef.
- W. H. Herschel and R. Bulkley, Colloid Polym. Sci., 1926, 39, 291–300 CrossRef.
- R. Seto, R. Mari, J. F. Morris and M. M. Denn, Phys. Rev. Lett., 2013, 111, 218301 CrossRef.
- N. Fernandez, R. Mani, D. Rinaldi, D. Kadau, M. Mosquet, H. Lombois-Burger, J. Cayer-Barrioz, H. J. Herrmann, N. D. Spencer and L. Isa, Phys. Rev. Lett., 2013, 111, 108301 CrossRef.
- M. Wyart and M. E. Cates, Phys. Rev. Lett., 2014, 112, 098302 CrossRef CAS.
- T. Kawasaki and L. Berthier, Phys. Rev. E, 2018, 98, 012609 CrossRef CAS.
- E. Brown and H. M. Jaeger, Rep. Prog. Phys., 2014, 77, 046602 CrossRef.
- L. Chen and C. Zukoski, Phys. Rev. Lett., 1990, 65, 44 CrossRef CAS.
- E. Irani, P. Chaudhuri and C. Heussinger, Phys. Rev. Fluids, 2019, 4, 074307 CrossRef.
- M. Foglino, A. N. Morozov, O. Henrich and D. Marenduzzo, Phys. Rev. Lett., 2017, 119, 208002 CrossRef CAS.
- L. Fei, A. Scagliarini, A. Montessori, M. Lauricella, S. Succi and K. H. Luo, Phys. Rev. Fluids, 2018, 3, 104304 CrossRef.
- A. Saint-Jalmes and D. J. Durian, J. Rheol., 1999, 43, 1411–1422 CrossRef CAS.
- H. Shiba and A. Onuki, Phys. Rev. E: Stat., Nonlinear, Soft Matter Phys., 2010, 81, 051501 CrossRef PubMed.
- R. Benzi, M. Sbragaglia, A. Scagliarini, P. Perlekar, M. Bernaschi, S. Succi and F. Toschi, Soft Matter, 2015, 11, 1271–1280 RSC.
- Y. Gai, C. M. Leong, W. Cai and S. K. Tang, Proc. Natl. Acad. Sci. U. S. A., 2016, 113, 12082–12087 CrossRef CAS PubMed.
- Y. Gai, A. Bick and S. K. Tang, Phys. Rev. Fluids, 2019, 4, 014201 CrossRef.
- D. Vecchiolla and S. L. Biswal, Soft Matter, 2019, 15, 6207–6223 RSC.
- Q. Li, Q. J. Kang, M. M. Francois and A. Hu, Soft Matter, 2016, 12, 302–312 RSC.
- L. Fei and K. H. Luo, Phys. Rev. E, 2017, 96, 053307 CrossRef PubMed.
- C. E. Colosqui, G. Falcucci, S. Ubertini and S. Succi, Soft Matter, 2012, 8, 3798–3809 RSC.
- L. Fei, K. H. Luo and Q. Li, Phys. Rev. E, 2018, 97, 053309 CrossRef CAS.
- Q. Li, K. H. Luo, Q. Kang, Y. He, Q. Chen and Q. Liu, Prog. Energy Combust. Sci., 2016, 52, 62–105 CrossRef.
- L. Fei, J. Du, K. H. Luo, S. Succi, M. Lauricella, A. Montessori and Q. Wang, Phys. Fluids, 2019, 31, 042105 CrossRef.
- Q. Li, D. H. Du, L. Fei and K. H. Luo, Comput. Fluids, 2019, 186, 128–140 CrossRef.
- P. Chantelot, A. M. Moqaddam, A. Gauthier, S. S. Chikatamarla, C. Clanet, I. V. Karlin and D. Quéré, Soft Matter, 2018, 14, 2227–2233 RSC.
- L. Wang, W. Zhao and X.-D. Wang, Phys. Rev. E, 2018, 98, 033308 CrossRef CAS.
- S. Tao, Z. Guo and L.-P. Wang, Powder Technol., 2017, 315, 126–138 CrossRef CAS.
- T. Lei, K. H. Luo and D. Wu, Phys. Rev. E, 2019, 99, 053301 CrossRef.
- A. Montessori, M. Lauricella, A. Tiribocchi and S. Succi, Phys. Rev. Fluids, 2019, 4, 072201 CrossRef.
- F. Higuera, S. Succi and R. Benzi, EPL, 1989, 9, 345 CrossRef.
- F. J. Higuera and J. Jimenez, EPL, 1989, 9, 663 CrossRef.
- Y. Qian, D. d'Humières and P. Lallemand, EPL, 1992, 17, 479 CrossRef.
- R. Benzi, S. Succi and M. Vergassola, Phys. Rep., 1992, 222, 145–197 CrossRef.
- X. Shan and H. Chen, Phys. Rev. E: Stat. Phys., Plasmas, Fluids, Relat. Interdiscip. Top., 1993, 47, 1815 CrossRef PubMed.
- R. Benzi, S. Chibbaro and S. Succi, Phys. Rev. Lett., 2009, 102, 026002 CrossRef.
- X. Shan and H. Chen, Phys. Rev. E: Stat. Phys., Plasmas, Fluids, Relat. Interdiscip. Top., 1994, 49, 2941 CrossRef CAS.
- M. Sbragaglia, R. Benzi, M. Bernaschi and S. Succi, Soft Matter, 2012, 8, 10773–10782 RSC.
- A. Scagliarini, B. Dollet and M. Sbragaglia, Colloids Surf., A, 2015, 473, 133–140 CrossRef CAS.
- V. Bergeron, J. Phys.: Condens. Matter, 1999, 11, R215 CrossRef CAS.
- X. Shan, Phys. Rev. E: Stat., Nonlinear, Soft Matter Phys., 2008, 77, 066702 CrossRef.
- T. J. Spencer, I. Halliday and C. M. Care, Philos. Trans. R. Soc., A, 2011, 369, 2255–2263 CrossRef PubMed.
- T. G. Mason, J. Bibette and D. A. Weitz, Phys. Rev. Lett., 1995, 75, 2051 CrossRef CAS PubMed.
- T. Mason, J. Bibette and D. Weitz, J. Colloid Interface Sci., 1996, 179, 439–448 CrossRef CAS.
- H. Zhou and C. Pozrikidis, Phys. Fluids, 1994, 6, 80–94 CrossRef CAS.
- H. Princen, J. Colloid Interface Sci., 1983, 91, 160–175 CrossRef CAS.
- T. Podgorski, J.-M. Flesselles and L. Limat, Phys. Rev. Lett., 2001, 87, 036102 CrossRef CAS.
- H.-Y. Kim, H. J. Lee and B. H. Kang, J. Colloid Interface Sci., 2002, 247, 372–380 CrossRef CAS.
- J. W. Khor, N. Jean, E. S. Luxenberg, S. Ermon and S. K. Y. Tang, Soft Matter, 2019, 15, 1361–1372 RSC.
- S. Anna, N. Bontoux and H. Stone, Appl. Phys. Lett., 2003, 82, 364–366 CrossRef CAS.
- C. A. Conn, K. Ma, G. J. Hirasaki and S. L. Biswal, Lab Chip, 2014, 14, 3968–3977 RSC.
Footnote |
| † Electronic supplementary information (ESI) available: Movies S1–S4. See DOI: 10.1039/c9sm02331c |
| This journal is © The Royal Society of Chemistry 2020 |


