 Open Access Article
Coupled water, charge and salt transport in heterogeneous nano-fluidic systems†
Ben L.
Werkhoven
 * and
René
van Roij

Institute for Theoretical Physics, Center for Extreme Matter and Emergent Phenomena, Utrecht University, Princetonplein 5, Utrecht, 3584 CC, The Netherlands. E-mail: ben_werkhoven@hotmail.com
First published on 6th January 2020
Abstract
We theoretically study the electrokinetic transport properties of nano-fluidic devices under the influence of a pressure, voltage or salinity gradient. On a microscopic level the behaviour of the device is quantified by the Onsager matrix L, a generalised conductivity matrix relating the local driving forces and the induced volume, charge and salt flux. Extending L from a local to a global linear-response relation is trivial for homogeneous electrokinetic systems, but in this manuscript we derive a generalised conductivity matrix G from L that applies also to heterogeneous electrokinetic systems. This extension is especially important in the case of an imposed salinity gradient, which gives necessarily rise to heterogeneous devices. Within this formalism we can also incorporate a heterogeneous surface charge due to, for instance, a charge regulating boundary condition, which we show to have a significant impact on the resulting fluxes. The predictions of the Poisson–Nernst–Planck–Stokes theory show good agreement with exact solutions of the governing equations determined using the finite element method under a wide variety of parameters. Having established the validity of the theory, it provides an accessible method to analyse electrokinetic systems in general without the need of extensive numerical methods. As an example, we analyse a reverse electrodialysis “blue energy” system, and analyse how the many parameters that characterise such a system affect the generated electrical power and efficiency.
1 Introduction
Over the past decades, the interest in nano- and microfluidics devices has significantly increased as these systems are able to control the transport of fluid, and thus dissolved solutes, with microscopic precision. The small scale of nanofluidic devices leads to novel properties compared to macrofluidic devices, allowing applications to a wide variety of different research fields.1,2 The great potential of such devices is additionally attested by biological systems, which show an amazing control over permeability and selectivity of nanochannels.2–5The unique properties of nano-fluidic devices derive ultimately from the relatively large surface to volume ratio. These properties make the field of nanofluidics of great importance for transport in porous materials such as porous rocks6 and membranes.7 Additionally, nano-fluidic devices offer new promising roads to desalination,8 DNA translocation9–11 and renewable energy harvesting.12,13 For instance, they have been used to convert hydrostatic energy into electric power14,15 and to harvest energy from mixing salt and fresh water by reverse electrodialysis (RED),16,17 pressure retarded osmosis (PRO)18–20 or capacitive double layer expansion (CDLE).21 All of these nanofluidic devices are based on essentially the same system, composed of a channel with charged walls connecting two reservoirs with different reservoir conditions. Recent advances highlight the great potential for nanofluidics of carbon nanotubes (CNT),22 boron nitride nanotubes (BNNT)23 and MoS2 nanopores,24 which exhibit unique properties due to their small size and favourable electric properties.
2 Transport in electrokinetic systems
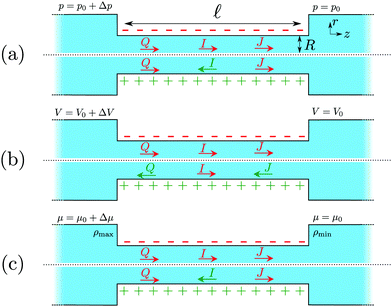
Fig. 1 shows a representation of a typical electrokinetic system we will consider in this article: a cylindrical channel with a charged surface of length![[small script l]](https://www.rsc.org/images/entities/char_e146.gif) and radius R connecting two bulk reservoirs containing a 1
and radius R connecting two bulk reservoirs containing a 1![[thin space (1/6-em)]](https://www.rsc.org/images/entities/char_2009.gif) :
:![[thin space (1/6-em)]](https://www.rsc.org/images/entities/char_2009.gif) 1 electrolyte at room temperature. In this article we consider three different driving forces for transport, a pressure drop Δp, a voltage drop ΔV (electro-osmosis) and a salt chemical potential drop Δμ (i.e. a salt concentration drop Δρ, diffusio-osmosis) over the channel. These driving forces can induce three different fluxes, i.e. currents integrated over a cross section: a volume or water flux Q (m3 s−1), more commonly known as the volumetric flow rate, a charge flux or electric current I (A) and a net salt flux J (s−1).
1 electrolyte at room temperature. In this article we consider three different driving forces for transport, a pressure drop Δp, a voltage drop ΔV (electro-osmosis) and a salt chemical potential drop Δμ (i.e. a salt concentration drop Δρ, diffusio-osmosis) over the channel. These driving forces can induce three different fluxes, i.e. currents integrated over a cross section: a volume or water flux Q (m3 s−1), more commonly known as the volumetric flow rate, a charge flux or electric current I (A) and a net salt flux J (s−1).
Within linear response, we quantify the relation between the driving forces, Δp, ΔV and Δμ, and generated fluxes, Q, I and J, by a conductivity matrix G,
 | (1) |
 | (2) |
Alternatively, it is also possible to impose the flux instead of the applied potentials. For example, in an electric open-circuit channel the two reservoirs are not electrically connected and therefore no electric current can flow in steady state. In this case the flux I = 0 is imposed instead of the potential drop, but then too eqn (1) can be used. Since Δμ directly generates the current IDO given by eqn (2), the only way to obtain a vanishing I is for the system to develop a potential drop over the channel, commonly referred to as the diffusion potential ΔVdif2, such that the induced electro-osmotic current  exactly cancels the diffusio-osmotic current IDO. The total current is simply the sum of the separate contributions, Itotal = IDO(Δμ) + IEO(ΔVdif) = 0, and we find
 | (3) |
In this article, we will show how we can obtain the conductivity matrix G from a well-known microscopic linear response theory based by the Onsager matrix L, which we will calculate analytically within the Poisson–Boltzmann formalism. We then show how to extend L, which is in essence a local linear-response equation, to G, which is a global linear-response equation. In order to validate our method, we compare predictions of eqn (1) with solutions of the Poisson–Nernst–Planck–Stokes equations obtained using finite element method (FEM). While FEM results are typically more precise, the great advantage of the proposed method is that these are much easier to implement and do not require complicated numerical techniques, and can thus be more easily used to analyse more complex nanofluidic systems. As an example, we will use the generalised conductivity matrix G to show how to incorporate a charge regulation mechanism with a salinity gradient, and compare predictions of the generated current with experiments on boron nitride nanotubes.23 The proposed framework provides a general formalism to investigate all electrokinetic systems as listed in Table 1, but as an example we will use G to analyse an electrokinetic system using reverse electrodyalisis under a wide variety of parameters without the need for extensive numerical calculations with FEM. This analysis highlights the convenience and utility of the conductivity matrix G for nanofluidics and electrokinetic systems in general.
| Boundary conditions | System |
|---|---|
| Δμ = 0, Δp = 0, ΔV ≠ 0 | Electro-osmosis |
| Δμ = 0, Δp ≠ 0, I = 0 | Streaming potential |
| Δμ ≠ 0, Δp = 0, I = 0 | Membranes/diffusio-osmosis |
| Δμ ≠ 0, Δp ≠ 0, I = 0 | Pressure retarded osmosis & desalination |
| Δμ = 0, Δp ≠ 0, I ≠ 0 | Mechanical energy conversion |
| Δμ ≠ 0, Δp = 0, I ≠ 0 | Reverse electrodyalisis |
| Δμ = 0, Q = 0, ΔV ≠ 0 | Capacitive double layer expansion |
3 The conductivity matrix
A well-known method to describe the transport properties of nano-fluidic channels is by the so-called Onsager matrix L,25–28 which relates the local driving forces to the generated fluxes. Within linear response theory, the induced fluxes are linear in the driving forces | (4) |
The disadvantage of eqn (4), however, is that it relates the local driving forces to the fluxes, while eqn (1) relates the global driving forces to the fluxes. Since the global rather than the local driving forces are experimentally imposed or measured, in order for eqn (4) to be useful it must be extended to the same form as eqn (1). This is straightforward if L is constant throughout the channel, since then we can simply integrate eqn (4) along the length of the channel and find that L = G. This is the case when a non-zero Δp and ΔV is imposed, since only under extreme circumstances do these influence the properties of the channel. However, since the properties of the electric double layer are strongly affected by the salinity ρs, a non-zero Δμ necessarily leads to a laterally varying salinity ρs and thus a laterally varying L. In that case, therefore, it is no longer clear how to convert eqn (4) to a global equation, except in the case of a small relative change in salinity across the channel. If, however, the salinity changes for example from 20 mM to 500 mM, as is the case for fresh to sea water, a clear method is required to obtain the fluxes from L.
3.1 Global linear response
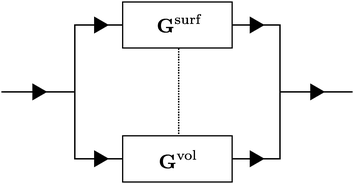
One method to obtain the fluxes as a function of the global driving forces as in eqn (1), is to resolve eqn (4) for every location z for a given value of the flux. Such adjustments have been successfully incorporated before,27,28 but since the local driving forces are in principle unknown, this method gives the driving force as a function of the flux instead of the global driving forces as eqn (1). Since the latter is clearly preferable, this method becomes rather cumbersome. Here we show how to extend L to G, while retaining the convenience of eqn (1).In order to obtain G from a heterogeneous L(z) we start from the condition that all fluxes Q, I and J are, in steady state and for non-leaky channels, constant throughout the channel (independent of z). In order to calculate the fluxes as a function of the global driving forces, we divide the system into infinitesimally small segments of width dz, schematically represented in Fig. 2, and apply the Onsager equation, eqn (4), for each segment
 | (5) |
 and d
and d![[F with combining right harpoon above (vector)]](https://www.rsc.org/images/entities/i_char_0046_20d1.gif) i/dz = (∂zp, ∂zV, ∂zμ)|z=zi is a vector that contains all fluxes and driving forces over the ith segment, respectively. Since Q, I and J are defined by integrals over a cross section (see below, eqn (21)), there are no contributions to J from (possibly induced) radial forces ∂rp, ∂rV and ∂rμ to
i/dz = (∂zp, ∂zV, ∂zμ)|z=zi is a vector that contains all fluxes and driving forces over the ith segment, respectively. Since Q, I and J are defined by integrals over a cross section (see below, eqn (21)), there are no contributions to J from (possibly induced) radial forces ∂rp, ∂rV and ∂rμ to  .29 Furthermore, Ladv is the bulk advective salt flux, which accounts for the difference between J and Jexc,
 | (6) |
 can not depend on z (Jexc can in principle depend on z). We can obtain the global driving forces by summing (integrating in the continuum limit) all d
![[F with combining right harpoon above (vector)]](https://www.rsc.org/images/entities/i_char_0046_20d1.gif) i,
i, | (7) |
![[F with combining right harpoon above (vector)]](https://www.rsc.org/images/entities/i_char_0046_20d1.gif) = (Δp, ΔV, Δμ) is the vector containing all global driving forces. Inverting this equation we obtain the (constant) fluxes
= (Δp, ΔV, Δμ) is the vector containing all global driving forces. Inverting this equation we obtain the (constant) fluxes  as a function of the global driving forces Δ
![[F with combining right harpoon above (vector)]](https://www.rsc.org/images/entities/i_char_0046_20d1.gif) ,
, | (8) |
 | (9) |
As stated before, the Onsager matrix L can be determined analytically within Poisson–Boltzmann theory, and we can subsequently use eqn (9) to find the conductivity matrix G.
However, we can significantly simplify eqn (9) by splitting the contributions to L in a volume (Lvol) and a surface (Lsurf) contribution,
| L = Lvol + Lsurf, | (10) |
In principle, the induced fluxes Q, I and J can flow via the EDL, represented by Gsurf or via the region outside the EDL, represented by Gvol (each a sequence of many infinitesimally small conductors as in Fig. 2). These two are, in general, connected, represented by the dashed line (to be precise, every infinitesimal conductor is connected to its volume/surface counterpart). We can, however, significantly simplify the system by disconnecting the surface and volume fluxes (i.e. removing the dashed line in Fig. 3), which can intuitively be understood by realising that all radial components of the fluxes are small or negligible (such that the interchange between volume and surface is also small). We expect this simplification to break down for small aspect ratios ![[small script l]](https://www.rsc.org/images/entities/char_e146.gif) /R and/or large heterogeneities across the channel.
/R and/or large heterogeneities across the channel.
The advantage of separating the volume and surface contributions is that the total conductance is now determined by the sum of the two separate conductances (note that Gvol and Gsurf themselves can still originate from a laterally heterogeneous Lvol and Lsurf respectively). We can analytically calculate Gvol, by evaluating eqn (9) with Lsurf = 0 (see Section B, ESI,† for a derivation). On the other hand, it is not possible to determine Gsurf analytically in the same way as Gvol. In order to obtain an analytic expression we approximate Gsurf by Lsurf evaluated at the average salinity  ,
,
 | (11) |
 , but we found the arithmetic mean to provide (slightly) more accurate predictions compared to the FEM results. The total conductivity matrix G can then be approximated as
G ≈ Gvol + Gsurf ≈ Gvol + Lsurf(ρs = ![[small rho, Greek, macron]](https://www.rsc.org/images/entities/i_char_e0d1.gif) ), ), | (12) |
One significant advantage of the above formalism is that it is straightforward to also incorporate lateral heterogeneities other than a salinity gradient. For example, we will consider BNNTs and CNTs in this article, which obtain their surface charge from the adsorption of an OH− ion. Because OH− carries a net charge, the amount of OH− adsorption depends on the surface charge itself via a mechanism known as charge regulation,30–32 and can be expressed as a Langmuir-type relation
| σ(z) = zσΓ(1 + 10−pH+pKe−eψ0(z)/kBT)−1, | (13) |
3.2 Entrance effect
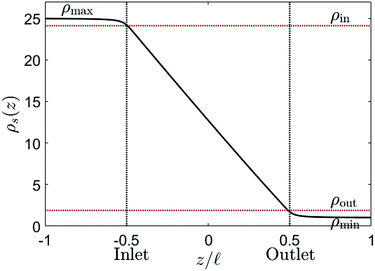
One final point to address concerning G is that a density profile ρs(z) is required in order to use eqn (9). A straightforward example is of course a purely diffusive (i.e. linear) profile, although one should keep in mind that this is not necessarily accurate because the profile can be influenced by an advective fluid flow or an electric field.35 The density profile in a finite channel is, however, also affected by entrance effects. Due to the finite size of the channel, the salinity at the in- and outlet of the channel is not exactly equal to reservoir salinities ρmax and ρmin. However, the salinity gradients in the far field of the reservoirs vanish, resulting in a region at the in- and outlet, outside the channel, with a salinity different from ρmax and ρmin. This is confirmed by FEM calculations, which show that the salinity at the inlet is lower than ρmax, and the salinity at the outlet is higher than ρmin (see Fig. 4). The corrections are not large, but one must keep in mind that the conductivity of the channel is, according to eqn (9), most strongly affected by the smallest conductivity, i.e. the low salinity side. A small correction at the outlet can thus have significant effects on the total conductivity.
Fig. 4 shows the salinity at the channel axis as determined from FEM solutions of the PNPS equations. Even for a very needle-shaped channel (![[small script l]](https://www.rsc.org/images/entities/char_e146.gif) /R = 25), the in- and outlet salinities clearly differ from the reservoir salinities. The effect becomes more pronounced for shorter and/or wider channels with a small aspect ratio. For example, for
/R = 25), the in- and outlet salinities clearly differ from the reservoir salinities. The effect becomes more pronounced for shorter and/or wider channels with a small aspect ratio. For example, for ![[small script l]](https://www.rsc.org/images/entities/char_e146.gif) /R = 5 the outlet salinity is a factor 4 larger than ρmin (see Section C, ESI†). We denote the inlet salinity as ρin and the outlet salinity as ρout, which now explicitly depend on R and
/R = 5 the outlet salinity is a factor 4 larger than ρmin (see Section C, ESI†). We denote the inlet salinity as ρin and the outlet salinity as ρout, which now explicitly depend on R and ![[small script l]](https://www.rsc.org/images/entities/char_e146.gif) due to the entrance effects (see Section C, ESI† for derivation). This correction is similar (although not equal) to the so-called access resistance,10 as it also slightly adjusts the salinity gradient. The chemical potential drop over the channel Δμch is consequently not equal to the chemical potential difference
due to the entrance effects (see Section C, ESI† for derivation). This correction is similar (although not equal) to the so-called access resistance,10 as it also slightly adjusts the salinity gradient. The chemical potential drop over the channel Δμch is consequently not equal to the chemical potential difference  between the two reservoirs, but actually
 | (14) |
In this article we (generally) assume a linear profile
 | (15) |
 , where the in- and outlet salinities are given by (see Section C, ESI,† for derivation)
 | (16) |
![[small script l]](https://www.rsc.org/images/entities/char_e146.gif) in the formalism via ρin and ρout, as has indeed been shown to be a non-trivial parameter for diffusio-osmosis.36 Only for infinitely long channels do we find that ρin = ρmax and ρout = ρmin. In general, a salinity profile will be affected by the fluid flow and can be found by solving the convection–diffusion equation. However, the resulting exponential profile reduces to a linear profile if the fluid flow is not too large, more precisely if the Peclet number Pe =
in the formalism via ρin and ρout, as has indeed been shown to be a non-trivial parameter for diffusio-osmosis.36 Only for infinitely long channels do we find that ρin = ρmax and ρout = ρmin. In general, a salinity profile will be affected by the fluid flow and can be found by solving the convection–diffusion equation. However, the resulting exponential profile reduces to a linear profile if the fluid flow is not too large, more precisely if the Peclet number Pe =  is significantly smaller than unity. This is typically the case for diffusio-osmosis, except for very large slip lengths (exceeding tens of nanometers). In that case, the salinity profile must be adjusted to a profile predicted by a diffusion–convection system.
3.3 The Onsager matrix
So far we have explained how to extend the local linear response Onsager matrix L to a global linear response conductivity matrix G. As mentioned, L originates partially from the surface charge of the channels walls, which can be either imposed or spontaneously originate from chemi- or physisorption of ions. This surface charge attracts oppositely charged ions to, and repels equally charged ions from, the surface, giving rise to a non-zero space charge close to the surface called the electric double layer (EDL). The EDL consists of charge and concentration gradients perpendicular to the surface which extend into the fluid over a typical distance of the Debye length λD, and therefore affects the fluxes parallel to the surface. We assume here that the EDL is in its equilibrium configuration before the driving forces are applied, since the EDL equilibrates typically on a timescale of the order of nano- to microseconds.37 This allows us to use the solutions of Poisson–Boltzmann formalism to derive L.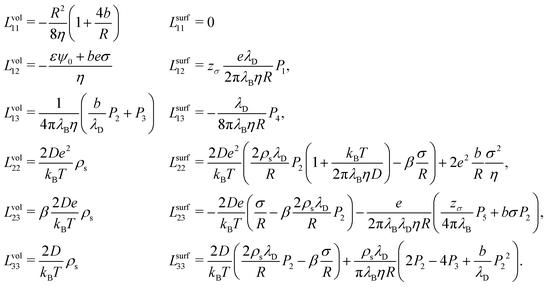 | (17) |
In this article we will consider an electrokinetic system as depicted in Fig. 1, with length ![[small script l]](https://www.rsc.org/images/entities/char_e146.gif) , radius R, salinity ρs(z) given by eqn (15) and surface charge σ. The fluid flow is determined by the Stokes equation with an electric body force and the incompressibility condition,32
, radius R, salinity ρs(z) given by eqn (15) and surface charge σ. The fluid flow is determined by the Stokes equation with an electric body force and the incompressibility condition,32
| −∇p + η∇2u + e(ρ+ − ρ−)E = 0, ∇·u = 0, | (18) |
| −b∂ruz(r = R) = uz(r = R), | (19) |
 | (20) |
![[thin space (1/6-em)]](https://www.rsc.org/images/entities/char_2009.gif) :
:![[thin space (1/6-em)]](https://www.rsc.org/images/entities/char_2009.gif) 1 salt, as this makes it possible to solve all equations analytically (although these are straightforwardly extended to a z
1 salt, as this makes it possible to solve all equations analytically (although these are straightforwardly extended to a z![[thin space (1/6-em)]](https://www.rsc.org/images/entities/char_2009.gif) :
:![[thin space (1/6-em)]](https://www.rsc.org/images/entities/char_2009.gif) z salt). We obtain the fluxes as
z salt). We obtain the fluxes as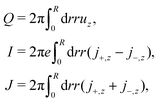 | (21) |
By combining the above equations with the solutions of Poisson–Boltzmann formalism for a 1![[thin space (1/6-em)]](https://www.rsc.org/images/entities/char_2009.gif) :
:![[thin space (1/6-em)]](https://www.rsc.org/images/entities/char_2009.gif) 1 salt,2,38 the full 3 × 3 Onsager matrix can be determined analytically. The majority of the matrix elements of L are already known, although we do find a contribution to Lsurf23, the non-advective contributions of eqn (17), that appears to have been overlooked in previous studies.23,39 It is an important contribution that cannot be ignored, and is in fact required by the symmetry of L. This term is intimately linked to the heterogeneity of the EDL: since the Debye length λD is a function of z, diffusio-osmosis generates a lateral component to the electric field which contributes to the generated fluxes (see Section G.8, ESI,† for detailed discussion of this subtle contribution). For the sake of completeness, however, we present not just L32 but the full 3 × 3 matrix.
1 salt,2,38 the full 3 × 3 Onsager matrix can be determined analytically. The majority of the matrix elements of L are already known, although we do find a contribution to Lsurf23, the non-advective contributions of eqn (17), that appears to have been overlooked in previous studies.23,39 It is an important contribution that cannot be ignored, and is in fact required by the symmetry of L. This term is intimately linked to the heterogeneity of the EDL: since the Debye length λD is a function of z, diffusio-osmosis generates a lateral component to the electric field which contributes to the generated fluxes (see Section G.8, ESI,† for detailed discussion of this subtle contribution). For the sake of completeness, however, we present not just L32 but the full 3 × 3 matrix.
Eqn (17) shows the Onsager matrix elements, with  the Bjerrum length and λD = (8πλBρs)−1 the Debye length, ε the permittivity of water, ψ0 the surface potential, zσ the sign of the surface charge,
  the average ion diffusion constant and
  the mobility mismatch. The constants Pi are positive numbers and function of ρs, σ and ψ0 only. For small surface charge, 2πλBλDσ ≪ 1, all these constants scale as Pi ∼ σ2 ∼ ϕ02, while for large surface charge, 2πλBλDσ ≫ 1, P1 ≈ π2/2, P2 ∼ σ, P3 ∼ |ϕ0|, P4 ≈ π2/4 and P5 ∼ σ. These constants are solutions to rather involved integrals, and the full expressions and their derivations can be found in Section D, ESI.† Note that Lvol12 and Lvol23 change sign if σ changes sign, while Lvol13 does not. This is directly reflected in Fig. 1, which shows that Q and J are always in the same direction while the direction of I with respect to Q and J depends on the sign of σ.
Most elements are known by specific names, for example in the context of electro-osmosis32 and diffusion-phoresis;40L11 is inversely proportional to the fluidic impedance  , L12 is proportional the streaming conductance
  , L13 is proportional to the diffusio-osmotic mobility DDO = kBTL13, L22 is the electric conductivity of the channel and L23 the diffusio-osmotic conductivity. Since we use the full nonlinear Poisson–Boltzmann equation for non- or weakly-overlapping EDLs to determine L, we expect eqn (17) to break down for salinities exceeding approximately 100 mM, when finite-size effect become significant, or for multivalent ions. Moreover, for strongly overlapping EDLs both the solution to the Poisson–Boltzmann equations, and consequently the Onsager matrix eqn (17), as well as the entrance effects, eqn (16), must be adjusted, for example using the thin-pore limit.41
Even though the formalism presented in this article still applies for strongly overlapping EDLs, the expressions for the Onsager matrix are modified in this regime and as a consequence a full analysis strongly overlapping EDLs is outside the scope of this article. We note, however, that eqn (17) shows excellent agreement for R ≈ 3λD (see Section E, ESI†), but breaks down for R ≈ 2λD with λD the Debye length associated to ρmin.
4 Validation conductivity matrix
Now that we have set up a formalism to extend the microscopic theory, represented by L, to the global electrokinetic properties, represented by G, we can compare the predictions of eqn (9) and (12) with the FEM solutions of the Nernst–Planck eqn (18)–(20) calculated using COMSOL Multiphysics, in order to validate the applicability of Gviaeqn (9) and (12). Here we will only focus on the diffusio-osmosis, as this inevitably includes significant lateral heterogeneities, for both a short-circuit and an open-circuit system as discussed above (eqn (2) and (3)).
Fig. 5 shows the dependence of the average fluid velocity ū = Q/(πR2), electric current I and salt flux J on ρmax/ρmin ∈ [1,100], with ρmin = 1 mM, for NaCl from the FEM calculations compared to the predictions of eqn (12) (blue) and eqn (9) (black), both for a short-circuit (a–c) and an open-circuit (d–f) system, for a charge regulation boundary condition with σ(ρs = 1 mM) = −0.05 e nm−2 (eqn (13) with pH–pK = 0.05), b = 0 nm, R = 60 nm, ![[small script l]](https://www.rsc.org/images/entities/char_e146.gif) = 1.5 μm, ρmin = 1 mM, DNa = 1.33 × 10⁻⁹ m2 s−1 and DCl = 2.03 × 10⁻⁹ m2 s−1 (β = −0.21). Fig. 5 shows that eqn (9) is very accurate in reproducing the FEM results. In all cases, eqn (12) is less accurate than eqn (9) but often surprisingly accurate given its simplifications, especially if ρmax/ρmin ≲ 10 in both short-circuit and open-circuit conditions. The agreement in the open-circuit case thus shows that, even if there are multiple driving forces (i.e. both ΔV ≠ 0 and Δμ ≠ 0) the formalism remains accurate. We have furthermore compared the predictions and the FEM calculations for a non-zero slip length (b = 10 nm), smaller radius (R = 40 nm), higher surface charge (σ = −0.1 e nm−2), smaller channel length (
= 1.5 μm, ρmin = 1 mM, DNa = 1.33 × 10⁻⁹ m2 s−1 and DCl = 2.03 × 10⁻⁹ m2 s−1 (β = −0.21). Fig. 5 shows that eqn (9) is very accurate in reproducing the FEM results. In all cases, eqn (12) is less accurate than eqn (9) but often surprisingly accurate given its simplifications, especially if ρmax/ρmin ≲ 10 in both short-circuit and open-circuit conditions. The agreement in the open-circuit case thus shows that, even if there are multiple driving forces (i.e. both ΔV ≠ 0 and Δμ ≠ 0) the formalism remains accurate. We have furthermore compared the predictions and the FEM calculations for a non-zero slip length (b = 10 nm), smaller radius (R = 40 nm), higher surface charge (σ = −0.1 e nm−2), smaller channel length (![[small script l]](https://www.rsc.org/images/entities/char_e146.gif) = 375 nm) and higher minimum salinity (ρmin = 20 mM) and found good agreement for all parameter variations (see Section E, ESI†). In addition, Fig. 5(d) shows that in an open-circuit system ΔVdif changes sign for large Δμ since IDO changes sign in the short-circuit case (IDO changes sign due to the competition between Lsurf23 and Lvol23). Moreover, Fig. 5(e) shows that the fluid flow first decreases, than increases and even changes sign with increasing ρmax/ρmin. This is the result of an intricate balance between diffusio-osmosis due to Δμ and electro-osmosis due to ΔVdif. The balance between the diffusio-osmotic and electro-osmotic driving forces depends strongly on β, and is thus very different for KCl (β = 0) than for NaCl (β = −0.21), and additionally depends on zσ. Both of these behaviours are in agreement with experimental observations and interpretations.10,42
= 375 nm) and higher minimum salinity (ρmin = 20 mM) and found good agreement for all parameter variations (see Section E, ESI†). In addition, Fig. 5(d) shows that in an open-circuit system ΔVdif changes sign for large Δμ since IDO changes sign in the short-circuit case (IDO changes sign due to the competition between Lsurf23 and Lvol23). Moreover, Fig. 5(e) shows that the fluid flow first decreases, than increases and even changes sign with increasing ρmax/ρmin. This is the result of an intricate balance between diffusio-osmosis due to Δμ and electro-osmosis due to ΔVdif. The balance between the diffusio-osmotic and electro-osmotic driving forces depends strongly on β, and is thus very different for KCl (β = 0) than for NaCl (β = −0.21), and additionally depends on zσ. Both of these behaviours are in agreement with experimental observations and interpretations.10,42
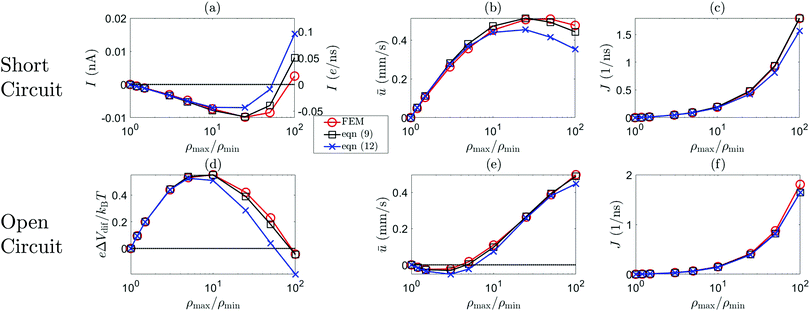 | ||
Fig. 5 The short-circuit electric current I, open-circuit potential ΔVdif, average fluid velocity  and salt flux J as a function of ρmax/ρmin. The red line represents the FEM results, the blue line the prediction of (12) and the black line (9) for σ(ρs = 1 mM) = −0.05 e nm−2 ((13)), R = 60 nm, b = 0, β = −0.21 (NaCl) and ρmin = 1 mM for short-circuited (a–c) and open-circuit (d–f) system. and salt flux J as a function of ρmax/ρmin. The red line represents the FEM results, the blue line the prediction of (12) and the black line (9) for σ(ρs = 1 mM) = −0.05 e nm−2 ((13)), R = 60 nm, b = 0, β = −0.21 (NaCl) and ρmin = 1 mM for short-circuited (a–c) and open-circuit (d–f) system. | ||
Recent experimental advances allow for direct comparison between theory and experiments for these kind of systems. For instance, measurements on osmotic power generation using a single boron nitride nanotubes (BNNT), carbon nanotubes (CNT) and MoS2 nanopores, have been shown to surpass older RED technologies based on much thicker membranes.43 With the theory presented here, we can directly compare with recent experiments. Fig. 6 shows the (short-circuit) diffusio-osmotic current IDO, for both a constant charge and a charge regulating boundary condition eqn (13), as a function of the salinity ratio ρmax/ρmin for a nanochannel with ρmin = 1 mM, σ(ρs = 1 mM) = −0.25 e nm−2, R = 40 nm, b = 3 nm and ![[small script l]](https://www.rsc.org/images/entities/char_e146.gif) = 1250 nm, which can be directly compared to the diffusio-osmotic current measurements on BNNT by Siria et al.23 Here, σ(ρs = 1 mM) was chosen such that similar IDO values were obtained. First of all, it is evident from Fig. 6 that, especially for large ρmax/ρmin, the charge regulation boundary condition has a significant effect on the predicted electric current. A charge regulation boundary condition (eqn (13)) and the small slip length b = 3 nm of BNNTs44 are sufficient to obtain very similar values for IDO (order 0.1 to 1 nA), but with a surface charge more than an order of magnitude smaller than estimated by Siria et al.23 Note that the contribution from the slip length, which, for large σ, scales with σ2 (see eqn (17) and associated text), becomes increasingly dominant for increasing σ. Even a relatively small slip length of b = 3 nm can therefore significantly affect the predicted fluxes. Note furthermore that σ varies significantly as a function of the channel position z, see inset Fig. 6, which explains why the charge regulation boundary condition gives a larger IDO compared to the constant charge boundary condition, and furthermore emphasises the importance of even a small but finite b.
= 1250 nm, which can be directly compared to the diffusio-osmotic current measurements on BNNT by Siria et al.23 Here, σ(ρs = 1 mM) was chosen such that similar IDO values were obtained. First of all, it is evident from Fig. 6 that, especially for large ρmax/ρmin, the charge regulation boundary condition has a significant effect on the predicted electric current. A charge regulation boundary condition (eqn (13)) and the small slip length b = 3 nm of BNNTs44 are sufficient to obtain very similar values for IDO (order 0.1 to 1 nA), but with a surface charge more than an order of magnitude smaller than estimated by Siria et al.23 Note that the contribution from the slip length, which, for large σ, scales with σ2 (see eqn (17) and associated text), becomes increasingly dominant for increasing σ. Even a relatively small slip length of b = 3 nm can therefore significantly affect the predicted fluxes. Note furthermore that σ varies significantly as a function of the channel position z, see inset Fig. 6, which explains why the charge regulation boundary condition gives a larger IDO compared to the constant charge boundary condition, and furthermore emphasises the importance of even a small but finite b.
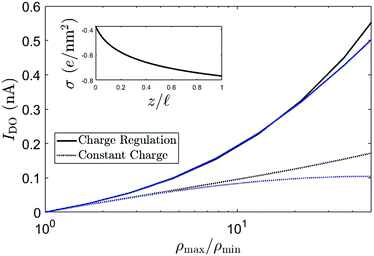 | ||
Fig. 6 The diffusio-osmotic current IDO for KCl as a function of the salinity drop over the channel according to eqn (12) (blue) and eqn (9) (black) for both a constant charge (CC, dashed) and charge regulation (CR, full) boundary condition. For both CC and CR, σ(ρs = 1 mM) = −0.25 e nm−2, ρmin = 1 mM, R = 40 nm, b = 3 nm and ![[small script l]](https://www.rsc.org/images/entities/char_e146.gif) = 1250 nm. The inset shows the surface charge as a function of the lateral position z. = 1250 nm. The inset shows the surface charge as a function of the lateral position z. | ||
The surface charge σ(ρs = 1 mM) = −0.25 e nm−2 is much smaller that the value obtained from conductivity measurements on BNNT by Siria et al.23 It has recently been shown, however, that the adsorbed OH− contributes significantly to the conductivity and other properties of the channel.45 Conduction via the Stern layer is not included in the current model, but an increased conduction will probably only lower the predicted surface charge even more. We have recently developed models for mobile surface charges,46,47 and incorporating these in the current theory is subject of future research.
5 Reverse electrodialysis
Having established the accuracy of the theoretical framework of deriving G from L, we can use the derived equations to analyse the wide variety of different electrokinetic systems (Table 1) without the need for full FEM calculations (or other extensive numerical analyses) for each system separately. All electrokinetic systems are essentially described by G, the only difference being the boundary conditions. As an example, we will use the conductivity matrix G to analyse a single channel using reverse electrodialysis (RED), which are essentially intermediate between a short-circuit and open-circuit system.The electrokinetic RED system, schematically represented in Fig. 7, is embedded in an electric circuit and thus allows a non-zero current I = IRED to flow through the system. However, the circuit also contains an (Ohmic) resistance Rload that harvests the electric energy, which requires a potential drop ΔV in order for a non-zero current to flow. Assuming that Rload can be chosen freely, we will assume that Rload is chosen such that the generated electric power is optimised (as opposed to the energy conversion efficiency). It is straightforward to show that the generated power is maximised when Rload equals the resistance of the channel  ,10,17 which fixes the current to half the short-circuit current eqn (2),
 | (22) |
 | (23) |
![[scr P, script letter P]](https://www.rsc.org/images/entities/char_e52f.gif) RED is the generated electric power. Eqn (23) shows that the power density is inversely proportional to the length
RED is the generated electric power. Eqn (23) shows that the power density is inversely proportional to the length ![[small script l]](https://www.rsc.org/images/entities/char_e146.gif) , which (partially) explains the potential of nanopores24 compared to nanochannels, let alone microchannels. A smaller length decreases Rch (and Rload is decreased accordingly) but increases the salinity gradient and thus IDO. The energy conversion efficiency can be found by dividing the generated electrical power by the osmotic free energy dissipated by the mixing of the two solutions,27,28
, which (partially) explains the potential of nanopores24 compared to nanochannels, let alone microchannels. A smaller length decreases Rch (and Rload is decreased accordingly) but increases the salinity gradient and thus IDO. The energy conversion efficiency can be found by dividing the generated electrical power by the osmotic free energy dissipated by the mixing of the two solutions,27,28 | (24) |
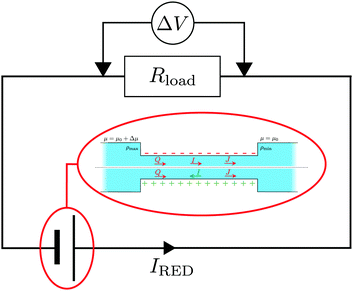 | ||
| Fig. 7 Schematic representation of an RED circuit, where a diffusio-osmotic system is embedded in an electric circuit with a resistance Rload. | ||
On the basis of eqn (23) and (24), we are in the position to use the conductivity matrix G to investigate the effect of system parameters on the RED performance without the need to run intensive FEM or other numerical calculations for each parameter set. As mentioned, two materials have shown great potential for osmotic energy conversion: CNTs and BNNTs. The reason for the success of the former is believed to be related to the small friction of water with the surface, i.e. a large slip length b,44,48–50 while for the latter the large surface charge is believed to be main cause,23 in addition to the large conductivities shown by both.23,34,45,49 For both materials, we assume a charge regulating boundary condition as in eqn (13). There are many parameters to investigate, but here we will focus on 4 main aspects: the surface charge density σ, the slip length b, the minimum salt concentration ρmin and the mobility mismatch β.
As an example we will investigate a nanochannel with R = 40 nm, although it should be kept in mind that for RED a smaller R generally results in a higher PRED and αRED. However, the slip length of CNTs is known to vary with R,50 so a constant R allows us to assume a constant b for this analysis. We will use bBNNT = 3 nm as the slip length for BNNTs44 and bCNT = 30 nm for the slip length of CNTs.44,50
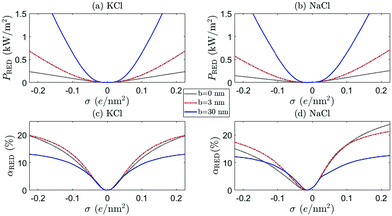
Fig. 8 and 9 show the RED power and efficiency for ρmin = 1 mM and ρmin = 20 mM, respectively, for both KCl (a and c) (β = 0) and NaCl (b and d) (β = −0.21), for b = 0 (black dotted), b = 3 nm (red dot-dashed) and b = 30 nm (blue full) as a function of σ. The horizontal axis represents the surface charge σ at ρs = 1 mM. The surface charge of both BNNT and CNT surfaces originate from an OH− adsorption reaction23,34,45 and strictly only takes negative values. Positive values are included (H+ adsorption), however, for a more complete analysis. There are a few observation we can make from these figures.
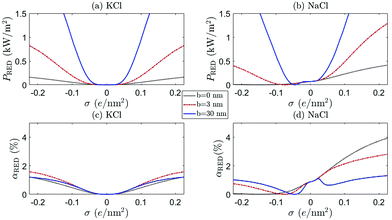 | ||
| Fig. 9 As in caption Fig. 8, but with ρmax = 500 mM and ρmin = 20 mM. | ||
First of all, a comparison of the black (b = 0), red (BNNT, b = 3 nm) and blue (CNT, b = 30 nm) shows that not only a large but also a moderate slip length b has a significant effect on the electrokinetic properties of the system, as was also noted for mechanical energy conversion.51 This confirms that the large slip length of CNTs makes these nanochannels so promising. In addition, Fig. 8 confirms the point emphasised above, that even a small b can have significant effects on the current through the channel, especially for large σ.
Secondly, we see that the predicted power can significantly differ between KCl and NaCl, especially for large ρmin, shown in Fig. 9. Many experiments are performed with KCl, but it is not a priori clear whether these results can be extrapolated to NaCl (the main species of salt for large-scale applications of RED). The difference between these two salts originates from the mobility mismatch, βKCl ≈ 0 and βNaCl ≈ −0.21, which not only affects the resulting fluxes but also breaks the charge inversion symmetry (see eqn (17)). If NaCl is the main constituent of the electrolyte, a positively charged surface is more effective than a negatively charged surface: a negatively charged surface will attract the cations to the surface, but Na+ has a lower mobility than Cl−. The EDL thus has a lower overall mobility if σ < 0 than if σ > 0. This provides a general rule that RED systems generate more power at a higher efficiency if zσβ < 0, because then the ion with the highest mobility is the most abundant in the EDL.
A comparison of Fig. 8 and 9 furthermore emphasises the point that the generated power and efficiency do not purely depend on the concentration ratio (i.e. Δμ), but are both a function of the separate salinities ρmin and ρmax.17 This is especially true for NaCl, for which the broken inversion symmetry is significantly more apparent for ρmin = 20 mM (Fig. 9) than for ρmin = 1 mM (Fig. 8). Especially if b = 0, the difference between the two cases is very pronounced (compare black dotted line Fig. 8(b, d) and 9(b, d)). The dependence on ρmin can be understood by the fact that Lvol23, and consequently G23 and IDO, increase with βρs (see eqn (17)). All slip-length contributions are, however, independent of ρs, and all scale as bσ2 for large σ (see eqn (17)).
We also find that the generated power for ρmin = 20 mM and ρmax = 500 mM is higher than for ρmin = 1 mM and ρmax = 25 mM if b = 0, especially for NaCl with σ > 0. However, the efficiency αRED is nearly an order of magnitude higher for ρmin = 1 mM than for ρmin = 20 mM, even though the chemical potential drop Δμ is the same in both cases. Both can be understood by the increased role played by the volume contributions Lvol of eqn (17). These contributions scale with ρs, so an increased ρmin naturally leads to a larger IDO (if β ≠ 0 via Lvol23) and thus a larger PRED. Similarly, the total salt flux J increases with ρmin (Lvol33 ∝ ρs) which, in turn, decreases αRED (see eqn (24)).
Finally, note that PRED and αRED develop a minimum, with a minimum value of zero, for NaCl with a small negative surface charge. This minimum shifts to larger values of σ if ρmin increases, since this minimum is given by the value of σ for which the volume and surface contributions to I cancel. If we take the surface charge of CNTs at ρs = 1 mM to be σ = −(0.03–0.1) e nm−2,49,50 we even find that CNT are typically not far removed from the minimum observed in Fig. 9. We should note, however, that the location of this minimum depends on systems parameters such as R and b, so this does not mean that CNTs should not be used for RED. It does, on the other hand, stress the important point that β, σ (including its sign) and ρmin are important parameters to keep in mind when optimising a given channel.
Note that our values for PRED are of the same order of magnitude as measurements on BNNTs.23 These values are also consistent with measurements on nanopores,24 where they found PRED three orders of magnitude higher than for micron-thick membranes, with ![[small script l]](https://www.rsc.org/images/entities/char_e146.gif) three orders of magnitude lower. The predictions do certainly depend on the radius R, as RED typically generates more power per unit area and is more efficient for smaller R.17 The present analysis, however, emphasis the point that different systems with differing R, ρmin, σ (including its sign), b and β, are optimised differently. There is of course an immense variety when it comes to nanochannels, but the framework presented in this article provides an accessible method with which these channels can be analysed. Moreover, the framework can be further improved, for example for smaller R, because the most restricting assumption of the Onsager matrix presented in this article, eqn (17), is the assumption of non/weakly-overlapping EDLs, meaning that eqn (17) is viable for R ≳ 12 nm for ρmin > 10 mM. There is no general analytic theory for the matrix elements of L for arbitrary λD/R, but it is possible to take the thin-pore limit (λD ≪ R) of the Poisson–Boltzmann formalism to obtain analytical solutions.41 In addition, the Poisson–Boltzmann formalism typically breaks down for ρs > 100 mM, but there are theories to improve on Poisson–Boltzmann.52,53 Lastly, as already stated, it has been shown that surface conduction plays an important role for BNNTs and CNTs,45 which can further affect the (quantitative) predictions of the theory. This will be the subject of future research.
three orders of magnitude lower. The predictions do certainly depend on the radius R, as RED typically generates more power per unit area and is more efficient for smaller R.17 The present analysis, however, emphasis the point that different systems with differing R, ρmin, σ (including its sign), b and β, are optimised differently. There is of course an immense variety when it comes to nanochannels, but the framework presented in this article provides an accessible method with which these channels can be analysed. Moreover, the framework can be further improved, for example for smaller R, because the most restricting assumption of the Onsager matrix presented in this article, eqn (17), is the assumption of non/weakly-overlapping EDLs, meaning that eqn (17) is viable for R ≳ 12 nm for ρmin > 10 mM. There is no general analytic theory for the matrix elements of L for arbitrary λD/R, but it is possible to take the thin-pore limit (λD ≪ R) of the Poisson–Boltzmann formalism to obtain analytical solutions.41 In addition, the Poisson–Boltzmann formalism typically breaks down for ρs > 100 mM, but there are theories to improve on Poisson–Boltzmann.52,53 Lastly, as already stated, it has been shown that surface conduction plays an important role for BNNTs and CNTs,45 which can further affect the (quantitative) predictions of the theory. This will be the subject of future research.
6 Summary & conclusion
In conclusion, we have presented a method to fully analyse the transport properties of electrokinetic channels driven by a pressure gradient, an electric field or a salinity gradient. We have calculated the full 3 × 3 Onsager matrix L which gives the volumetric flow rate, electric current and salt flux for a given (set of) driving force(s), which to be best of our knowledge was absent in the current literature. This includes an important contribution to the diffusio-osmotic electric current that has so-far been overlooked. We then presented two methods to extend the local linear-response Onsager matrix L to a global linear-response conductivity matrix G, which can incorporate lateral heterogeneities. This furthermore allowed us to include more complex boundary conditions such as charge regulation boundary condition. We compared the predictions of the theory with numerically exact (finite element method) solutions of the Poisson–Nernst–Planck–Stokes equations, which showed the remarkable accuracy of the theory under varying parameters and boundary conditions, in fact even to pore radii as small as three times the electric double layer thickness. Charge regulation was shown to have a significant effect on the predicted fluxes, and thus on the interpretation of recent experiment on nanochannels.Having established the accuracy of the conductivity matrix G, we used it to analyse Reverse Electrodialysis without the need to use extensive numerical calculations such as FEM. We compared typical values for carbon nanotubes and boron nitride nanotubes, and showed, for example, that such systems behave differently when KCl is used compared to NaCl. Most notably, in the case of NaCl we showed that negatively charged surfaces such CNTs and BNNTs are significantly less effective than positively charged surfaces, especially if salinities like those of fresh and sea water are used. We furthermore emphasised that the produced power does not solely depend on the chemical potential drop across the channel, but on the reservoir salinities separately. We thus found that systems with different surface charge, different type of salt and salinities are optimised differently. Electrokinetic systems present a very large parameter space, too large to fully explore here, but for this reason electrokinetic systems represent a great variability and applicability. The framework presented in this article provides an insightful and convenient method to analyse them.
Conflicts of interest
There are no conflicts to declare.Acknowledgements
This work is part of the D-ITP consortium, a program of the Netherlands Organisation for Scientific Research (NWO) that is funded by the Dutch Ministry of Education, Culture and Science (OCW). This work is a part of an Industrial Partnership Program of the Netherlands Organization for Scientific Research (NWO) through FOM Concept agreement FOM-15-0521. Financial support was provided through the Exploratory Research (ExploRe) programme of BP plc.Notes and references
- W. Sparreboom, A. van den Berg and J. C. T. Eijkel, Nat. Nanotechnol., 2009, 4, 713 CrossRef CAS PubMed.
- R. B. Schoch, J. Han and P. Renaud, Rev. Mod. Phys., 2008, 80, 839–883 CrossRef CAS.
- B. Hille, Biophys. J., 1978, 22, 283–294 CrossRef CAS PubMed.
- A. Alcaraz, E. M. Nestorovich, M. Lidón López, E. García-Giménez, S. M. Bezrukov and V. M. Aguilella, Biophys. J., 2009, 96, 56–66 CrossRef CAS PubMed.
- M. Queralt-Martín, E. García-Giménez, V. M. Aguilella, P. Ramirez, S. Mafe and A. Alcaraz, Appl. Phys. Lett., 2013, 103, 043707 CrossRef.
- R. T. Wilkin and D. C. DiGiulio, Environ. Sci. Technol., 2010, 44, 4821–4827 CrossRef CAS PubMed.
- R. P. Rastogi, R. C. Srivastava and S. N. Singh, Chem. Rev., 1993, 93, 1945–1990 CrossRef CAS.
- M. Elimelech and W. A. Phillip, Science, 2011, 333, 712–717 CrossRef CAS PubMed.
- D. Branton, D. W. Deamer, A. Marziali, H. Bayley, S. A. Benner, T. Butler, M. D. Ventra, S. Garaj, A. Hibbs, X. Huang, S. B. Jovanovich, P. S. Krstic, S. Lindsay, X. S. Ling, C. H. Mastrangelo, A. Meller, J. S. Oliver, Y. V. Pershin, J. M. Ramsey, R. Riehn, G. V. Soni, V. Tabard-Cossa, M. Wanunu, M. Wiggin and J. A. Schloss, Nat. Biotechnol., 2008, 26, 1146–1153 CrossRef CAS PubMed.
- Y. He, M. Tsutsui, R. H. Scheicher, X. S. Miao and M. Taniguchi, ACS Sens., 2016, 1, 807–816 CrossRef CAS.
- M. M. Hatlo, D. Panja and R. van Roij, Phys. Rev. Lett., 2011, 107, 068101 CrossRef PubMed.
- S. Pennathur, J. Eijkel and A. van den Berg, Lab Chip, 2007, 7, 1234–1237 RSC.
- B. B. Sales, M. Saakes, J. W. Post, C. J. N. Buisman, P. M. Biesheuvel and H. V. M. Hamelers, Environ. Sci. Technol., 2010, 44, 5661–5665 CrossRef CAS PubMed.
- F. H. J. van der Heyden, D. J. Bonthuis, D. Stein, C. Meyer and C. Dekker, Nano Lett., 2006, 6, 2232–2237 CrossRef CAS PubMed.
- M.-C. Lu, S. Satyanarayana, R. Karnik, A. Majumdar and C.-C. Wang, J. Micromech. Microeng., 2006, 16, 667–675 CrossRef CAS.
- J. W. Post, H. V. M. Hamelers and C. J. N. Buisman, Environ. Sci. Technol., 2008, 42, 5785–5790 CrossRef CAS PubMed.
- D.-K. Kim, C. Duan, Y.-F. Chen and A. Majumdar, Microfluid. Nanofluid., 2010, 9, 1215–1224 CrossRef CAS.
- A. Achilli, T. Y. Cath and A. E. Childress, J. Membr. Sci., 2009, 343, 42–52 CrossRef CAS.
- Q. She, X. Jin and C. Y. Tang, J. Membr. Sci., 2012, 401–402, 262–273 CrossRef CAS.
- A. P. Straub, A. Deshmukh and M. Elimelech, Energy Environ. Sci., 2016, 9, 31–48 RSC.
- D. Brogioli, Phys. Rev. Lett., 2009, 103, 058501 CrossRef PubMed.
- H. G. Park and Y. Jung, Chem. Soc. Rev., 2014, 43, 565–576 RSC.
- A. Siria, P. Poncharal, A.-L. Biance, R. Fulcrand, X. Blase, S. T. Purcell and L. Bocquet, Nature, 2013, 494, 455 CrossRef CAS PubMed.
- J. Feng, M. Graf, K. Liu, D. Ovchinnikov, D. Dumcenco, M. Heiranian, V. Nandigana, N. R. Aluru, A. Kis and A. Radenovic, Nature, 2016, 536, 197 CrossRef CAS PubMed.
- L. Onsager, Phys. Rev., 1931, 37, 405–426 CrossRef CAS.
- L. Onsager, Phys. Rev., 1931, 38, 2265–2279 CrossRef CAS.
- J. C. Fair and J. F. Osterle, J. Chem. Phys., 1971, 54, 3307–3316 CrossRef CAS.
- P. B. Peters, R. van Roij, M. Z. Bazant and P. M. Biesheuvel, Phys. Rev. E, 2016, 93, 053108 CrossRef CAS PubMed.
- Z. Ható, M. Valiskó, T. Kristóf, D. Gillespie and D. Boda, Phys. Chem. Chem. Phys., 2017, 19, 17816–17826 RSC.
- B. W. Ninham and V. Parsegian, J. Theor. Biol., 1971, 31, 405–428 CrossRef CAS.
- D. Y. Chan and D. Mitchell, J. Colloid Interface Sci., 1983, 95, 193–197 CrossRef CAS.
- R. J. Hunter, Foundations of Colloid Science, Clarendon Press, Oxford, UK, 1992 Search PubMed.
- P. M. Biesheuvel and M. Z. Bazant, Phys. Rev. E, 2016, 94, 050601 CrossRef CAS PubMed.
- E. Secchi, A. Niguès, L. Jubin, A. Siria and L. Bocquet, Phys. Rev. Lett., 2016, 116, 154501 CrossRef PubMed.
- C. Lee, C. Cottin-Bizonne, A.-L. Biance, P. Joseph, L. Bocquet and C. Ybert, Phys. Rev. Lett., 2014, 112, 244501 CrossRef CAS PubMed.
- L. Cao, F. Xiao, Y. Feng, W. Zhu, W. Geng, J. Yang, X. Zhang, N. Li, W. Guo and L. Jiang, Adv. Funct. Mater., 2017, 27, 1604302 CrossRef.
- M. Z. Bazant, K. Thornton and A. Ajdari, Phys. Rev. E: Stat., Nonlinear, Soft Matter Phys., 2004, 70, 021506 CrossRef PubMed.
- J. Overbeek, Colloid Science I, Irreversible Systems, Elsevier, 1952, ch. 5, pp. 194–244 Search PubMed.
- T. Mouterde and L. Bocquet, Eur. Phys. J. E: Soft Matter Biol. Phys., 2018, 41, 148 CrossRef.
- D. C. Prieve, J. L. Anderson, J. P. Ebel and M. E. Lowell, J. Fluid Mech., 1984, 148, 247–269 CrossRef CAS.
- L. Bocquet and E. Charlaix, Chem. Soc. Rev., 2010, 39, 1073–1095 RSC.
- M. Yang, X. Yang, Q. Wang, K. Wang, X. Fan, W. Liu, X. Liu, J. Liu and J. Huang, RSC Adv., 2014, 4, 26729–26737 RSC.
- J. Veerman, M. Saakes, S. Metz and G. Harmsen, J. Membr. Sci., 2009, 327, 136–144 CrossRef CAS.
- G. Tocci, L. Joly and A. Michaelides, Nano Lett., 2014, 14, 6872–6877 CrossRef CAS PubMed.
- B. Grosjean, M.-L. Bocquet and R. Vuilleumier, Nat. Commun., 2019, 10, 1656 CrossRef PubMed.
- B. L. Werkhoven, J. C. Everts, S. Samin and R. van Roij, Phys. Rev. Lett., 2018, 120, 264502 CrossRef CAS PubMed.
- B. L. Werkhoven, S. Samin and R. van Roij, Eur. Phys. J.: Spec. Top., 2019, 227, 2539–2557 Search PubMed.
- M. Majumder, N. Chopra, R. Andrews and B. J. Hinds, Nature, 2005, 438, 44 CrossRef CAS.
- P. Pang, J. He, J. H. Park, P. S. Krstić and S. Lindsay, ACS Nano, 2011, 5, 7277–7283 CrossRef CAS PubMed.
- E. Secchi, S. Marbach, A. Niguès, D. Stein, A. Siria and L. Bocquet, Nature, 2016, 537, 210 CrossRef CAS PubMed.
- Y. Ren and D. Stein, Nanotechnology, 2008, 19, 195707 CrossRef PubMed.
- I. Borukhov, D. Andelman and H. Orland, Phys. Rev. Lett., 1997, 79, 435–438 CrossRef CAS.
- J. Pedro de Souza and M. Z. Bazant, ArXiv e-prints, 2019.
Footnote |
| † Electronic supplementary information (ESI) available. See DOI: 10.1039/c9sm02144b |
| This journal is © The Royal Society of Chemistry 2020 |

