DOI:
10.1039/C9SM01992H
(Paper)
Soft Matter, 2020,
16, 1866-1876
Escape dynamics of liquid droplets confined between soft interfaces: non-inertial coalescence cascades†
Received
4th October 2019
, Accepted 16th January 2020
First published on 17th January 2020
Abstract
We have studied the motion of liquid droplets located in the contact zone of two soft solids that are pressed together inside a liquid. The driving force of the motion is the gradient of elastic contact pressure. Upon reaching the perimeter of the contact spot, the droplets coalesce with the surrounding bulk liquid either in a continuous or discontinuous fashion. Droplets that exhibit complete coalescence move with a speed proportional to the pressure gradient along their trajectory. However, droplets that undergo partial coalescence cascades (up to 9 were observed) do not. The latter also move significantly slower. We have identified surface roughness as a potential mechanism causing the contrasting behavior.
1 Introduction
The behavior of liquid confined between solids, of which at least one is soft and elastomeric, is important in a number of technological applications such as aquaplaning,1–11 tribology, printing12–14 and adhesion.15–20 The stability of liquid films is highly desirable in tribological applications such as contact lenses and cartilage joints, where direct solid on solid contact would induce wear and frictional heating. However, the presence of low viscosity liquids such as water is generally a nuisance in the context of the adhesive joining of two surfaces, as liquids are essentially incompressible and thus prevent close contact and moreover reduce the effective Hamaker constant by up to a factor of 10.21 For achieving maximum adhesion in wet environments the complete removal of liquid between the contacting materials is beneficial. However, in solid–liquid–solid dewetting complete removal of liquid is rare, i.e. temporarily trapped droplets are very frequently observed in the contact spot.22 The focus of this manuscript is on the mechanism and dynamics of the expulsion of these droplets.
Brochard and coworkers have investigated the stability of uniform thin liquid films between soft solids and derived a scaling law for the growth dynamics of a circular dry spot.23–25 They also presented a theory of spinodal dewetting of ultra thin films at soft interfaces.26 Sneddon showed that the shape of an inclusion characterized by a constant pressure in an incompressible elastic medium is an ellipse, except very near the perimeter of the inclusion.27 Based on his work, Martin et al. showed that the shape of stationary droplets confined between soft elastic solids is (semi-)ellipsoidal and that the droplet footprint radius ad scales as the square of the center height hd of the droplet.22
This manuscript deals with the motion of droplets confined between a flat elastomer layer and an elastic hemisphere that is pressed into the layer. The non-uniform contact pressure gives rise to a pressure gradient in the contact zone, that drives the droplets radially outward. Our key finding is that at the perimeter of the contact area they merge with the outer liquid either completely in a single coalescence event or in a cascade of sequential partial coalescence events. We give an overview of various systems for which full and partial coalescence effects have been observed in the past in Section 6 and discuss their relevance to our findings. To gain insight into this experimental observation, we performed fully-coupled three-dimensional numerical simulations, which reproduce the droplet shape evolution very well. Moreover, we developed an analytical model that reproduces the scaling of the contact time of the droplet with the outer liquid upon coalescence well.
2 Experimental setup
Fig. 1(a) shows a sketch of the experimental geometry. An elastomer half-sphere is pressed onto a flat layer of the same material with liquid confined in between. The elastomer used was a silicone-based, heat-curable, two-component polymer resin (Smooth-On, Encapso K, Young's modulus Y = 1.365 MPa). The liquid is a perfluoropolyether (Solvay, Fomblin Y LVAC 14/6, average molecular weight 2500, viscosity μ = 0.2646 Pa s). The flat elastomer layer is attached to a glass substrate. The dynamics of the liquid is viewed from beneath the substrate with an inverted microscope. Details of the setup, the experimental procedures as well as the liquid and solid material properties are provided in ref. 28.
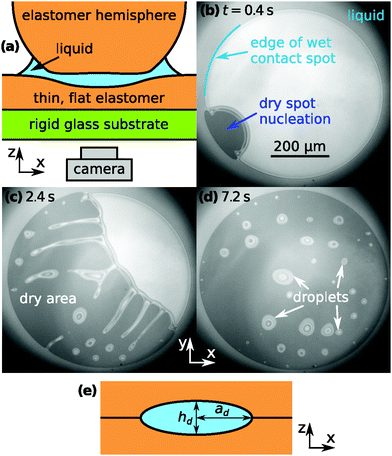 |
| | Fig. 1 (a) Side-view sketch of the experimental geometry. (b–d) Microscope images of dry spot nucleation and dewetting in the wet contact zone between an elastic half-sphere and a flat elastic layer. Frequently droplets are created due to an instability of the dewetting rim. (e) Cross-sectional side-view sketch through a droplet with the maximum thickness hd and footprint radius ad indicated. | |
Fig. 1(b) shows a snapshot of the contact spot shortly after a dry spot nucleation event took place. Light reflected from the silicone–liquid and liquid–hemisphere interfaces gives rise to interference fringes [Fig. 1(b)–(d)], which allow to determine the film thickness distribution h(x,y) of the liquid. When dewetting starts, the liquid film thickness is essentially uniform throughout the contact spot. At this instant the liquid film thickness near the center of the contact spot was 104 ± 2 nm and decreasing at a rate of 2.4 nm s−1 as24h evolves in time according to t−1/2. Fig. 1(c) visualizes the growth process of the dry spot, which is accompanied by a pronounced instability of the dewetting rim. This leads to the formation of liquid threads that subsequently break up into droplets. Due to the radially increasing pressure gradient in the contact spot, droplets move radially outwards, the faster the closer they are to the edge of the contact spot.
According to ref. 29, silicone polymers may still contain uncrosslinked chains after curing, which can be extracted by immersing the elastomer in a good solvent and subsequently deswelling it. We swelled different samples in toluene, p-xylene, ethyl acetate and 2-propanol for several days, refreshing the solution daily, then used a 1![[thin space (1/6-em)]](https://www.rsc.org/images/entities/char_2009.gif) :1 mix by volume of the good solvent and ethanol for one day and pure ethanol for another day to deswell the samples. After this procedure we noted a mass loss of (22.5 ± 0.1)% in all cases. However, all solvents except 2-propanol induced partial disintegration or debonding of the elastomer layer. Consequently, we only used 2-propanol as the good solvent. The mass loss observed for our material system is considerably larger than that reported for Sylgard 184 in ref. 29. Nevertheless our layers remained optically clear and the surface remained smooth and flat.
:1 mix by volume of the good solvent and ethanol for one day and pure ethanol for another day to deswell the samples. After this procedure we noted a mass loss of (22.5 ± 0.1)% in all cases. However, all solvents except 2-propanol induced partial disintegration or debonding of the elastomer layer. Consequently, we only used 2-propanol as the good solvent. The mass loss observed for our material system is considerably larger than that reported for Sylgard 184 in ref. 29. Nevertheless our layers remained optically clear and the surface remained smooth and flat.
3 Analytical model
3.1 Movement of droplets at soft interfaces
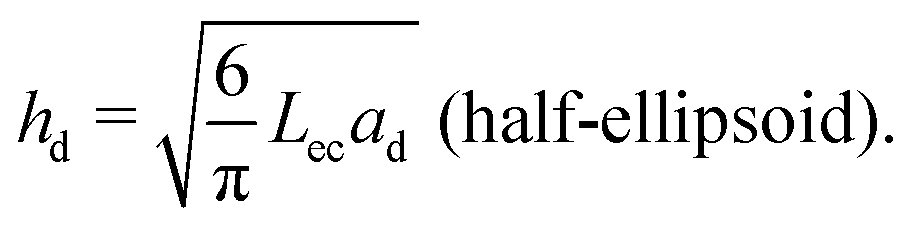
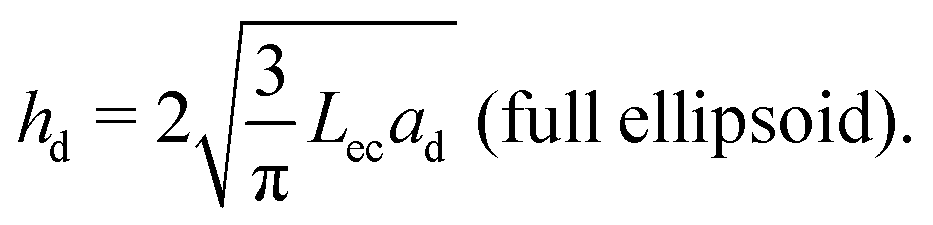
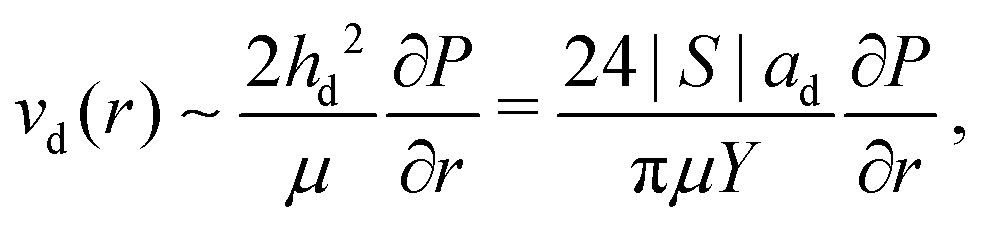
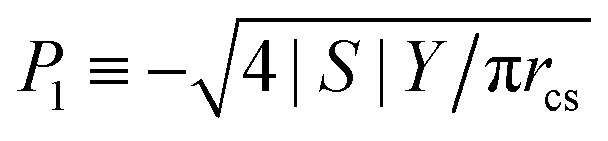
We consider a case where droplets occur after dewetting and aim to derive a simple description of their motion induced by the pressure gradient inside the contact spot. We define the elastocapillary length as Lec = |S|/Y, where S ≡ γee − 2γel is the spreading parameter. Here, γee is the energy density of two identical elastomer surfaces in contact, and γel the elastomer–liquid surface energy density. Martin et al. considered the conformation of a droplet confined by soft, elastic interfaces.22 When Lec is much smaller than the droplet footprint radius ad, then a droplet squeezed between a rigid plane and a soft solid in a region of uniform pressure will have the shape of a flat half-ellipsoid, with height22| |  | (1) |
When considering a droplet between two soft solids, the derivation is analogous to that in ref. 22, resulting in an additional prefactor of 
| |  | (2) |
We used eqn (2) to estimate the value of S from the observed droplet geometry. From our experiments we found S = (−8 ± 2) mN m−1, corresponding to Lec = (6 ± 2) nm. If the interfacial pressure distribution is not uniform, the droplet will move towards regions of lower pressure to minimize the elastic deformation energy. The speed of its motion will be determined by the balance of the viscous dissipation rate in the liquid and the elastic energy gain rate. Assuming that the droplet maintains a constant ellipsoidal shape, that the deformations are small and that the liquid flow inside the droplet can be determined from the Reynolds equation, an estimate of the droplet speed can be calculated.
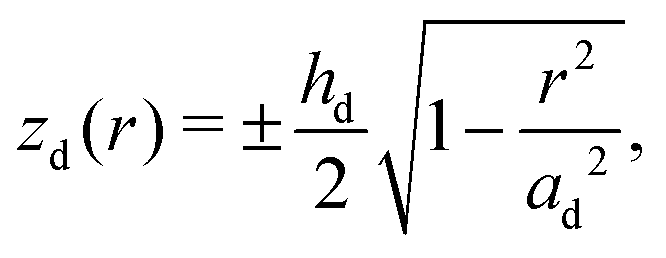
The z-positions of the liquid–solid interfaces of the droplet in cylindrical coordinates (with origin at the droplet midpoint) are conforming to the ellipsoid shape
| |  | (3) |
where
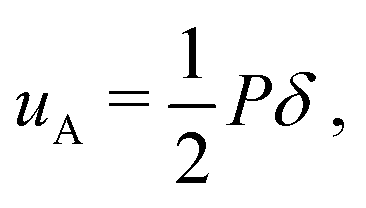
hd is the thickness of the droplet. The surface energy density
uA (work per unit area performed by pressure displacing the elastic surface by
δ) is
| |  | (4) |
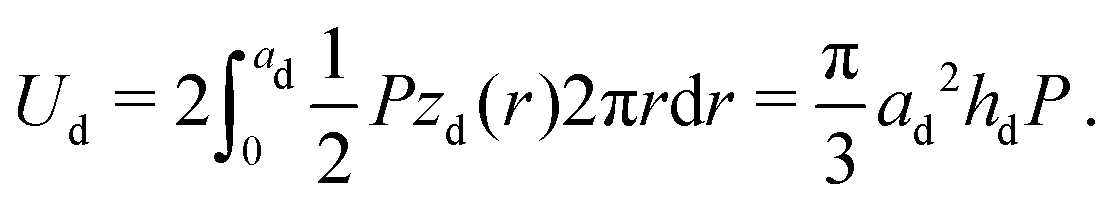
where
P is the local pressure. The energy
Ud needed to introduce a droplet at an interface between two elastomers is
| | 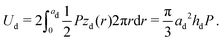 | (5) |
If the droplet is moving radially with a velocity
vd in a contact spot with pressure distribution
P(
r), the energy gain rate is
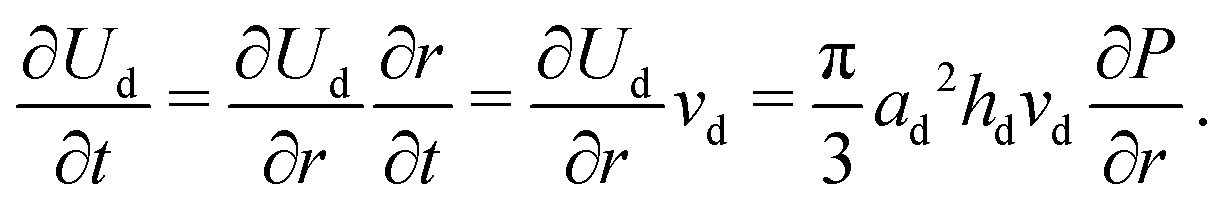
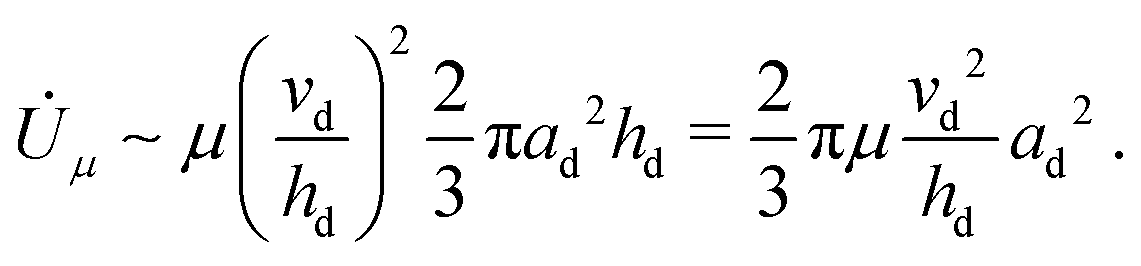
| |  | (6) |
Equating this expression with the total energy dissipation rate allows us to derive the droplet velocity. Following
ref. 24 the viscous dissipation rate
![[U with combining dot above]](https://www.rsc.org/images/entities/i_char_0055_0307.gif) μ
μ is approximately
μ(
vd/
hd)
2 per unit volume. Thus the energy dissipation rate is approximately
| |  | (7) |
Equating
eqn (7) and (6) yields an estimate for the radial droplet velocity
| |  | (8) |
which is proportional to the contact pressure gradient.
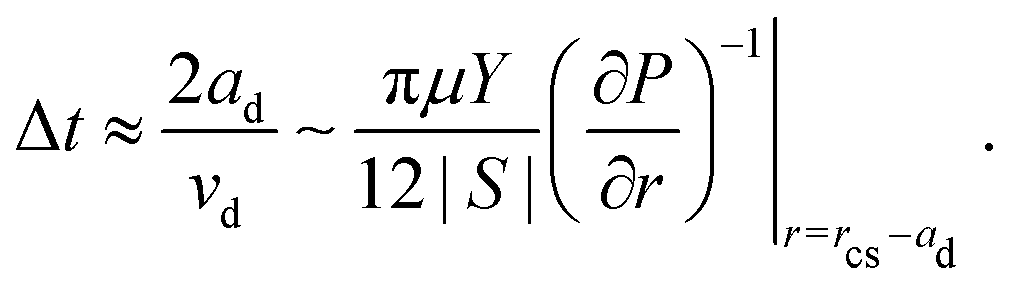
3.2 Coalescence with outer bulk liquid
Droplets move towards the edge of the contact spot with the velocity vd(r) given by eqn (8). Assuming that after the commencement of coalescence with the outer bulk liquid, the back of the droplet keeps moving with a constant velocity, the coalescence time Δt can be estimated as| | 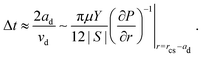 | (9) |
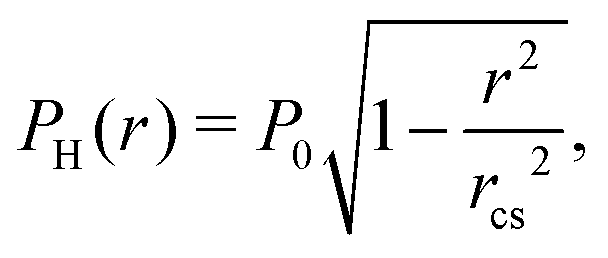
Assuming a Hertzian pressure distribution inside the contact spot30
| |  | (10) |
with
P0 ≡ 2
rcsY/π
RL being the maximum pressure at the center,
eqn (9) becomes
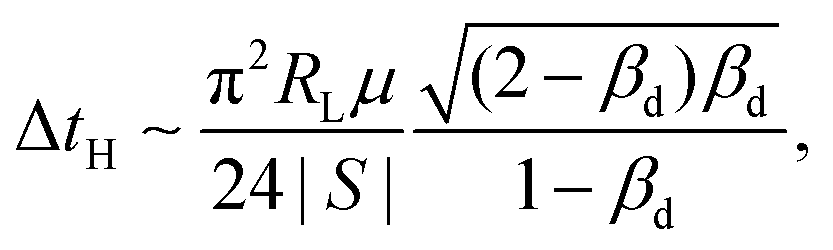
| |  | (11) |
where we introduced the parameter
βd ≡
ad/
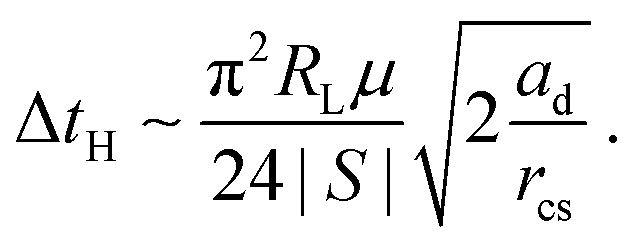
rcs. For small
βdeqn (11) is approximately equal
| |  | (12) |
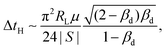
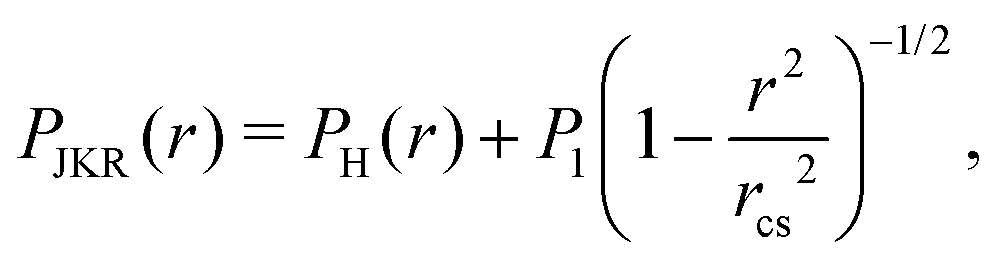
The JKR model31 more accurately represents our system, as it additionally considers the surface energy of adhesion. For a JKR pressure distribution
| |  | (13) |
where
, we find
| |  | (14) |
In the limit of βd → 0 eqn (14) reduces to
| |  | (15) |
We note that both the Hertzian and the JKR pressure profiles have an unphysical singularity of ∂
P/∂
r at the edge of the contact spot. Both models do not represent accurately the pressure distribution around a contact line at a lengthscale equal to the elastocapillary length
Lec, which is approximately 10 nm for our material system. Since the droplet diameters we consider are typically a factor of thousand larger, the pressure profiles are expected to provide a suitable approximation.
4 Experimental results
4.1 Droplet motion
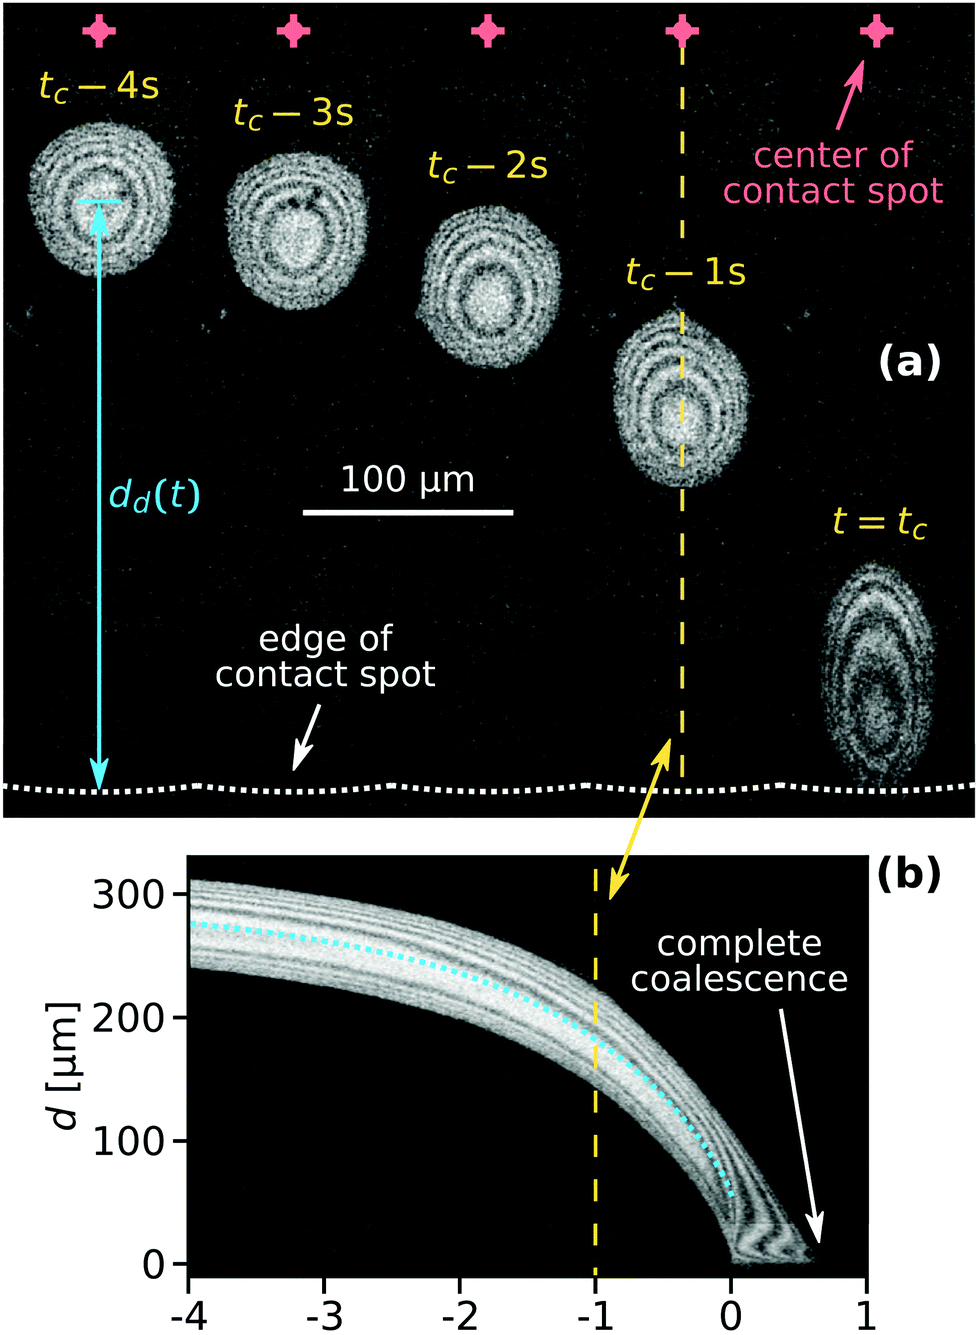
Fig. 2(a) shows microscope images of a droplet moving towards the edge of the contact spot. The red crosses denote the center of the contact spot. The white dotted line denotes the edge of the contact spot. The yellow dashed line is the centerline trajectory of the droplet in the radially outward direction. In Fig. 2(b), the time evolution of the radial intensity profiles Ic(d,t) through the center of the escaping droplet [dashed line in (a)] is visualized. The ordinate d ≡ rcs − r quantifies the radial distance to the edge of the contact spot. The blue dotted line in Fig. 2(b) indicates the position of the midpoint of the droplet dd(t) in time. Its slope |ḋd(t)| is equal to vd.
 |
| | Fig. 2 (a) Microscope images of a droplet moving towards the edge of the contact spot. (b) Time evolution of the radial intensity profile Ic(d,t) through the center of the droplet visible in (a) which coalesces completely. The dashed lines both indicate Ic(d,t − tc = 1 s). | |
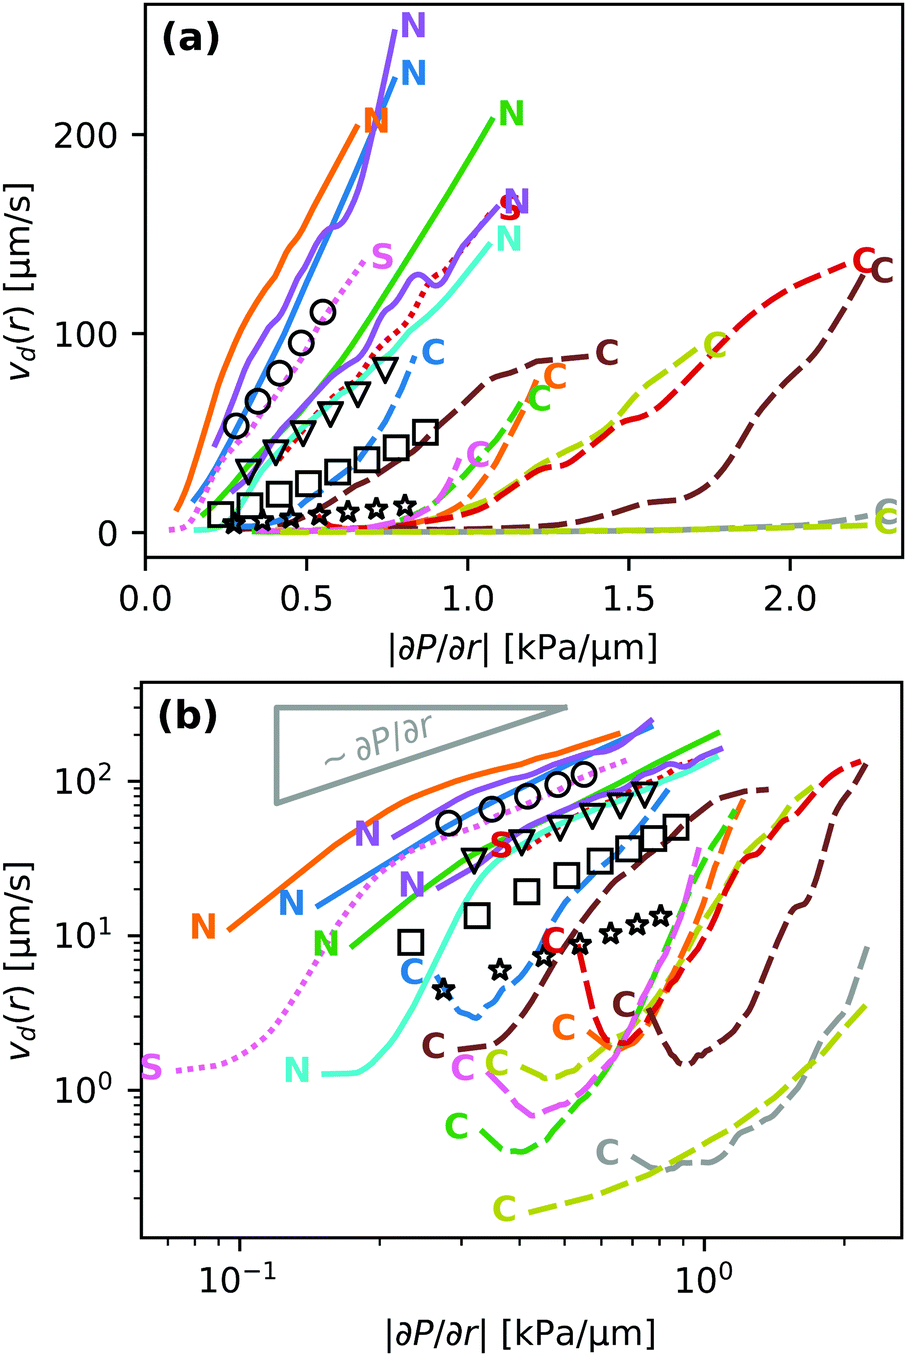
Fig. 3 shows the correlation between the droplet velocity vd and the local pressure gradient. The droplet speed vd was determined by tracking the radial position of the center of the droplet – defined as halfway between the front and back of the droplet – in time. The pressure gradient is determined from the theoretical JKR pressure profile evaluated at the droplet center location. Right after their formation droplets usually have an irregular shape. The first datapoint for each curve in Fig. 3 corresponds to the moment when the droplet footprint has relaxed to a round shape. The last datapoints correspond to the frames right before coalescence with the outer bulk liquid.
 |
| | Fig. 3 Droplet velocity vd plotted against the pressure gradient at the droplet center using (a) linear and (b) logarithmic axes. Non-cascading droplets (solid lines) are marked with ‘N’. Droplets that cascaded once (dotted lines) or more than once (dashed lines) are labeled with ‘S’ or ‘C’, respectively. The open black symbols correspond to typical numerical results. | |
The velocity profile of non-cascading droplets is generally linearly proportional to the local pressure gradient before coalescence, consistent with the behavior expected on hydrodynamic grounds. Two droplets that were observed to cascade only once also moved with a velocity proportional to |∂P/∂r| throughout most of their lifetime. In contrast, all droplets which cascaded at least twice exhibited a qualitatively different behavior. These droplets initially moved one to two orders of magnitude slower than the velocity predicted by the hydrodynamic model. Some even show a non-monotonic behavior, i.e. an initial slow-down and subsequent acceleration.
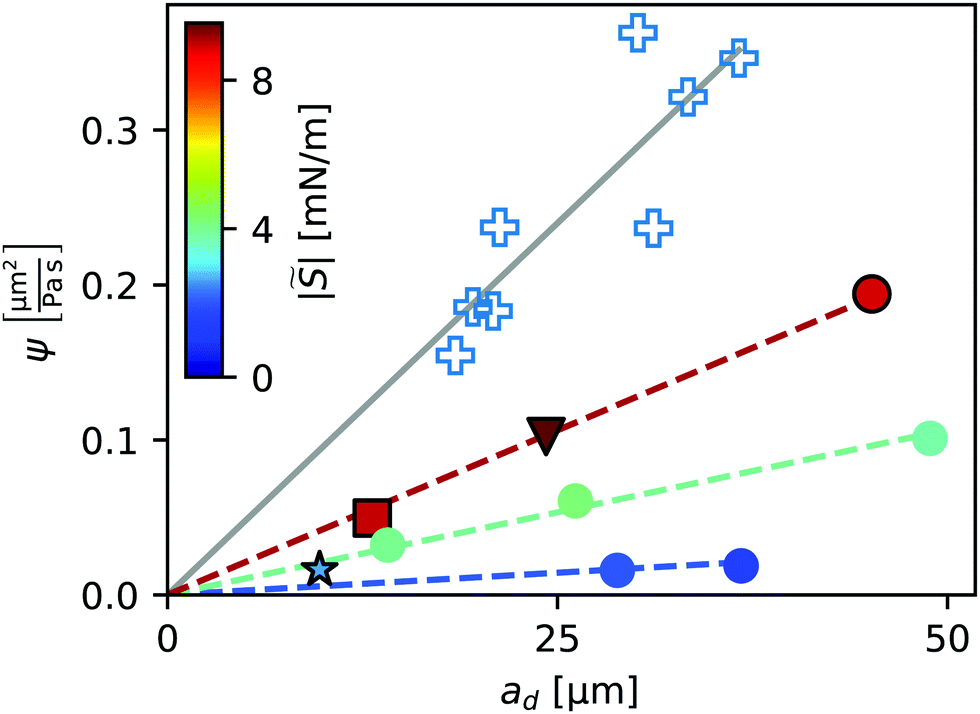
We fitted the velocity vs. pressure gradient curves in Fig. 3 with linear fit functions. In Fig. 4 we present the slopes ψ of these fit functions for the single- and non-cascading droplets as a function of droplet size ad (crosses). According to eqn (8), the slope ψ = 24|S|ad/(πηY) is proportional to ad. The gray solid line in Fig. 4 is a linear fit, which represents the experimental data well.
 |
| | Fig. 4 Slope ψ of the velocity-pressure gradient curves shown in Fig. 3(a) for single- and non-cascading droplets. Open crosses represent experiments. Filled symbols represent numerical simulations, with their color indicating the value of the parameter |![[S with combining tilde]](https://www.rsc.org/images/entities/i_char_0053_0303.gif) |, to be discussed in Section 5. Filled symbols with black edges correspond to the numerical results in Fig. 3. Lines represent linear correlations ψ ∼ ad. |, to be discussed in Section 5. Filled symbols with black edges correspond to the numerical results in Fig. 3. Lines represent linear correlations ψ ∼ ad. | |
4.2 Droplet coalescence
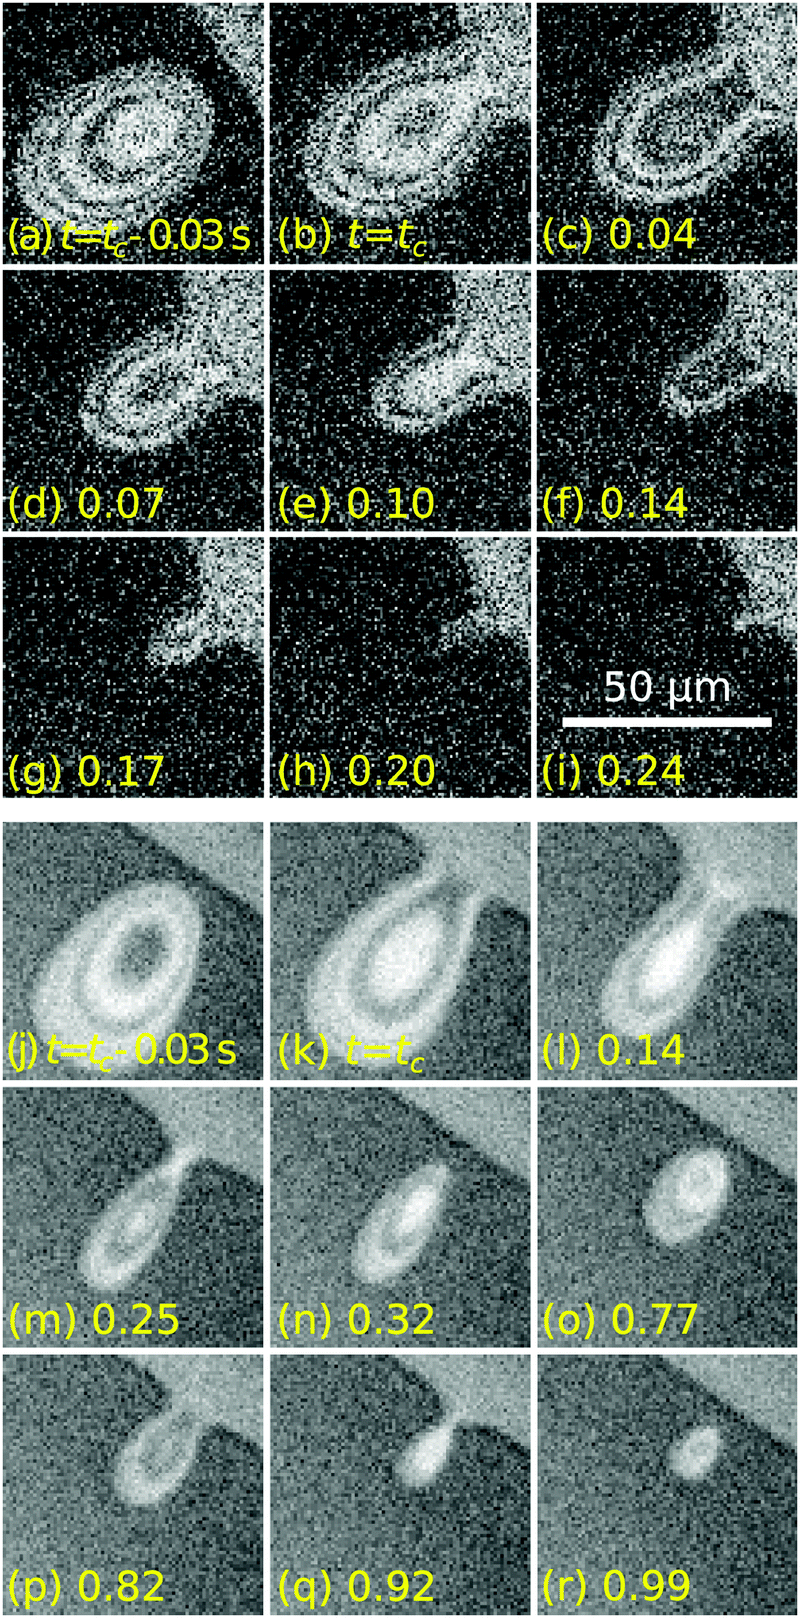
The time t = tc in Fig. 2(a) corresponds to the moment of first contact between the droplet and the outer bulk liquid. The coalescence process of radially moving droplets with the bulk liquid outside of the contact spot can proceed in a continuous or discontinuous fashion. Fig. 5 contrasts the two observed behaviours of either complete, continuous or partial, discontinuous coalescence. In Fig. 5(a)–(i), a droplet makes contact and continuously remains in contact with the outer liquid until it is entirely absorbed. In Fig. 5(j)–(r), the liquid bridge connecting the droplet and outer liquid displays a non-monotonic behaviour. It initially grows [Fig. 5(k) and (l)] then shrinks [Fig. 5(m)] and eventually disintegrates [Fig. 5(n)]. This cascading behaviour can occur multiple times during the lifetime of a droplet. Up to nine consecutive cascades were observed for a single droplet.
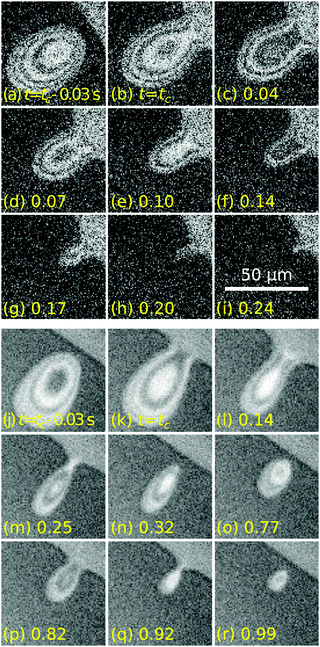 |
| | Fig. 5 The coalescence of moving droplets with the bulk liquid outside of the contact spot can proceed in a continuous (a–i) or discontinuous (j–r) fashion. The indicated time increments are given relative to the frames (b and k) where coalescence started. The scale bar in (i) applies to all images. | |
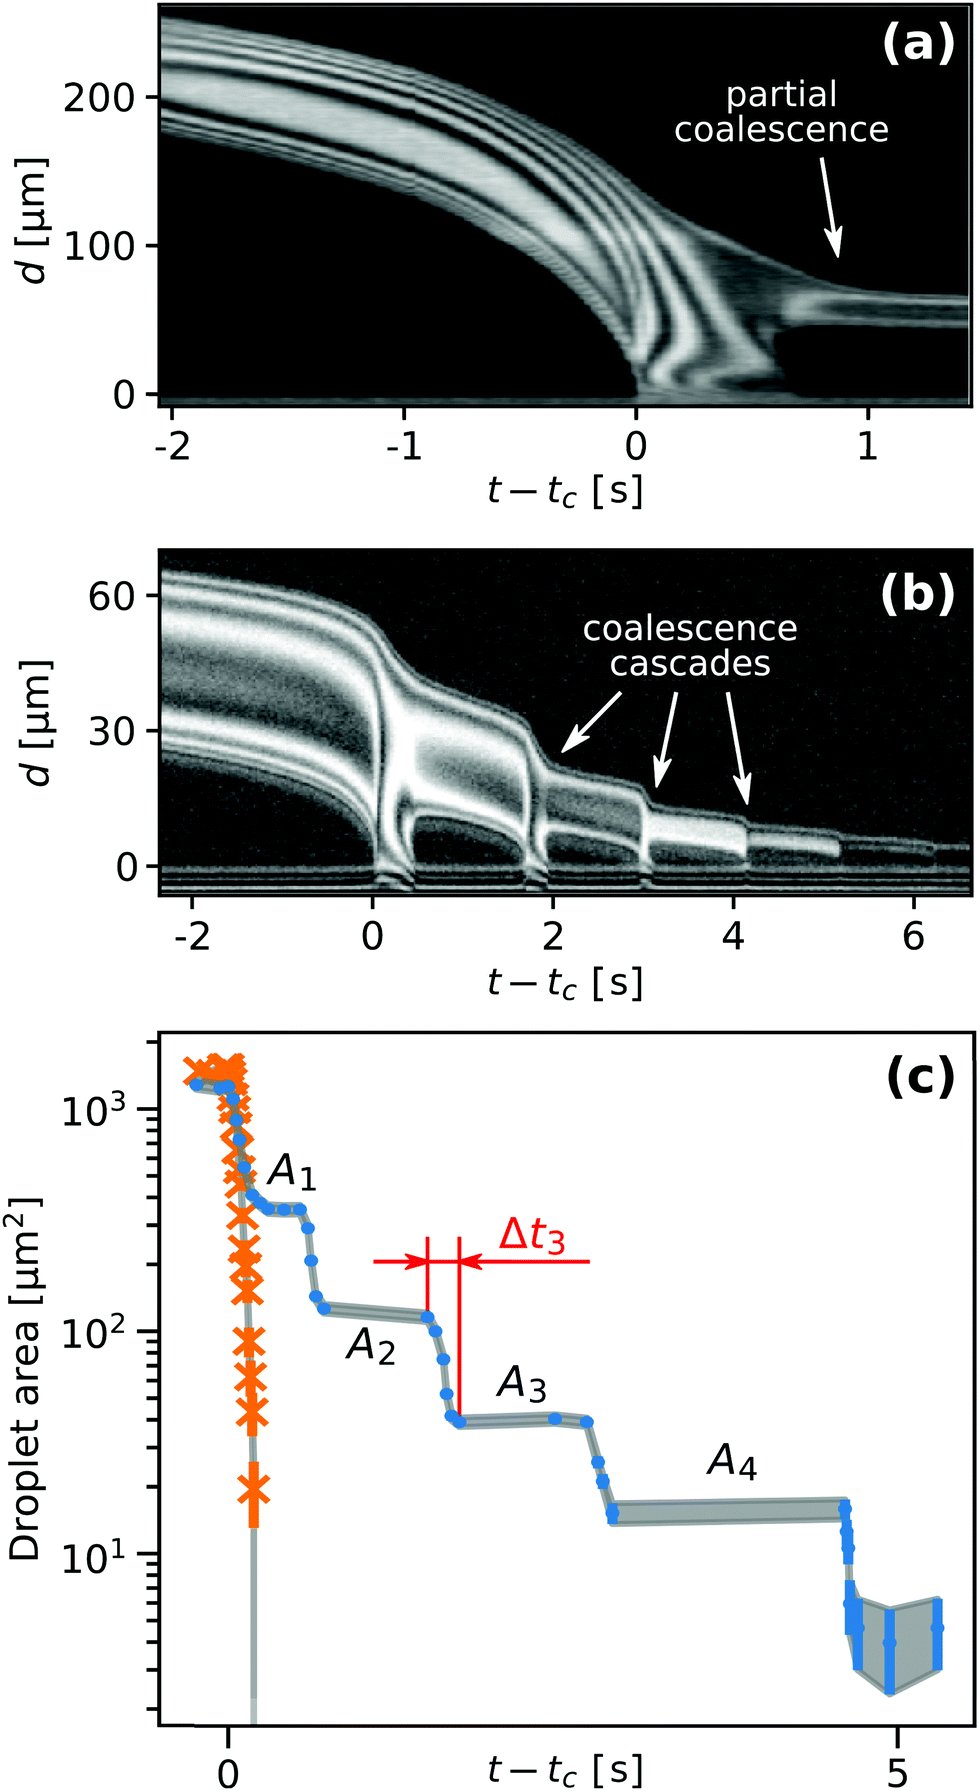
Fig. 6(a) shows a case where the droplet does not coalesce completely, but a much smaller droplet appears in proximity to the edge of the contact spot. Fig. 6(b) shows a plot of the radial centerline intensity profiles Ic(d,t) for a droplet cascading six times.
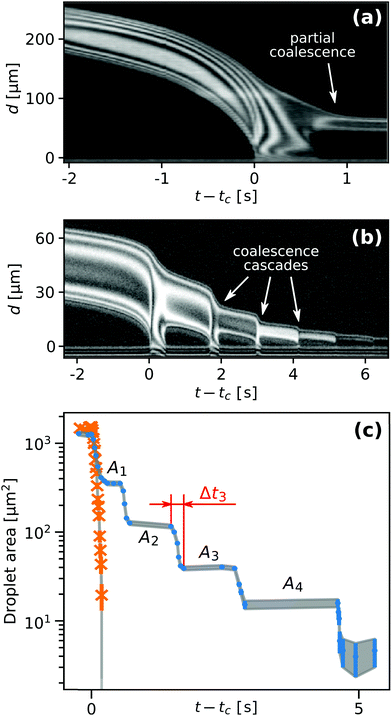 |
| | Fig. 6 Plot of the radial centerline intensity profiles Ic(d,t) for a droplet which (a) coalesces only partially and leaves a smaller droplet behind and (b) one that cascaded six times. (c) Droplet footprint area as a function of time. The orange crosses and blue circles correspond to the data shown in Fig. 5(a)–(i) and (j)–(r), respectively. | |
Fig. 6(c) compares the time history of the droplet footprint area of a non-cascading droplet and one that cascades five times. The latter shows a pronounced staircase-like morphology with a relatively uniform area reduction ratio ζn ≡ An/An−1. Here, An−1 and An denote the droplet footprint areas before and after its n-th cascade, respectively.
Fig. 7(a) shows systematic experimental data of the area reduction ratio ζn of droplets undergoing their n-th cascade. After their first cascade most droplets become 2 to 6 times smaller. However, predominantly larger droplets (blue circles) sometimes produce secondary droplets that are more than 10 times smaller.
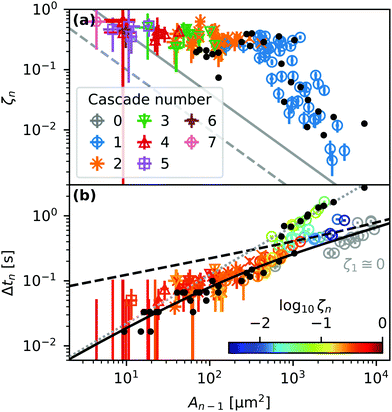 |
| | Fig. 7 (a) Area reduction ratio ζn and (b and c) contact time Δtn of droplets with footprint area An−1 undergoing their n-th cascade. The solid and dashed lines in (a) represent the resolution limits of experimentally observable ζn values for two used microscope magnifications. The color of the symbols in (b) represents the ζn value as indicated by the colorbar. Gray circles in (b) correspond to fully coalescing, non-cascading droplets. The dashed and solid black lines and the dotted grey line represent eqn (11), (14) and (15), respectively. Black dots represent measurements on substrates treated with 2-propanol. | |
Fig. 7(b) shows the correlation between the area of a droplet An−1 right before the n-th cascade and its contact time Δtn, defined as the time from the start of coalescence to pinch-off, as indicated in Fig. 6(b). Larger droplets remain in contact with the outer bulk liquid for a longer time during a single cascade. The dashed and solid black lines and the dotted grey line represent eqn (11), (14) and (15), respectively. The black dots represent experiments using 2-propanol-treated samples, as described in ref. 29, to investigate the influence of uncrosslinked chains on the movement of droplets.
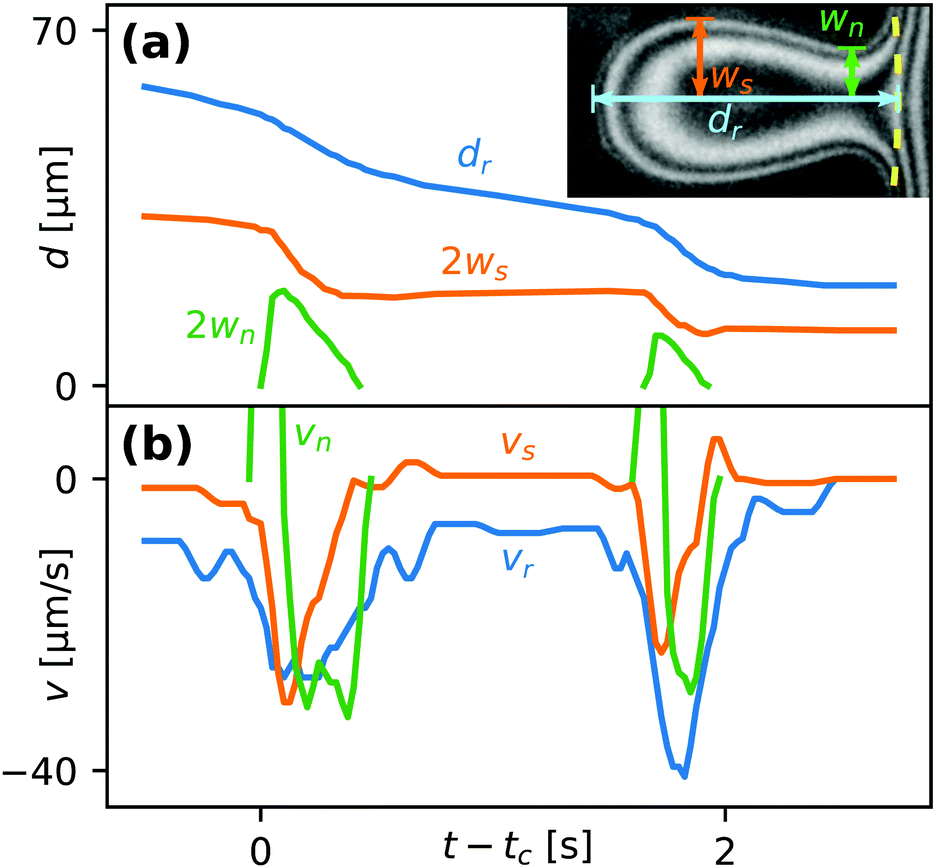
Fig. 8(a) shows the position of the rear dr, the maximal half-width ws and the neck half-width wn of a droplet undergoing two partial coalescence cascades. The definitions of these parameters are illustrated in the inset. Fig. 8(b) shows the contact line speed at the back (vr ≡ ḋr), side (vs ≡ ẇs) and neck (vn ≡ ẇn) of the droplet, where a dot above a parameter indicates a time derivative. The two not visible positive maxima of vn are at 110 and 60 μm s−1, respectively. We note that vs reacts immediately to the formation of a liquid bridge (wn > 0) but vr is delayed. This feature, as well as the positive values of vs after breakup, is due to the droplet relaxing to a rounder shape after becoming elongated during the coalescence. To maintain a constant aspect ratio ws/dr the back would need to move twice as fast as the side.
 |
| | Fig. 8 (a) Time dependence of the rear position dr, maximal width ws and neck width wn of a droplet undergoing two coalescence cascades. Inset: Definitions of dr, ws and wn. The contact spot edge is marked with a dashed yellow line. (b) Contact line speed at the rear (vr), side (vs) and neck (vn) of the droplet. | |
5 Comparison with numerical simulations
In order to elucidate the qualitative difference between cascading and non-cascading droplets we turn to numerical simulations for gaining further insight. We used the same fully-coupled, three-dimensional numerical model that is described in detail in ref. 28. We combine the stationary Cauchy momentum equation for soft, linear elastic materials with the Reynolds equation for thin film flow and apply a disjoining pressure formalism to implement the partial wettability. We solved the equations using finite element software COMSOL Multiphysics. In our numerical simulations we disregard the dewetting process visible in Fig. 1(b) but rather use an initial condition analogous to the first frame of Fig. 2(a). A single droplet of given volume is released at a certain distance from the center of the contact spot.
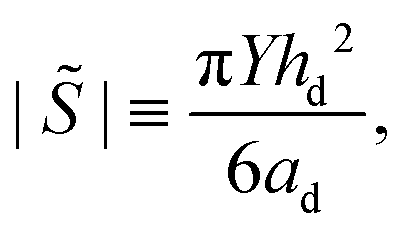
The circles in Fig. 4 represent numerical simulations, with their color indicating the value of the parameter
| |  | (16) |
obtained by extracting the footprint radius
ad and height
hd of a droplet.
Eqn (16) is derived from
eqn (1) for half-ellipsoidal droplets, but based on values of
hd and
ad taken from the simulations. The dashed lines are linear relations
ψ ∼
ad, which match the numerical results reasonably well, again consistent with
eqn (8).
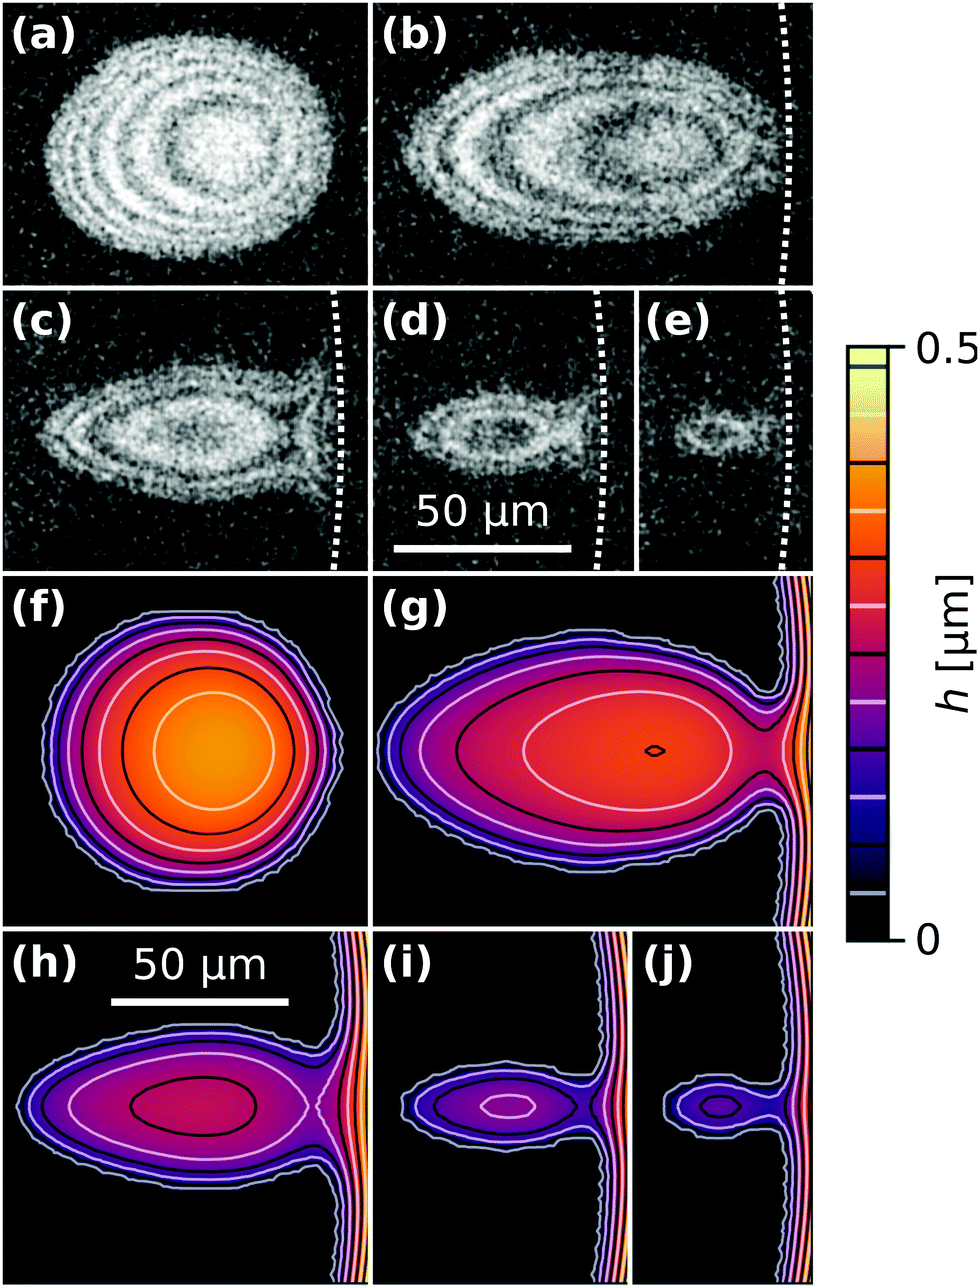
Fig. 9 compares experimental droplet morphologies with numerical simulations. The dotted white lines in Fig. 9(a)–(e) mark the edge of the contact spot. The solid lines in Fig. 9(f)–(j) are lines of equal liquid film thickness, similar to the interference fringes in (a)–(e). The overall shape of the simulated droplets agrees very well with the experimentally observed ones.
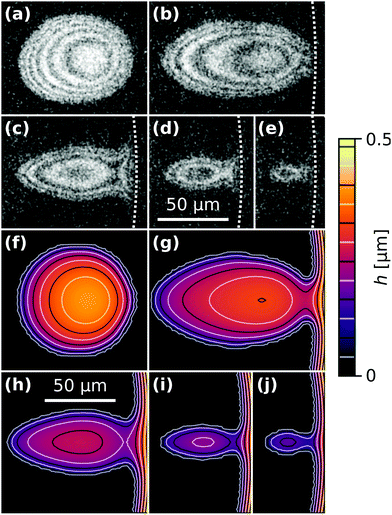 |
| | Fig. 9 Snapshots from an experiment (a)–(e) and a numerical simulation (f)–(j) showing similar droplet morphologies before and during complete coalescence with the outer bulk liquid, i.e. without cascading. The contours in (f)–(j) are lines of equal film thickness, similar to the interference fringes in (a)–(e). The (identical) scale bars in (d) and (h) apply to all images. | |
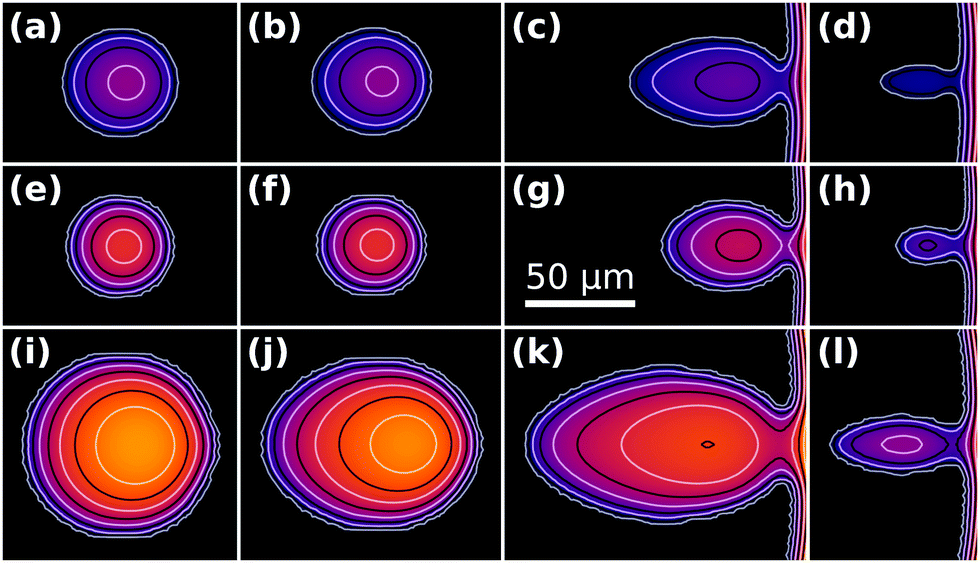
Fig. 10 shows snapshots from three different simulations of escaping droplets, where we have varied the droplet footprint radius ad as well as the parameter ||. In Fig. 10(i)–(l)ad is twice as large as in (a)–(h), whereas || is twice as high in Fig. 10(e)–(l) compared to (a)–(d). In other words, rows (a)–(d) and (i)–(l) share the same Lec/ad ratio, whereas row (e)–(h) has twice as large a ratio. We note that the similar morphology evolution of Fig. 10(a)–(d) and (i)–(l) may be related to these cases having the same ratio of the elastocapillary length Lec to the footprint radius ad. Similarly, the higher ratio in Fig. 10(e)–(h) may be responsible for the less elongated shape throughout the droplet escape history.
 |
| | Fig. 10 Snapshots from three numerical simulations. Columns 1–4 show droplets when d/rcs = 0.45, 0.3, at the start of coalescence and during coalescence, respectively. Row (a)–(d) shows a droplet with initial width Ld = 52 mm and || = 4.2 mN m−1. The value of || was twice as high in row (e)–(h) as in row (a)–(d), i.e. || = 9.5 mN m−1 and 2ad = 49 mm. The droplet was twice as wide in row (i)–(l) as in row (e)–(h), i.e. 2ad = 90 and || = 8.9 mN m−1. | |
6 Discussion
So-called partial coalescence and coalescence cascades have been observed for droplets contacting other droplets or flat liquid–liquid or liquid–air interfaces.32–44 Usually partial coalescence of pure liquids requires a high Weber number i.e. sufficient inertia and the propagation of capillary waves, i.e. an Ohnesorge number below a critical value. In our case We ≡ ρvd2ad/|S| ≈ 10−8 and 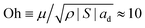 , therefore capillary waves are not present, as the system is strongly dominated by viscous forces. Glass et al. studied the effect of water-soluble polymers on coalescence cascades of organic liquid drops at an organic liquid–water interface.45 Sartor and Abbott and Beard et al. considered the effect of dissimilar electrical droplet charges on the coalescence of colliding droplets and found that charge differences promote complete coalescence.46–48 Ristenpart et al. studied the droplet rebound from a liquid–liquid interface subject to an applied perpendicular electric field.49 Beard et al. showed that a reduction in air pressure promoted contact, thereby reducing the likelihood of bouncing and increasing that of permanent coalescence.50 Feng et al. investigated the effect of non-Newtonian rheology on the coalescence dynamics.51,52 When either the drop or the surrounding phase is a polymer solution, viscoelasticity tends to delay the break-up of secondary drops and can suppress partial coalescence altogether, as large tensile polymer stresses resist the stretching and thinning of the fluid neck. Kuznicki et al. considered the effect of electrolyte concentration on coalescence cascades of oil droplets.53 De Malmazet et al. showed that the presence of micro-particles reduces drop lifetimes and promotes coalescence.54 Blanchette et al. studied the influence of solutocapillary Marangoni stresses on drop coalescence.55 Surfactants can enhance or weaken partial coalescence effects, depending on the concentrations and the induced surface elasticity.56–61
For our system, inertia is negligible and there are no propagating capillary or elastic waves induced by the droplet motion. Although the dependence of contact time on droplet radius Δt ∼ R3/2 as observed by e.g. Thoroddsen and Takehara33 agrees with the scaling Δt ∼ ad3/2 in eqn (15) this agreement is coincidental, as the prefactors depend on unrelated material properties. Our material system is not susceptible to surfactant adsorption. Moreover, we have measured electric surface charge distribution induced by solid-on-solid contact and separation, but it was below the detection limit (1012 ions per m2).62,63 Since the droplets move smoothly and continuously without stick-slip behavior and since they maintain a round and mirror-symmetric morphology, it is highly unlikely that surface irregularities and defects are responsible for the slow motion and the cascading behavior. Non-homogeneities tend to cause irregular droplet footprints and non-monotonic velocity profiles.
We speculate that the coalescence cascades are merely a consequence of the slow contact line speed. The latter implies that the aspect ratio of the liquid bridge becomes slender such that it is susceptible to break-up. This is analogous to the partial coalescence mechanism for liquid droplets suggested by Blanchette and Bigioni: if capillary waves can sufficiently delay the vertical (in our case: radial) collapse, pinch off will occur and a smaller drop will be left above the interface (in our case: near the edge of the contact spot).37,39 Instead of capillary oscillations delaying the forward motion of the rear end of the free droplets studied by Blanchette and Bigioni, the delay in our case is likely of a different nature. This may hint at the presence of a dissipation mechanism that depends non-linearly on the droplet velocity. Such a dissipation mechanism could explain the observed variation of the droplet speeds by two orders of magnitude in Fig. 3.
In our numerical simulations we consider a homogeneous surface and bulk composition so far. The simulated droplets move according to hydrodynamical expectations and exhibit complete coalescence without cascading behavior. We have attempted to reproduce the slow yet smooth droplet motion seen in the experiments in Fig. 3 by modulating geometric and material properties of our system. Specifically, we considered the influence of surface roughness as well as spatial modulations of the spreading parameter |S| and Young's modulus Y. As for the latter two, we generally found that for experimentally conceivable parameter variations, the reduction in contact line speed was far less than two orders of magnitude. In the following subsection we report on the effect of surface roughness.
6.1 Influence of surface roughness
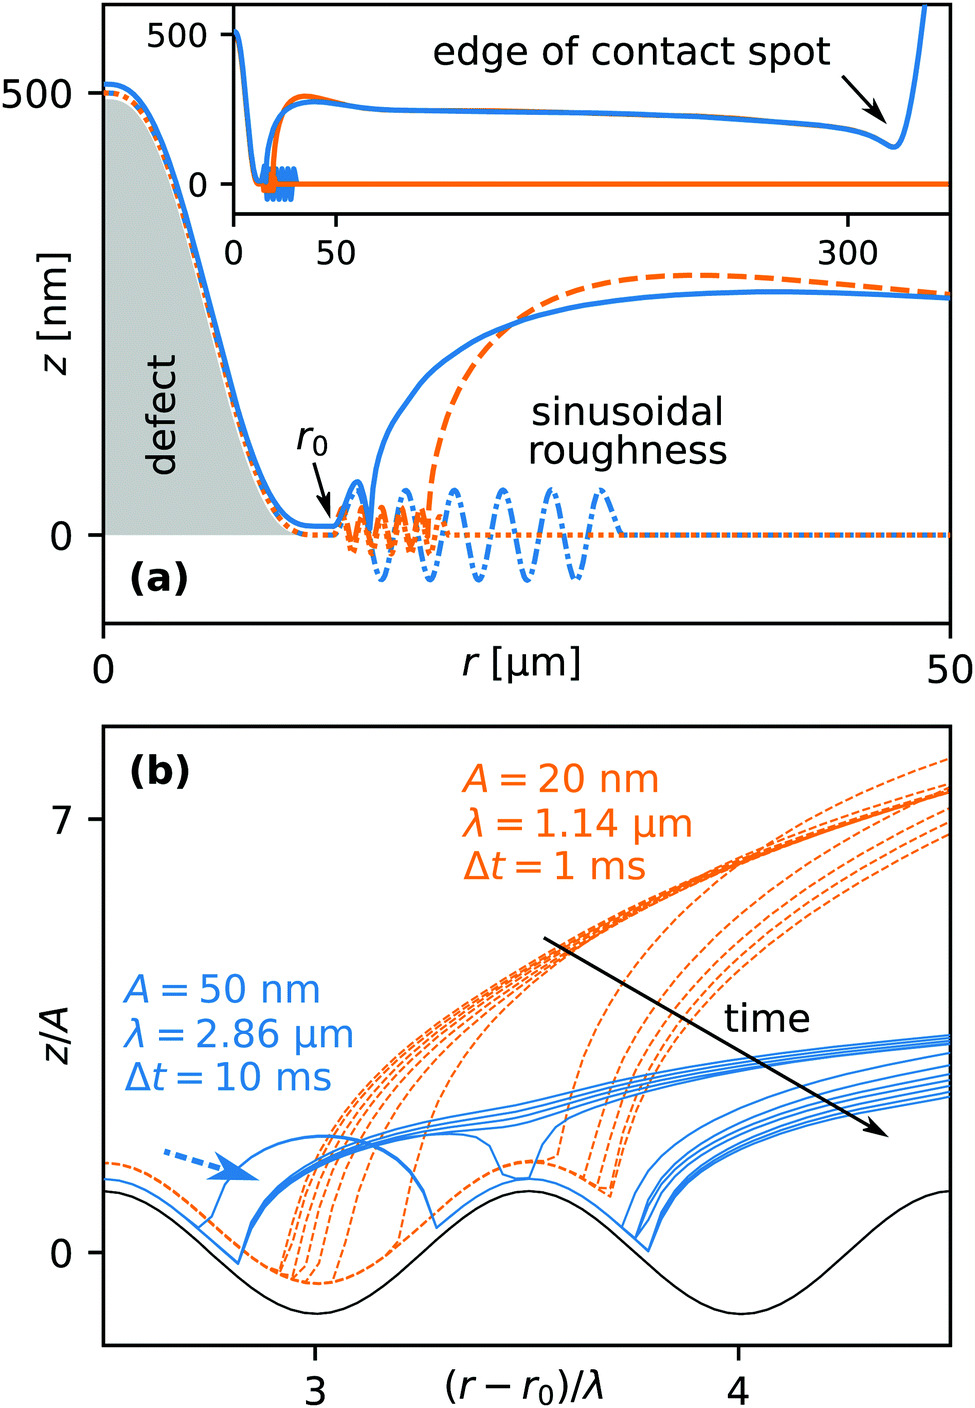
In order to study the effects of surface roughness we considered a two dimensional axisymmetric system for computational efficiency. We introduced a sinusoidal surface profile of the rigid substrate with wavelength λ and amplitude A. In order to nucleate a dry spot and obtain a receding contact line, we introduce a topological defect centered around r = 0 shown by the gray shaded area in Fig. 11(a). Dotted and dash-dotted lines indicate the sinusoidal surface profiles for two different sets of values of λ and A. In order to speed up calculations, the pattern starts at a certain radial position r0 and extends only over a few wavelengths. The solid and dashed lines correspond to the z-position of the elastomer–liquid interface. The inset shows the entire contact spot from its center to its edge.
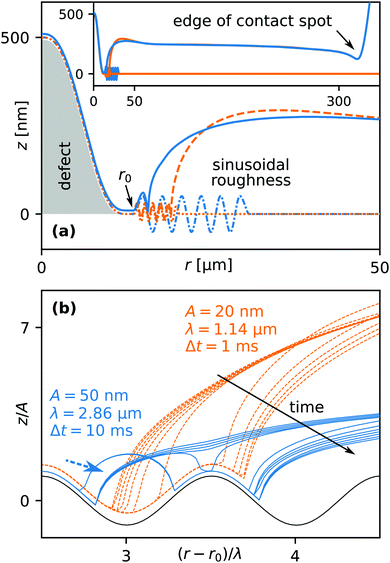 |
| | Fig. 11 Simulated liquid film thickness profiles for non-flat substrate topologies. (a) The dash-dotted blue line shows the substrate topology, with a sinusoidal pattern of amplitude A = 50 nm and wavelength λ = 2.86 mm. The solid blue line represents the z-position of the elastomer–liquid interface. The dashed and dotted orange lines represent a similar simulation with A = 20 nm and the same A/λ ratio. (b) Time evolution of the non-dimensional elastomer–liquid interface profile. The two families of curves represent constant time increments of either 1 or 10 ms. | |
Fig. 11(b) shows the time evolution of the non-dimensional elastomer–liquid interface profile. The contact line recedes to the right. For clarity, we non-dimensionalized the r and z coordinates using the scales of λ and A in order to collapse the two surface profiles. The two families of curves represent constant time increments of either 1 or 10 milliseconds, corresponding to two different sets of λ and A. In the case of the smaller amplitude (A = 20 nm, dashed orange lines) the contact line moves continuously, though at a non-constant speed vcl. vcl is considerably faster when moving up a slope compared to moving down. In the case of the larger amplitude (A = 50 nm, solid blue lines), the contact line gets pinned on the descending slope, despite the A/λ aspect ratio being the same as in the first case. The contact line advances by nucleating a secondary dry spot at the adjacent apex of the surface roughness profile. At the same time liquid becomes entrapped in the “valleys”, as indicated by the dashed arrow.
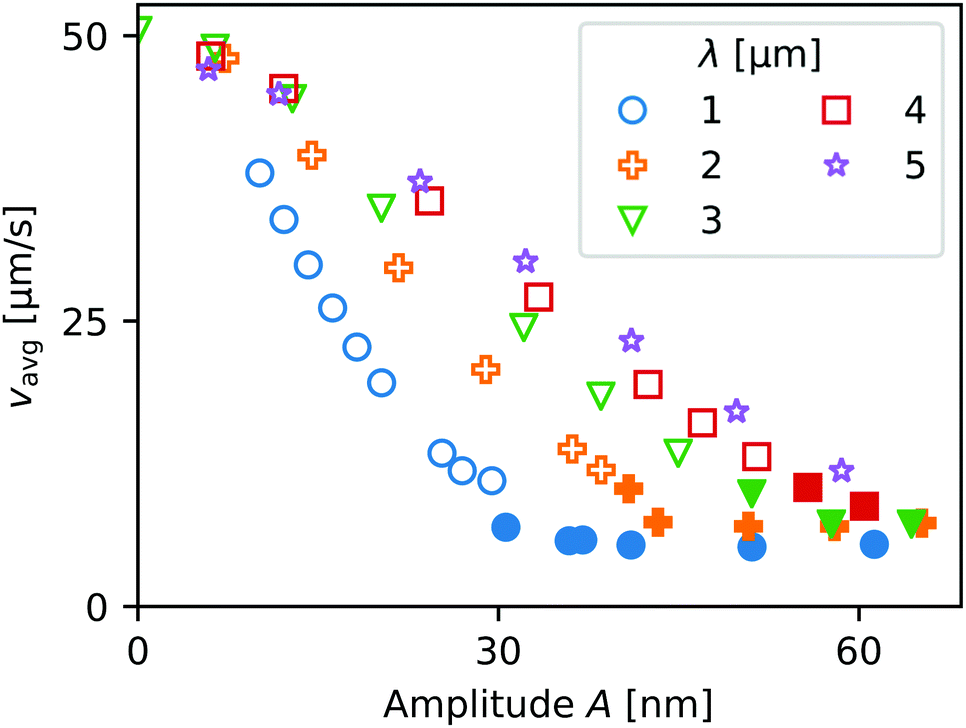
In Fig. 12 is plotted the contact line speed vavg ≡ 〈vcl〉 averaged over two wavelengths of the roughness profile. Filled symbols signify liquid entrapment. The average contact line speed strongly decreases with increasing amplitude A, more rapidly for smaller values of the wavelength λ, i.e. higher aspect ratios A/λ. Due to computational limitations concerning the minimum mesh size, we could not explore sub-micron values of λ. However, it is clear from Fig. 12 that especially for small λ a significant reduction in the average velocity is observed, at least by one order of magnitude. Extrapolating towards sub-micron wavelengths, these results indicate that even with a roughness amplitude so small that it would not be noticeable using optical interferometry, the contact line speed could be reduced by a similar order of magnitude as observed in the experiments in Fig. 3. Due to the limited spatial resolution of our optical setup, the corresponding spatial modulation of the contact line speed vcl could not be resolved and would appear as smooth. Based on these results we hypothesize that the non-hydrodynamic motion of the droplets could be caused by surface roughness.
 |
| | Fig. 12 Average speed of the receding contact line moving across the pattern in Fig. 11(a), as a function of the pattern wavelength λ and amplitude A. Larger amplitudes and smaller wavelengths can slow down the movement by an order of magnitude. Filled points signify liquid entrapment. | |
6.2 Influence of uncrosslinked chains
Despite the 22.5% mass loss after 2-propanol treatment, the observed droplet dynamics remained the same. The data points in Fig. 7 overlap with the ones obtained with not-treated samples. We conclude that uncrosslinked chains do not influence the droplet motion in our case. In contrast, in ref. 29 the uncrosslinked chains had a drastic effect on sessile droplet motion. We believe that this qualitative difference might be related to the much higher interfacial tension of the liquids (glycerol–water mixtures) used by these authors as well as the presence of a deformable liquid–air interface, which is absent in our case.
7 Conclusion
We have studied the escape dynamics of liquid droplets from the contact zone of an elastic hemisphere pressed into a soft solid layer. The driving force of the motion is the radial pressure gradient. Upon reaching the edge of the contact spot, droplets merge with the outer bulk liquid either in a continuous or discontinuous fashion. In the first case a single ‘complete’ coalescence event is observed, whereas in the latter case a cascade of partial coalescence events occurs. Numerical simulations could reproduce the shape and escape dynamics of the non-cascading droplets qualitatively well. The coalescence time of these droplets are well described by a simple analytical model.
Droplets that undergo a coalescence cascade tend to move much slower than droplets that merge in a single coalescence event. Moreover, the speed of motion of the cascading droplets is not proportional to the local pressure gradient. Using numerical simulations, we have investigated surface roughness and spatial modulations of Young's modulus and the spreading parameter as potential mechanisms that could slow the droplets down. As for the latter two, we generally found that for experimentally conceivable parameter variations, the reduction in contact line speed was far less than two orders of magnitude. In contrast, surface roughness induced a speed reduction comparable with the experimental observations and is thus a viable candidate for the responsible mechanism. Solvent extraction of uncrosslinked chains in the elastomer did not have an impact on the observed droplet dynamics.
Conflicts of interest
There are no conflicts of interest to declare.
Acknowledgements
We would like to thank Boija He for his help with surface charge measurements. We would like to thank an anonymous referee for pointing our attention towards ref. 29 and the significance of uncrosslinked polymer chains on the dynamics of adhering droplets. This project has received funding from the European Union's Horizon 2020 research and innovation programme under the Marie Sklodowska-Curie grant agreement No. 642861.
References
- H. Grogger and M. Weiss, Calculation of the hydroplaning of a deformable smooth-shaped and longitudinally-grooved tire, Tire Sci. Technol., 1997, 25(4), 265–287 CrossRef.
- B. N. J. Persson, U. Tartaglino, O. Albohr and E. Tosatti, Sealing is at the origin of rubber slipping on wet roads, Nat. Mater., 2004, 3(12), 882 CrossRef CAS PubMed.
- B. N. J. Persson, U. Tartaglino, O. Albohr and E. Tosatti, Rubber friction on wet and dry road surfaces: the sealing effect, Phys. Rev. B, 2005, 71(3), 035428 CrossRef.
- J. R. Cho, H. W. Lee, J. S. Sohn, G. J. Kim and J. S. Woo, Numerical investigation of hydroplaning characteristics of three-dimensional patterned tire, Eur. J. Mech. A-Soild, 2006, 25(6), 914–926 CrossRef.
- M. Varenberg and S. N. Gorb, Hexagonal surface micropattern for dry and wet friction, Adv. Mater., 2009, 21(4), 483–486 CrossRef CAS.
- T. F. Fwa, S. S. Kumar, K. Anupam and G. P. Ong, Effectiveness of tire-tread patterns in reducing the risk of hydroplaning, Transp. Res. Rec., 2009, 2094(1), 91–102 CrossRef.
- S. Vincent, A. Sarthou, J. P. Caltagirone, F. Sonilhac, P. Février and C. Mignot,
et al., Augmented Lagrangian and penalty methods for the simulation of two-phase flows interacting with moving solids. Application to hydroplaning flows interacting with real tire tread patterns, J. Comput. Phys., 2011, 230(4), 956–983 CrossRef.
- B. Zheng, X. Huang, W. Zhang, R. Zhao and S. Zhu, Adhesion Characteristics of Tire-Asphalt Pavement Interface Based on a Proposed Tire Hydroplaning Model, Adv. Mater. Sci. Eng., 2018, 5916180 CAS.
- H. F. Bohn and W. Federle, Insect aquaplaning: nepenthes pitcher plants capture prey with the peristome, a fully wettable water-lubricated anisotropic surface, Proc. Natl. Acad. Sci. U. S. A., 2004, 101(39), 14138–14143 CrossRef CAS PubMed.
- T. Nishi, Influence of lubricant properties and contacting velocity on real contact formation between rubber and glass in a contact process, Tribol. Int., 2018, 127, 240–244 CrossRef.
- T. Nishi, Influence of curvature radius, elastic modulus, and contact velocity on real contact formation between rubber hemisphere and glass plate during contact process under a water-lubricated condition, Tribol. Int., 2019, 130, 284–288 CrossRef.
- A. A. Darhuber, S. M. Troian and S. Wagner, Physical mechanisms governing pattern fidelity in microscale offset printing, J. Appl. Phys., 2001, 90(7), 3602–3609 CrossRef CAS.
- D. Kang, E. Lee, H. Kim, Y. M. Choi, S. Lee and I. Kim,
et al., Investigation on synchronization of the offset printing process for fine patterning and precision overlay, J. Appl. Phys., 2014, 115(23), 234908 CrossRef.
- H. M. Sauer, D. Daume and E. Dörsam, Lubrication theory of ink hydrodynamics in the flexographic printing nip, J. Print Media Technol. Res., 2015, 4, 163–172 Search PubMed.
- C. Auner, U. Palfinger, H. Gold, J. Kraxner, A. Haase and T. Haber,
et al., Residue-free room temperature UV-nanoimprinting of submicron organic thin film transistors, Org. Electron., 2009, 10(8), 1466–1472 CrossRef CAS.
- C. Auner, U. Palfinger, H. Gold, J. Kraxner, A. Haase and T. Haber,
et al., High-performing submicron organic thin-film transistors fabricated by residue-free embossing, Org. Electron., 2010, 11(4), 552–557 CrossRef CAS.
- S. J. Choi, D. Tahk and H. Yoon, Spontaneous dewetting-induced residue-free patterning at room temperature, J. Colloid Interface Sci., 2009, 340(1), 74–81 CrossRef CAS PubMed.
- H. Yoon, S. H. Lee, S. H. Sung, K. Y. Suh and K. Char, Mold design rules for residual layer-free patterning in thermal imprint lithography, Langmuir, 2011, 27(12), 7944–7948 CrossRef CAS PubMed.
- H. Yoon, H. Lee and W. B. Lee, Toward residual-layer-free nanoimprint lithography in large-area fabrication, Korea-Aust. Rheol. J., 2014, 26(1), 39–48 CrossRef.
- M. Leitgeb, D. Nees, S. Ruttloff, U. Palfinger, J. Götz and R. Liska,
et al., Multilength scale patterning of functional layers by roll-to-roll ultraviolet-light-assisted nanoimprint lithography, ACS Nano, 2016, 10(5), 4926–4941 CrossRef CAS PubMed.
-
J. N. Israelachvili, Intermolecular and surface forces, Academic Press, 2011 Search PubMed.
- P. Martin, P. Silberzan and F. Brochard-Wyart, Sessile droplets at a solid/elastomer interface, Langmuir, 1997, 13(18), 4910–4914 CrossRef CAS.
- F. Brochard-Wyart and P. G. de Gennes, Dewetting of a water film between a solid and a rubber, J. Phys.: Condens. Matter, 1994, 6(23A), A9 CrossRef CAS.
- P. Martin and F. Brochard-Wyart, Dewetting at soft interfaces, Phys. Rev. Lett., 1998, 80(15), 3296 CrossRef CAS.
- A. Martin, A. Buguin and F. Brochard-Wyart, Dewetting nucleation centers at soft interfaces, Langmuir, 2001, 17(21), 6553–6559 CrossRef CAS.
- A. Martin, O. M. Rossier, A. Buguin, P. Auroy and F. Brochard-Wyart, Spinodal dewetting of thin liquid films at soft interfaces, Eur. Phys. J. E, 2000, 3(4), 337–341 CrossRef CAS.
- I. N. Sneddon, The distribution of stress in the neighbourhood of a crack in an elastic solid, Proc. R. Soc. London, Ser. A, 1946, 187(1009), 229–260 CrossRef.
- M. Chudak, J. S. Kwaks, J. H. Snoeijer and A. A. Darhuber, Non-axisymmetric elastohydrodynamic solid-liquid-solid dewetting: experiments and numerical modelling, Eur. Phys. J. E, 2020, 43(1), 2 CrossRef PubMed.
- A. Hourlier-Fargette, A. Antkowiak, A. Chateauminois and S. Neukirch, Role of uncrosslinked chains in droplets dynamics on silicone elastomers, Soft Matter, 2017, 13(19), 3484–3491 RSC.
- H. R. Hertz, Über die Berührung fester elastischer Körper, J. Pure Appl. Math., 1882, 92, 156–171 Search PubMed.
- K. L. Johnson, K. Kendall and A. D. Roberts, Surface energy and the contact of elastic solids, Proc. R. Soc. London, Ser. A, 1971, 324(1558), 301–313 CrossRef CAS.
- G. E. Charles and S. G. Mason, The mechanism of partial coalescence of liquid drops at liquid/liquid interfaces, J. Colloid Sci., 1960, 15(2), 105–122 CrossRef CAS.
- S. T. Thoroddsen and K. Takehara, The coalescence cascade of a drop, Phys. Fluids, 2000, 12(6), 1265–1267 CrossRef CAS.
- G. A. Bach, D. L. Koch and A. Gopinath, Coalescence and bouncing of small aerosol droplets, J. Fluid Mech., 2004, 518, 157–185 CrossRef CAS.
- E. M. Honey and H. P. Kavehpour, Astonishing life of a coalescing drop on a free surface, Phys. Rev. E, 2006, 73(2), 027301 CrossRef CAS PubMed.
- X. Chen, S. Mandre and J. J. Feng, Partial coalescence between a drop and a liquid-liquid interface, Phys. Fluids, 2006, 18(5), 051705 CrossRef.
- F. Blanchette and T. P. Bigioni, Partial coalescence of drops at liquid interfaces, Nat. Phys., 2006, 2(4), 254 Search PubMed.
- T. Gilet, K. Mulleners, J. P. Lecomte, N. Vandewalle and S. Dorbolo, Critical parameters for the partial coalescence of a droplet, Phys. Rev. E, 2007, 75(3), 036303 CrossRef CAS PubMed.
- F. Blanchette and T. P. Bigioni, Dynamics of drop coalescence at fluid interfaces, J. Fluid Mech., 2009, 620, 333–352 CrossRef.
- F. H. Zhang, E. Q. Li and S. T. Thoroddsen, Satellite formation during coalescence of unequal size drops, Phys. Rev. Lett., 2009, 102(10), 104502 CrossRef CAS PubMed.
- B. Ray, G. Biswas and A. Sharma, Generation of secondary droplets in coalescence of a drop at a liquid-liquid
interface, J. Fluid Mech., 2010, 655, 72–104 CrossRef.
- I. S. Klyuzhin, F. Ienna, B. Roeder, A. Wexler and G. H. Pollack, Persisting water droplets on water surfaces, J. Phys. Chem. B, 2010, 114(44), 14020–14027 CrossRef CAS PubMed.
- H. P. Kavehpour, Coalescence of drops, Annu. Rev. Fluid Mech., 2015, 47, 245–268 CrossRef.
- A. Fakhari, D. Bolster and L. S. Luo, A weighted multiple-relaxation-time lattice Boltzmann method for multiphase flows and its application to partial coalescence cascades, J. Comput. Phys., 2017, 341, 22–43 CrossRef CAS.
- J. E. Glass, R. D. Lundberg and F. E. Bailey Jr, The effect of polymeric hydrocolloids on the partial coalescence of liquid drops at liquid-liquid interfaces, J. Colloid Interface Sci., 1970, 33(4), 491–507 CrossRef CAS.
- J. D. Sartor and C. E. Abbott, Some details of coalescence and charge transfer between freely falling drops in different electrical environments, J. Rech. Atmos., 1972, 6, 479–493 Search PubMed.
- H. T. Ochs III, K. V. Beard, R. R. Czys, N. F. Laird, D. E. Schaufelberger and D. J. Holdridge, Collisions between small precipitation drops. Part I: laboratory measurements of bounce, coalescence, and temporary coalescence, J. Atmos. Sci., 1995, 52(12), 2258–2275 CrossRef.
- K. V. Beard and H. T. Ochs III, Collisions between small precipitation drops. Part II: formulas for coalescence, temporary coalescence, and satellites, J. Atmos. Sci., 1995, 52(22), 3977–3996 CrossRef.
- W. D. Ristenpart, J. C. Bird, A. Belmonte, F. Dollar and H. A. Stone, Non-coalescence of oppositely charged drops, Nature, 2009, 461(7262), 377 CrossRef CAS PubMed.
- K. V. Beard, H. T. Ochs III and S. Liu, Collisions between small precipitation drops. Part III: laboratory measurements at reduced pressure, J. Atmos. Sci., 2001, 58(11), 1395–1408 CrossRef.
- P. Yue, C. Zhou and J. J. Feng, A computational study of the coalescence between a drop and an interface in Newtonian and viscoelastic fluids, Phys. Fluids, 2006, 18(10), 102102 CrossRef.
- X. Chen, S. Mandre and J. J. Feng, An experimental study of the coalescence between a drop and an interface in Newtonian and polymeric liquids, Phys. Fluids, 2006, 18(9), 092103 CrossRef.
- N. P. Kuznicki, M. Krasowska, P. M. F. Sellaperumage, Z. Xu, J. Masliyah and J. Ralston,
et al., Cascade partial coalescence phenomena at electrolyte-oil interfaces and determination of bounds for the surface potential, Soft Matter, 2013, 9(17), 4516–4523 RSC.
- E. de Malmazet, F. Risso, O. Masbernat and V. Pauchard, Coalescence of contaminated water drops at an oil/water interface: influence of micro-particles, Colloids Surf., A, 2015, 482, 514–528 CrossRef CAS.
- F. Blanchette, L. Messio and J. W. M. Bush, The influence of surface tension gradients on drop coalescence, Phys. Fluids, 2009, 21(7), 072107 CrossRef.
- Y. Amarouchene, G. Cristobal and H. Kellay, Noncoalescing drops, Phys. Rev. Lett., 2001, 87(20), 206104 CrossRef CAS PubMed.
- D. Fell, M. Sokuler, A. Lembach, T. F. Eibach, C. Liu and E. Bonaccurso,
et al., Drop impact on surfactant films and solutions, Colloid Polym. Sci., 2013, 291(8), 1963–1976 CrossRef CAS.
- D. W. Martin and F. Blanchette, Simulations of surfactant effects on the dynamics of coalescing drops and bubbles, Phys. Fluids, 2015, 27(1), 012103 CrossRef.
- T. Dong, W. H. Weheliye, P. Chausset and P. Angeli, An experimental study on the drop/interface partial coalescence with surfactants, Phys. Fluids, 2017, 29(10), 102101 CrossRef.
- S. Shim and H. A. Stone, Damped coalescence cascade of liquid drops, Phys. Rev. Fluids, 2017, 2(4), 044001 CrossRef.
- K. Haldar, S. Chakraborty and S. Chakraborty, Influence of Marangoni stress on the variation in number of coalescence cascade stages, Can. J. Chem. Eng., 2019, 97(4), 983–994 CrossRef CAS.
- C. Berendsen, C. Kuijpers, J. Zeegers and A. Darhuber, Dielectrophoretic deformation of thin liquid films induced by surface charge patterns on dielectric substrates, Soft Matter, 2013, 9(19), 4900–4910 RSC.
- B. He and A. A. Darhuber, Electrical surface charge patterns induced by droplets sliding over polymer and photoresist surfaces, J. Micromech. Microeng., 2019, 29(10), 105002 CrossRef CAS.
Footnote |
| † Electronic supplementary information (ESI) available: Atomic force microscope measurements of the surface of a typical substrate (pdf). See DOI: 10.1039/c9sm01992h |
|
| This journal is © The Royal Society of Chemistry 2020 |
Click here to see how this site uses Cookies. View our privacy policy here. 
 Open Access Article
 This Open Access Article is licensed under a Creative Commons Attribution-Non Commercial 3.0 Unported Licence
 a,
Jesse S.
Kwaks
a,
Jacco H.
Snoeijer
ab and
Anton A.
Darhuber
a,
Jesse S.
Kwaks
a,
Jacco H.
Snoeijer
ab and
Anton A.
Darhuber

 , we find
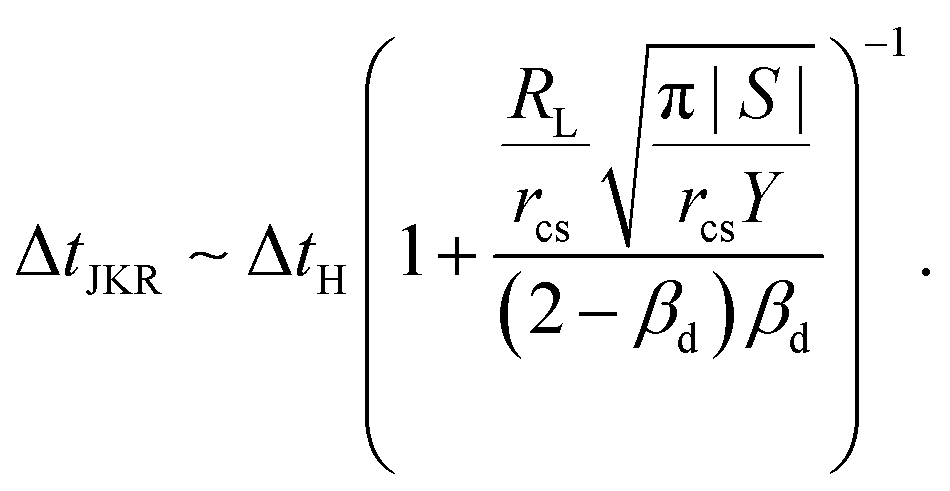


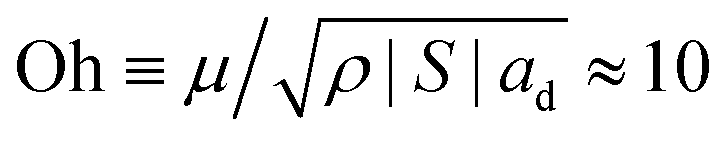 , therefore capillary waves are not present, as the system is strongly dominated by viscous forces. Glass et al. studied the effect of water-soluble polymers on coalescence cascades of organic liquid drops at an organic liquid–water interface.45 Sartor and Abbott and Beard et al. considered the effect of dissimilar electrical droplet charges on the coalescence of colliding droplets and found that charge differences promote complete coalescence.46–48 Ristenpart et al. studied the droplet rebound from a liquid–liquid interface subject to an applied perpendicular electric field.49 Beard et al. showed that a reduction in air pressure promoted contact, thereby reducing the likelihood of bouncing and increasing that of permanent coalescence.50 Feng et al. investigated the effect of non-Newtonian rheology on the coalescence dynamics.51,52 When either the drop or the surrounding phase is a polymer solution, viscoelasticity tends to delay the break-up of secondary drops and can suppress partial coalescence altogether, as large tensile polymer stresses resist the stretching and thinning of the fluid neck. Kuznicki et al. considered the effect of electrolyte concentration on coalescence cascades of oil droplets.53 De Malmazet et al. showed that the presence of micro-particles reduces drop lifetimes and promotes coalescence.54 Blanchette et al. studied the influence of solutocapillary Marangoni stresses on drop coalescence.55 Surfactants can enhance or weaken partial coalescence effects, depending on the concentrations and the induced surface elasticity.56–61