 Open Access Article
Creative Commons Attribution 3.0 Unported Licence
Dynamical self-assembly of dipolar active Brownian particles in two dimensions
Guo-Jun
Liao
 *a,
Carol K.
Hall
 b and
Sabine H. L.
Klapp
*a
aInstitut für Theoretische Physik, Technische Universität Berlin, Hardenbergstr. 36, D-10623 Berlin, Germany. E-mail: guo-jun.liao@campus.tu-berlin.de; klapp@physik.tu-berlin.de
bDepartment of Chemical & Biomolecular Engineering, North Carolina State University, Raleigh, NC 27695, USA
First published on 24th February 2020
Abstract
Based on Brownian Dynamics (BD) simulations, we study the dynamical self-assembly of active Brownian particles with dipole–dipole interactions, stemming from a permanent point dipole at the particle center. The propulsion direction of each particle is chosen to be parallel to its dipole moment. We explore a wide range of motilities and dipolar coupling strengths and characterize the corresponding behavior based on several order parameters. At low densities and low motilities, the most important structural phenomenon is the aggregation of the dipolar particles into chains. Upon increasing the particle motility, these chain-like structures break, and the system transforms into a weakly correlated isotropic fluid. At high densities, we observe that the motility-induced phase separation is strongly suppressed by the dipolar coupling. Once the dipolar coupling dominates the thermal energy, the phase separation disappears, and the system rather displays a flocking state, where particles form giant clusters and move collective along one direction. We provide arguments for the emergence of the flocking behavior, which is absent in the passive dipolar system.
1 Introduction
Self-propelled particles are capable of converting energy from an internal source or the surroundings into their own active motion.1,2 It is now well established that active motion of individual particles, combined with different types of interactions among these particles, can lead to remarkable collective behavior. For example, repulsive interactions alone can generate the so-called motility-induced phase separation, where large, densely packed clusters coexist with freely moving particles.3 A standard model describing this non-equilibrium phase transition is that of active Brownian particles, where each particle moves with a constant propulsion speed along a direction subject to white noise, and the interactions are purely steric and isotropic. Clearly, one could expect more complex behavior in active systems with anisotropic interactions. This situation has been investigated by a large number of theoretical and simulation studies.4–7 A famous example in this direction is the Vicsek model, where active, point-like particles interact such that they tend to align their velocities with those of their neighbors. The resulting collective behavior includes traveling bands6 and flocking.8 A further representative system is a suspension of active Brownian particles with polar interactions favoring parallel orientations of the velocities irrespective of the spatial configuration. This system displays a state with moving lanes and bands even at low densities, where conventional active Brownian particles do not show significant behavior.9 Further, at high densities, the polar coupling favors motility-induced phase separation compared to the non-polar case.10In most studies of active systems with anisotropic interactions, they are assumed to be of short range.11 Less effort has been spent on active systems involving long-range anisotropic interactions, such as dipole–dipole interactions stemming from intrinsic (permanent) dipole moments or dipoles induced by an electric or magnetic field.12 A notable feature of dipolar interactions is that they depend not only on the orientations of the two involved particles, but also on their configuration in space. Specifically, two particles with point dipoles at their center tend to align head-to-tail, where the arrowhead of one dipole moment is directed toward the arrowtail of the other dipole. In contrast, particles configured side by side favor antiparallel alignment. Due to this complexity, one would expect a system of dipolar active particles to show macroscopic structures significantly different from active models with simple polar interactions, such as the Vicsek model8 and its variants.
There are some recent studies, which have focused particularly on the dynamics of dipolar active colloids. For example, ref. 13 and 14 have studied the structural transformation of small dipolar clusters under the impact of activity starting from different (meta)stable configurations, either neglecting13 or including14 hydrodynamic interactions. Another example is a system of spherical, ferromagnetic rollers confined to a fluctuating surface. Here it has been shown, both, experimentally and in simulations, that these particles can exhibit swarming or vortex patterns when energized by a vertical alternating field.15 Owing to the interplay between self-propulsion and dipolar interactions, these vortices persist even on a flat surface.16 In nature, magnetotactic bacteria are known to sense the earth's magnetic field and move along or against the field direction.17–19 Experiments have observed that these bacteria, when confined in a microfluidic channel and placed under an external magnetic field, display clustering behavior along the channel.20 The underlying mechanism of this clustering instability was also investigated analytically and in simulations.21 We also mention dipole-like, active Janus particles with two screened electric charges in each hemisphere. It is found that these particles can self-organize into fingerprint-like patterns at high densities.22 Moreover, an external electric or magnetic field can induce two point dipoles in the respective hemispheres of a Janus particle and thereby further complicate the interactions between particles. By fine-tuning the interactions, it has been reported that the external field can be used to control the collective behavior of Janus particles.23,24 However, these latter models involve even more complex anisotropic interactions as compared to the purely dipolar case. Indeed, the collective behavior of large ensembles of the simplest dipolar active model, that is, dipolar active Brownian particles, is not yet explored. This is the motivation for the present work.
Specifically, we present Brownian Dynamics simulation results for the dynamical self-assembly of a two-dimensional system of active particles, where each particle has a permanent point dipole moment oriented in the plane. In addition, each particle is subject to a self-propulsion force, which is directed along the dipole, as well as to thermal noise. We investigate the collective behavior of our model system for three density regimes, considering a wide range of motilities and dipolar coupling strengths. Our model can be realized, e.g., by Janus particles with a magnetic material coated on one of the hemispheres.25,26 In that case, both the dipole moment and the propulsion force of the Janus particle are directed along its symmetric axis.
For all three densities we present state diagrams illustrating the complex interplay between essentially three phenomena: chain formation (which already occurs in the passive case), motility-induced phase separation, and polar ordering.
The remainder of this paper is organized as follows. In Section 2 we present our model of dipolar active particles and the simulation details, as well as the target quantities and order parameters investigated. Based on analysis of these quantities for a range of parameters, we discuss the collective behavior of the model system in Section 3. Finally, in Section 4 we summarize our findings.
2 Model and methods of investigation
2.1 Model system
Our dipolar active system consists of N disk-shaped Brownian particles with diameter σ dispersed in a monolayer in the xy-plane. Each particle carries a fluctuating point dipole moment μi (i = 1,…,N) located at its center. For passive monolayers of dipolar disks, it is well established that the particles tend to orient along in-plane directions to form chains and rings,27–31 or dense ordered states,27,32–34 if the dipolar interactions are sufficiently strong. Having this in mind, we assume beforehand that μi lies in the xy-plane, i.e., fluctuations in z-direction are neglected. To model the self-propulsion, we assume that each particle is subject to a force Fi, which has a constant magnitude and is directed along μi at each instant of time.The pair potential between particles located at positions ri and rj (i ≠ j) is of the form
| upair(rij,μi,μj) = usr(rij) + udd(rij,μi,μj), | (1) |
 | (2) |
In this study, we set the length unit to be σ and fix the repulsive strength ε* = βε = 10, where the thermal energy, β−1 = kBT, is set to be the energy unit (with kB being Boltzmann's constant and T being the temperature). This potential is truncated at the cut-off radius rc = 21/6σ, such that eqn (2) and its derivative vanish to zero continuously at the truncation point. The last term in eqn (1) represents the (long-range) dipole–dipole interaction. Its functional form is given by
 | (3) |
We define the dipolar coupling strength as λ = βμ2σ−3 with μ being the magnitude of a dipole moment, i.e., μi = μ![[small mu, Greek, circumflex]](https://www.rsc.org/images/entities/b_i_char_e0b3.gif) i.
i.
2.2 Brownian dynamics simulation
To investigate the system's dynamical behavior, we perform conventional Brownian Dynamics (BD) simulations without hydrodynamic interactions. The motion of the ith particle is then determined by the coupled Langevin equations35 for its position ri and orientation êi = (cos![[thin space (1/6-em)]](https://www.rsc.org/images/entities/char_2009.gif) ψi,sin
ψi,sin![[thin space (1/6-em)]](https://www.rsc.org/images/entities/char_2009.gif) ψi)T,
ψi)T,ṙi = β![[Doublestruck D]](https://www.rsc.org/images/entities/char_e167.gif) [F0êi − ∇riUi + ξi(t)], [F0êi − ∇riUi + ξi(t)], | (4) |
![[small psi, Greek, dot above]](https://www.rsc.org/images/entities/i_char_e0a5.gif) i = βDr[−∂ψiUi + Γi(t)], i = βDr[−∂ψiUi + Γi(t)], | (5) |
 | (6) |
![[Doublestruck D]](https://www.rsc.org/images/entities/char_e167.gif) = Dt
= Dt![[Doublestruck I]](https://www.rsc.org/images/entities/char_e16c.gif) , where Dt is the (isotropic) translational diffusion constant and
, where Dt is the (isotropic) translational diffusion constant and ![[Doublestruck I]](https://www.rsc.org/images/entities/char_e16c.gif) is the 2 × 2 identity matrix. Correspondingly, Dr denotes the rotational diffusion constant. As described in ref. 36, we find that the relationship between these two diffusion constants of a hard sphere in the low Reynolds number regime is given via Dr = 3Dt/σh2. We also define the diameter of an effective (eff) hard sphere via
is the 2 × 2 identity matrix. Correspondingly, Dr denotes the rotational diffusion constant. As described in ref. 36, we find that the relationship between these two diffusion constants of a hard sphere in the low Reynolds number regime is given via Dr = 3Dt/σh2. We also define the diameter of an effective (eff) hard sphere via . With the repulsive strength ε* = 10 considered in the present system, σeff ≈ 1.07851σ. By choosing σh = σeff, we obtain Dr = 2.57914Dt/σ2.
In eqn (4), the effective propulsion force, which drives the active motion, is given by Fi = F0êi with êi = ![[small mu, Greek, circumflex]](https://www.rsc.org/images/entities/b_i_char_e0b3.gif) i. For simplicity, in the remainder of this work we present the impact of the effective propulsion force via the motility v0 = βDtF0. Finally, the random force ξi(t) and torque Γi(t) for the ith particle are zero-mean Gaussian white noise, which satisfy
i. For simplicity, in the remainder of this work we present the impact of the effective propulsion force via the motility v0 = βDtF0. Finally, the random force ξi(t) and torque Γi(t) for the ith particle are zero-mean Gaussian white noise, which satisfy  and
and  . The angle brackets 〈⋯〉 denote ensemble average, and the symbol ⊗ represents dyadic product.
Eqn (4) and (5) are solved via the Euler–Maruyama method37 with the discrete time step Δt = 2 × 10⁻⁵τ, where τ is the Brownian diffusion time, given by τ = σ2/Dt. We choose a quadratic box with side length Lx = Ly = L, and we use periodic boundary conditions in both directions. In order to treat the long-range dipole–dipole interactions, we employ a two-dimensional (2D) Ewald summation, as outlined in Appendix A.1. The particle number is set to N = 1156, unless otherwise stated. All simulations are started with randomly oriented particles located on a square lattice. A typical run then consists of at least 5 × 10⁵ steps for reaching a steady state, followed by a production period of 5 × 10⁵ steps. The statistical properties of the dipolar particles (see Section 2.3) are measured every 500 steps. The simulations are carried out at three values of the mean area fraction Φ = Nπσeff2/(4L2), where the area of a single particle is defined as πσeff2/4. Specifically, we consider the values Φ = 0.12, Φ = 0.23, and Φ = 0.58 (for the exact values, see note ref. 38). To investigate the impact of activity, we perform simulations at different dimensionless propulsion speeds v0* = v0σ/Dt and various dipolar coupling strengths λ. We note that v0* is indeed the same as the commonly used Péclet number Pe.3,39,40
2.3 Target quantities
In this section we introduce the target quantities which will later be used to characterize the system's behavior. The choice of these quantities is inspired by earlier research on non-dipolar active systems on the one hand, and passive dipolar systems on the other hand.| ϕc = 〈nlcl〉/N, | (7) |
The behavior of the global orientational ordering has also been investigated in models of self-propelled particles with “velocity-alignment” interactions, such as the Vicsek model8 and its variants (see, e.g., ref. 9). In these systems, one observes so-called flocking states, where particles gather together and move collectively toward a certain direction. In the present system, the orientational (dipolar) interaction is more complicated (than the Heisenberg-like interactions in the Vicsek model); still, one could imagine that activity-induced flocking states also emerge in the dipolar active system. To this end we consider (as is common in the literature on flocking states9) the parameter
 | (8) |
To characterize chain formation in the dipolar active system, we use different strategies depending on the density regime considered. The first strategy is adequate for low densities (Φ ≲ 0.23), where the chains can essentially be considered as isolated objects. In this situation, we consider a chain as a set of, at least, three particles which are mutually “bonded.” Specifically, two particles i, j are regarded as “bonded” in the chain, if the following criteria are fulfilled: |rij| ≤ rp, ![[small mu, Greek, circumflex]](https://www.rsc.org/images/entities/b_i_char_e0b3.gif) i·
i·![[small mu, Greek, circumflex]](https://www.rsc.org/images/entities/b_i_char_e0b3.gif) j > 0, and (
j > 0, and (![[small mu, Greek, circumflex]](https://www.rsc.org/images/entities/b_i_char_e0b3.gif) i·rij)(
i·rij)(![[small mu, Greek, circumflex]](https://www.rsc.org/images/entities/b_i_char_e0b3.gif) j·rij) > 0. Here, rp = 1.25σ is set to a distance between the location of the first peak and the first valley of the pair correlation function.58–60 Based on these rules, we quantify the low-density chain formation via the parameter
j·rij) > 0. Here, rp = 1.25σ is set to a distance between the location of the first peak and the first valley of the pair correlation function.58–60 Based on these rules, we quantify the low-density chain formation via the parameter
| ϕp = 〈Np〉/N, | (9) |
At high densities (e.g., Φ = 0.58), the particles are obviously closer to each other, and the string-like structures are no longer isolated. This causes the degree of polymerization ϕp to no longer be appropriate to characterize the self-assembly. To overcome this difficulty, we propose a different order parameter to describe the chain formation quantitatively. The starting point is the dipole–dipole correlation function
 | (10) |
![[small mu, Greek, circumflex]](https://www.rsc.org/images/entities/b_i_char_e0b3.gif) i and
i and  , respectively. To extract the angular dependence at short distances, we transform the Cartesian coordinates employed in eqn (10) to polar coordinates by using
  and θ = atan2(−r⊥,r‖), and compute the function
 | (11) |
Here, the distance rs is set to rs = L/8 ≈ 5σ such that rs is much smaller than the half of the box size (which corresponds to the length scale of the periodic boundary conditions). In the presence of chain-like structures with head-to-tail alignment of neighboring particles, we expect the angular correlation function, ![[g with combining tilde]](https://www.rsc.org/images/entities/i_char_0067_0303.gif) μ(θ), to display positive maxima both, in front of and behind the reference particle (i.e., at θ = 0 or π). In contrast, the dipole moments of the particles on the right- and left-hand side of the reference particle should remain rather uncorrelated (i.e.,
μ(θ), to display positive maxima both, in front of and behind the reference particle (i.e., at θ = 0 or π). In contrast, the dipole moments of the particles on the right- and left-hand side of the reference particle should remain rather uncorrelated (i.e., ![[g with combining tilde]](https://www.rsc.org/images/entities/i_char_0067_0303.gif) μ(θ) ≈ 0 for θ = π/2 or −π/2). With this picture in mind, we measure the quantity
μ(θ) ≈ 0 for θ = π/2 or −π/2). With this picture in mind, we measure the quantity
Z = ![[g with combining tilde]](https://www.rsc.org/images/entities/i_char_0067_0303.gif) μ(θmax) − μ(θmax) − ![[g with combining tilde]](https://www.rsc.org/images/entities/i_char_0067_0303.gif) μ(θmin), μ(θmin), | (12) |
![[g with combining tilde]](https://www.rsc.org/images/entities/i_char_0067_0303.gif) μ(θ) reaches its maximum and minimum, respectively, at θ = θmax and θ = θmin. By properly choosing a threshold value Zthres, we define the dipolar particles as exhibiting chain-like structure when Z ≥ Zthres. As will be discussed in more detail in Section 2.3.3, a reasonable value for Zthres at Φ = 0.58 is Zthres = 0.17.
μ(θ) reaches its maximum and minimum, respectively, at θ = θmax and θ = θmin. By properly choosing a threshold value Zthres, we define the dipolar particles as exhibiting chain-like structure when Z ≥ Zthres. As will be discussed in more detail in Section 2.3.3, a reasonable value for Zthres at Φ = 0.58 is Zthres = 0.17.
3 Simulation results
Based on the target quantities described in Section 2.3, we can classify the states observed in our BD simulations performed at three densities and at various values of the motility v0* and the dipolar coupling strength λ. In the following Section 3.1–3.3 we discuss, for each density, the state diagram in the (v0*, λ) plane. Specifically, we identify five states whose characteristics are summarized in Table 1.| State | Clustering | Orientational ordering | Chain formation | |
|---|---|---|---|---|
| Φ ≲ 0.23 | Φ = 0.58 | |||
| Homogeneous, isotropic fluids | ϕ c ≤ 0.5 | ϕ e ≤ 0.5 | ϕ p ≤ 0.5 | Z ≤ 0.17 |
| Chain-like structures | ϕ c ≤ 0.5 | ϕ e ≤ 0.5 | ϕ p > 0.5 | Z > 0.17 |
| Micro-flocking | ϕ c ≤ 0.5 | ϕ e > 0.5 | — | |
| Macro-flocking | ϕ c > 0.5 | ϕ e > 0.5 | — | |
| Motility-induced clustering | ϕ c > 0.5 | ϕ e ≤ 0.5 | — | |
3.1 The low density regime (Φ = 0.12)
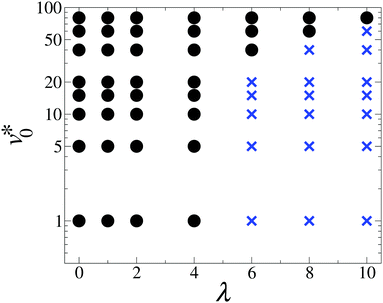
We start by considering the state diagram in the low-density regime, taking Φ = 0.12 as a representative example, see Fig. 1. In the absence of dipolar coupling (λ = 0), non-dipolar active particles at such a low density typically display a homogeneous isotropic fluid state, without significant translational correlations or orientational ordering.3 As long as the dipolar coupling strength remains relatively small (λ ≲ 4), the system still shows the same homogeneous isotropic fluid state for all motilities considered. In contrast, when λ exceeds a value of about 6, the dipolar active particles form chain-like structures provided that the motility is below a critical motility v0,c*(λ), whose value depends on λ. Above this critical motility v0,c*(λ), the chain-like structures found at smaller motilities break, and the system becomes homogeneous and isotropic. As Fig. 1 reveals, v0,c*(λ) increases with increasing λ. As a visualization of the impact of motility on dipolar active particles at a high coupling strength, such as λ = 10, we plot in Fig. 2 representative snapshots. At v0* = 0, nearly all particles are bound into chains and rings, as it is typical for passive dipolar particles in 2D.27 With increasing v0* the ring structures are seemingly more abundant, as can be seen in Fig. 2(a–c). Further increase in v0* eventually causes the chain-like structures to break into fragments of short chains and single particles, as shown in Fig. 2(d).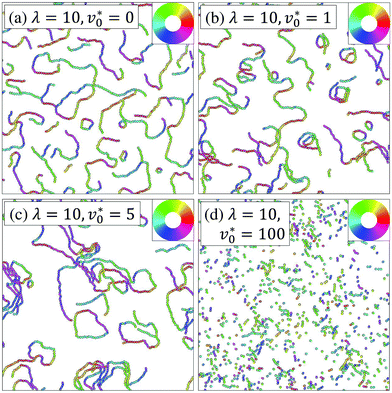 | ||
| Fig. 2 Representative simulation snapshots at Φ = 0.12. Particles are colored according to their dipole orientations as indicated by the color ring in the inset. | ||
To quantitatively characterize the motility-induced destruction of chain-like structures, we plot in Fig. 3 the degree of polymerization ϕp as a function of the motility v0* for various coupling strengths λ. In the absence of dipole–dipole interactions (λ = 0), particles do not self-assembly into chain-like structures, still we observe a slight increase in ϕp [see eqn (9)] upon increasing motilities v0*. This can be attributed to the dynamical clustering of active Brownian particles into small (finite-sized) aggregates.3,36,61 Indeed, if the particles inside these finite-sized clusters fulfill our criteria of being bonded, the order parameter ϕp will be non-zero (yet small), despite the fact that dipole–dipole interactions are absent. Once the dipole–dipole interactions are introduced, pronounced chain-like structures appear for coupling strengths λ ≳ 6 and low motilities v0*, giving rise to large values of ϕp (ϕp ≈ 1). Upon an increase in the motility, the degree of polymerization ϕp gradually decreases, reflecting that the self-propulsion opposes the formation of chain-like structures. This behavior resembles that seen in passive, dilute systems of self-assembled dipolar particles, when the temperature is increased.62 In this sense, the particle motility in the active dipolar system may be viewed as an analog to the temperature in the passive system.
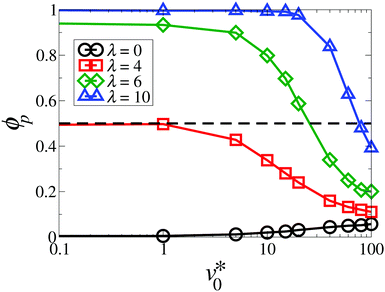 | ||
| Fig. 3 Degree of polymerization ϕp as a function of the motility v0* at Φ = 0.12 for the coupling strength λ = 0 (black circles), 4 (red squares), 6 (green diamonds), and 10 (blue triangles). The dashed horizontal line at ϕp = 0.5 marks our criterion for a state with chain-like structures (see Table 1). The solid lines are guides to the eye. | ||
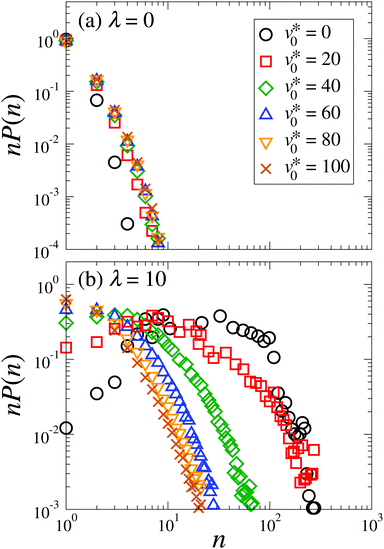
The degree of polymerization ϕp only describes the chaining behavior globally. To supplement our analysis of chain formation, we measure the chain size distribution function P(n), which represents the probability that a randomly selected chain consists of n particles. In the presence of chain formation, the simulated systems usually contain several long chains and many short chains, such that P(n) becomes very small at large n. Therefore, we plot in Fig. 4 the chain size distribution weighted by n, where nP(n) is proportional to the probability that a randomly selected particle belongs to a chain with a size n. As seen in Fig. 4(a), the weighted distribution curves of non-dipolar particles vanish at around a chain size n ≲ 10, and the values slightly increase with increasing motilities. This is consistent with the aforementioned dynamical clustering. The corresponding functions at large dipolar coupling strengths (λ = 10) look very different, as shown in Fig. 4(b). Here, we observe a broad peak between 10 ≲ n ≲ 100 at v0* = 0, reflecting formation of long chains. Upon an increase in the motility, this peak is gradually shifted to a smaller chain size. Finally, this peak disappears once v0* ≳ 60. This suggests a vanishing of chains with the most probable size at large values of v0*.
Inspecting again Fig. 2(d) we see that even at the largest coupling strength considered, the dipole moments do not align on a length scale comparable to that of the simulation box, regardless of the values of v0*. In other words, there is no pronounced global orientational order. Indeed, through measuring the orientational order parameter ϕe, we confirm that ϕe remains small (ϕe < 0.5) for the parameter combinations explored in Fig. 1, indicating that the systems are globally isotropic at low densities.
3.2 The intermediate density regime (Φ = 0.23)
At the density Φ = 0.23, the state diagram (see Fig. 5) at small and intermediate motilities (v0* ≲ 20) is very similar to that at Φ = 0.12 (see Fig. 1): For weakly coupled systems (λ ≲ 3), we observe a homogeneous and isotropic fluid state, whereas strong dipolar coupling leads to chain-like structures. This is visualized by the simulation snapshots presented in Fig. 6(a) and (c). For these “nearly passive” systems, the main difference compared to the dilute systems in Fig. 1 is that the change from the homogeneous isotropic fluid state into the chain-like state occurs at a somewhat smaller value of λ. This is plausible, because the higher density leads to a smaller mean separation between the particles and thus, to a higher probability for chain formation.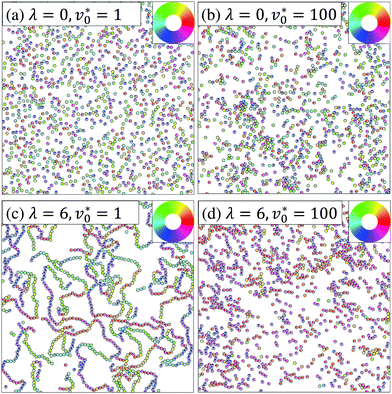 | ||
| Fig. 6 Representative simulation snapshots at Φ = 0.23. Particles are colored according to their orientations as indicated by the color ring in the inset. | ||
We now turn to the impact of the motility. At small values of λ, an increase in v0* toward high values leads to the formation of finite-sized clusters [see Fig. 6(b)] which are, however, not stable. Thus, the system remains homogeneous and isotropic on average. This finding is consistent with earlier research on active Brownian particles. In particular, the phenomenon of motility-induced phase separation, accompanied by formation of “giant” clusters (ϕc ≈ 1), is known to occur only at higher densities.3 As Fig. 5 reveals, the picture changes if the dipolar coupling becomes larger. Consider, e.g., the case λ = 6. Increasing the motility from zero, the chain-like structures observed at small v0* break [see Fig. 6(c)], and the particles instead form small clusters characterized by the same orientation [see Fig. 6(d)]. More quantitatively, the clustering parameter ϕc remains small (ϕc < 0.5) but the orientational order parameter ϕe reaches values above 0.5.
The full behavior of the orientational order parameter ϕe as function of v0* is shown in Fig. 7. For strongly coupled systems (λ ≥ 3), the order parameter abruptly changes from (essentially) zero to large values at a “critical” motility v0,c*(λ) ≈ 20. We take this as an indication for a motility-induced formation of ordered, yet small, clusters. According to Table 1, this is characteristic of a “micro-flocking” state. We recall that, for active particles, the development of average alignment between neighboring particles implies that they move along the same direction. To explore whether these small clusters are indeed “microscopic” structures, we measured the cluster size distribution. It turns out that the characteristic cluster size n0 does not scale up with the system size N (see the detailed analysis in Appendix A.2).
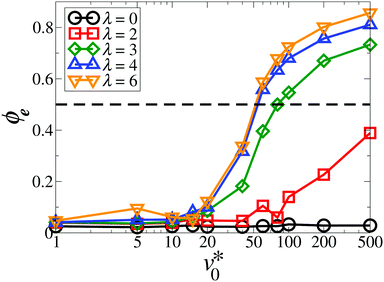 | ||
| Fig. 7 Global polarization ϕe as a function of the motility v0* at Φ = 0.23 for the coupling strength λ = 0 (black circles), 2 (red squares), 3 (green diamonds), 4 (blue triangles up), and 6 (orange triangles down). The dashed line indicates the value corresponding to the emergence of flocking states (see Table 1). The solid lines are guides to the eye. | ||
Inspecting Fig. 7 again, it is found that for systems at an intermediate coupling strength λ = 2, the order parameter ϕe gradually increases from zero as v0* ≳ 100, suggesting that the “micro-flocking” state might still appear. However, further increase in v0* requires to employ even smaller simulation time steps Δt < 2 × 10⁻⁵τ, so as to prevent the numerical instability. Combining this aspect with the time-consuming Ewald summation, it turns out that the simulations become computationally unfeasible for investigating the flocking state transition at small dipolar coupling strengths (λ < 3).
A behavior similar to the “micro-flocking” state has been previously observed in systems of active Brownian disks with polar alignment.9 Indeed, the density Φ = 0.23 considered here is close to the effective packing fraction ϕ* = 0.256 defined in ref. 9, where a comparable state with ‘microscopic’ polar clusters has been discovered at high motilities and intermediate polar coupling. Upon further increase in polar coupling, the system in ref. 9 displays macroscopic structures, such as moving patterns of bands or lanes. Here, we did not find such patterns in the parameter range explored. In this context, we also mention a state observed in the Vicsek model at low densities and low noise (yielding strong alignment).8
In this state, the point-like particles form small groups within which the particles move together along one (random) direction. However, the system does not show global ordering. In both of these models, i.e., active polar disks and the Vicsek model, the particles favor alignment of the propulsion direction with their neighbors, independent of their relative positions. This is different from the particles considered here whose interaction depends not only on the relative alignment but also on their configuration.
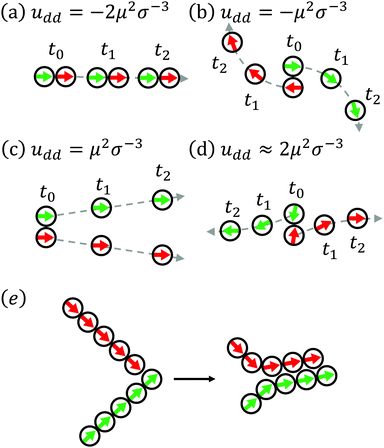
In order to gain a deeper insight into the flocking behavior of the present system, we draw in Fig. 8(a–d) sketches of the motion of two highly motile, strongly coupled particles starting from four representative configurations. The initial configurations (related to time t0) in Fig. 8(a) and (b) are those with the lowest dipolar interaction energy. These configurations are therefore stable (up to thermal fluctuations) in the passive case. Upon switching on the motility (v0* > 0), the particles in the head-to-tail configuration [see Fig. 8(a)] will move along a straight line in the same direction (as already argued in ref. 13), until thermal fluctuations set in. We thus consider this configuration as relatively stable not only in the passive, but also in the active case. This is different in the antiparallel side-by-side configuration depicted in Fig. 8(b) at t0. Here, activity leads to motion in opposite direction, yielding this configuration unstable. In Fig. 8(c), the initial configuration at t0 is energetically unstable. Still, at least for short time, one expects the particles to move together along the same direction until the dipolar repulsion drives them away from one another. Finally, in Fig. 8(d) the initial configuration is a slightly distorted (induced by rotational noise) head-to-head configuration. This leads to a strong dipolar torque which, combined with strong activity, pushes the particles apart. Combining these arguments, we conclude that the most stable configuration for two dipolar active particles is the head-to-tail alignment. While this is similar to the passive case, a major difference is that the antiparallel side-by-side configuration [Fig. 8(b)] breaks immediately apart when the particles become active, yielding this configuration unstable. At low densities, we therefore expect to find short straight chains moving along their individual long axis, consistent with the observation in the Fig. 2(d). Upon an increase in the density, short chains collide with each other more frequently than at low densities. As explained above, antiparallel alignment of the short chains is not stable. Therefore, once two short chains collide, they tend to align along the same direction and, thus, form a dynamical polar cluster, as illustrated in Fig. 8(e). At a sufficiently high density (e.g., Φ ≳ 0.23), the frequent collisions between short chains finally lead to a “micro-flocking” state, in which the dipolar active particles form finite-sized clusters with a polar order [see Fig. 6(d)]. This is fundamentally different from the alignment mechanism in other models such as the ones with ferromagnetic-like interactions, where the configuration at t0 in Fig. 8(c) is kinetically stable.9,10
3.3 The high density regime (Φ = 0.58)
At high densities such as Φ = 0.58, there are three major phenomena interfering with one another: motility-induced phase separation, polar ordering, and chain formation. In the following Sections 3.3.1–3.3.3, we discuss these issues in detail.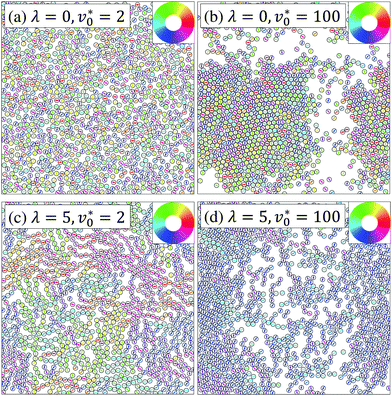 | ||
| Fig. 10 Representative simulation snapshots at Φ = 0.58. Particles are colored according to their orientations as indicated by the color ring in the inset. | ||
The motility-induced phase separation can be explained by a self-trapping mechanism: When a highly motile particle enters into a dense region occupied with other particles, this particle is temporally slowed down due to frequent collisions. Such a slowing-down effect makes this region even denser, thus creating a positive feedback loop which leads to the formation of giant clusters.39 We note that the particle orientations in the two phases are essentially uncorrelated for non-dipolar particles (λ = 0), as seen in Fig. 10(b).
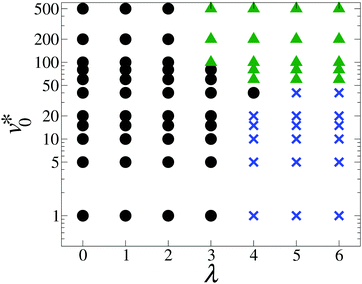
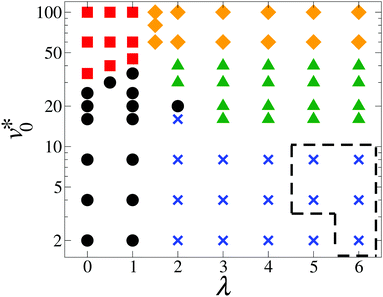
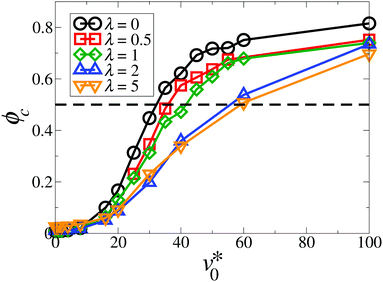
To get a first impression of the impact of dipole–dipole interactions on the clustering behavior, we plot in Fig. 11 the fraction of the largest cluster, ϕc [see eqn (7)], as a function of the motility v0* for various coupling strengths λ. Consistent with the motility-induced phase separation, the curves for non-dipolar and weakly coupled active particles (λ = 0–1) display a sharp increase from zero at v0* ≈ 20 and reach large values (ϕc ≈ 0.8) at v0* = 100. The curves reach ϕc = 0.5 at larger v0* with increasing λ, which is also reflected by the boundary between black dots and red squares in Fig. 9. For strong dipolar coupling (λ ≳ 2), the values of ϕc at high motilities remain in the same range (ϕc ≈ 0.8, indicating again formation of large clusters), but the increase in ϕc at small v0* is much less pronounced. This already indicates a strong impact of dipolar interactions. For more detailed analysis of the clustering behavior, we discuss the cluster size distribution in Appendix A.2.
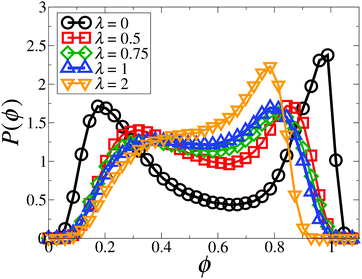
To gain further information, we calculate position-resolved local area fractions, ϕ, based on a Voronoi tessellation.36,40 (We note that, contrary to ref. 36, we did not perform a short time average of ϕ, since the polar clusters characterizing the dense state migrate over time and, therefore, are not stationary within the short-time interval. The flocking behavior will be discussed later in detail in Section 3.3.2.) Fig. 12 shows the probability distribution of the local area fractions, P(ϕ), for different coupling strengths at v0* = 100. For non-dipolar active particles (λ = 0), P(ϕ) reveals a clear double-peak structure that reflects the separation between the dilute and the dense phase. The coexisting densities correspond to the location of the two local maxima of P(ϕ). Upon an increase in the coupling strength up to λ = 2, the double-peak structure gradually disappears. Instead, we observe the emergence of a single peak located at a density slightly larger than the mean density (Φ = 0.58), as well as a broad shoulder on the left. This suggests the disappearance of the phase separation observed at zero and small λ.
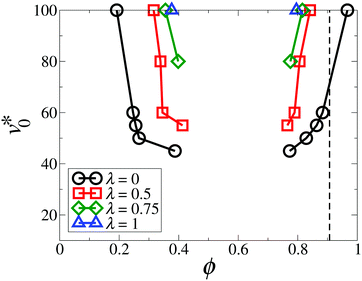
The same conclusion can be drawn from Fig. 13, where we plot the coexisting densities in the (v0*, ϕ) plane for various λ. The location of the high-density branch at λ = 0 can be explained as follows: At high motilities v0*, the non-dipolar system (λ = 0) exhibits “giant” clusters, composed of randomly oriented particles [see Fig. 10(b)]. These particles are separated by a distance close to the effective hard sphere diameter σeff defined in Section 2.2. As a result, the local area fraction in the densely packed region should be close to the close-packing fraction,  . Upon a slight increase in dipolar coupling, the coexistence branches for the dilute region, ϕgas, are shifted toward higher densities, while the branches for the dense region, ϕden, move toward lower area fractions. As a result, the area surrounded by the curves of ϕden and ϕgas in Fig. 13 significantly shrinks with increasing λ, indicating that motility-induced phase separation is generally suppressed by the dipolar interactions. Within the present simulations, the phase separation and the corresponding coexistence curves disappear once λ > 1. We note that this observation is in contrast with the findings in a recent study of active Brownian particles with additional interactions of velocity alignment at high densities.10 This shows that different types of orientational interactions may have entirely different impacts on motility-induced phase separation.
Yet another perspective on the disappearance of the phase separation due to dipolar interactions emerges when we consider the self-trapping mechanism (which plays a key role for clustering at λ = 0). To this end, we compute the normalized speed of the ith particle, vi*/v0*, versus the local density ϕi = ϕ(ri), where the speed is given by vi* = |(Δri/σ)/(Δts/τ)| with Δts = 10−2τ. After averaging over N particles and over at least 1000 snapshots, we plot in Fig. 14 the normalized particle speed versus the local density. For non-coupled (λ = 0) and weakly coupled (0 < λ ≲ 1) systems, we observe a linear decay,
| v*(ϕ)/v0* = 1 − adϕ, | (13) |
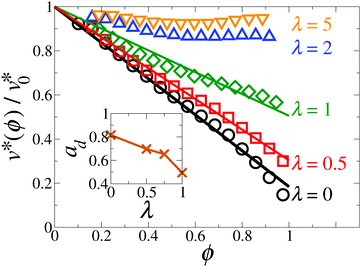 | ||
| Fig. 14 Normalized particle speed v*(ϕ)/v0* as a function of the local area fraction ϕ for the coupling strength λ = 0 (black circles), 0.5 (red squares), 1 (green diamonds), 2 (blue triangles up), and 5 (orange triangles down) with the motility v0* = 100. The solid lines represent fits to eqn (13). Inset: Fitted decay amplitude ad as a function of λ. The line is drawn as a guide to the eye. | ||
To obtain a more complete (yet qualitative) picture on the role of the function ad(λ) for the appearance of the motility-induced phase separation, we consider the effective free energy proposed in ref. 41,
| f(ϕ) = f0(ϕ) + frep(ϕ), | (14) |
 | (15) |
| frep(ϕ) = krepΘ(ϕ − ϕt)(ϕ − ϕt)4 | (16) |
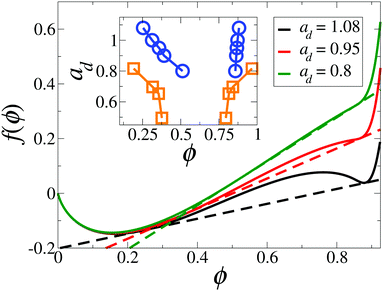
For conventional active Brownian particles (λ = 0), the decay amplitude, as a crucial parameter describing the degree of self-trapping, is typically chosen to be ad = 1 for 2D and ad = 1.3 for 3D.64 With this in mind, in Fig. 15 we plot the effective free energy f(ϕ) for the decay amplitude ad = 1.08, 0.95, and 0.8. At low densities, f(ϕ) is nearly independent of ad, while at high densities, f(ϕ) increases with decreasing ad. From f(ϕ), we determine the coexisting densities through the common tangent construction. To compare the influence of the decay amplitude, ad, on the phase separation from the theoretical perspective and the simulation results, we plot in the inset of Fig. 15 the coexisting densities in the (ad,ϕ) plane for the effective free energy (blue circles) and simulations at v0* = 100 and 0 ≤ λ ≤ 1 (orange squares). More specifically, for the above simulations we plot the coexisting densities determined from Fig. 12versus the associated ad plotted in the inset of Fig. 14. The coexisting densities obtained from both methods describe the same trend, that is, a decrease in the decay amplitude ad causes a reduction in ϕden and a growth in ϕgas. Further, the phase separation disappears once v(ϕ) decays sufficiently slow (ad ≲ 0.6 for the effective free energy, and ad ≲ 0.5 for simulations). This clearly indicates that the motility-induced phase separation is suppressed when the function v(ϕ) decreases too slowly, i.e., when the dipolar coupling becomes too strong.
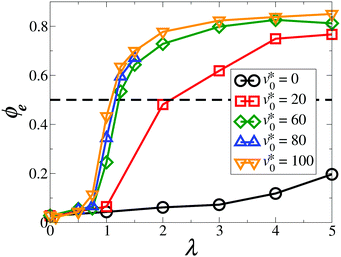 | ||
| Fig. 16 Magnitude of the average orientation ϕe as a function of the coupling strength λ at Φ = 0.58 for v0* = 0 (black circles), 20 (red squares), 60 (green diamonds), 80 (blue triangles up), and 100 (orange triangles down). The dashed line ϕe = 0.5 indicates the value above which the particles form a flocking state (according to Table 1). The solid lines are drawn as a guide to the eye. | ||
To better evaluate the dependence of orientational correlations on the direction of the connecting vector rij, Fig. 17(e) shows the angular correlation function, ![[g with combining tilde]](https://www.rsc.org/images/entities/i_char_0067_0303.gif) μ(θ) [defined in eqn (11)], for the strong dipolar coupling strength λ = 5. As mentioned in Section 2.3.3, the difference between the maximum
μ(θ) [defined in eqn (11)], for the strong dipolar coupling strength λ = 5. As mentioned in Section 2.3.3, the difference between the maximum ![[g with combining tilde]](https://www.rsc.org/images/entities/i_char_0067_0303.gif) μ(θmax) and the minimum
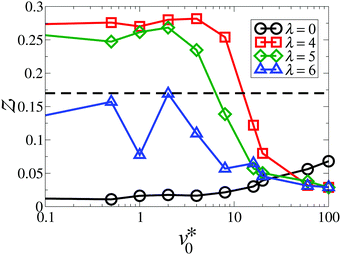
μ(θmax) and the minimum ![[g with combining tilde]](https://www.rsc.org/images/entities/i_char_0067_0303.gif) μ(θmin) of the curve, Z [defined in eqn (12)], can be used as a measure of chain formation. Upon increasing v0*, Z decreases and, at the same time, the curves in Fig. 17(e) are shifted toward lager positive correlations. An overview of the behavior of Z as a function of v0* (for various λ) is given in Fig. 18. The data curves bear close resemblance to those for ϕp in Fig. 3. For a non-dipolar system (λ = 0), where chains are absent, the order parameter Z does not show any significant behavior within the range of motilities explored. In contrast, at large coupling strengths (λ = 4 and λ = 5), the decrease in Z with increasing v0* reflects the disappearance of a state with chain-like structures. Specifically, the curves for λ ≥ 4 show a sharp decrease, accompanied by a point of inflection Z ≈ 0.17. We choose this as a threshold value. We note that the simulations of nearly passive, strongly-coupled systems (e.g., λ = 5 and 6) are severely plagued by large fluctuations of the order parameter Z over time. In these cases, we were unable to determine whether or not the simulations had reached a steady state even after a very long simulation time (t > 300τ). The corresponding region in the state diagram in Fig. 9 is marked by dashed lines.
μ(θmin) of the curve, Z [defined in eqn (12)], can be used as a measure of chain formation. Upon increasing v0*, Z decreases and, at the same time, the curves in Fig. 17(e) are shifted toward lager positive correlations. An overview of the behavior of Z as a function of v0* (for various λ) is given in Fig. 18. The data curves bear close resemblance to those for ϕp in Fig. 3. For a non-dipolar system (λ = 0), where chains are absent, the order parameter Z does not show any significant behavior within the range of motilities explored. In contrast, at large coupling strengths (λ = 4 and λ = 5), the decrease in Z with increasing v0* reflects the disappearance of a state with chain-like structures. Specifically, the curves for λ ≥ 4 show a sharp decrease, accompanied by a point of inflection Z ≈ 0.17. We choose this as a threshold value. We note that the simulations of nearly passive, strongly-coupled systems (e.g., λ = 5 and 6) are severely plagued by large fluctuations of the order parameter Z over time. In these cases, we were unable to determine whether or not the simulations had reached a steady state even after a very long simulation time (t > 300τ). The corresponding region in the state diagram in Fig. 9 is marked by dashed lines.
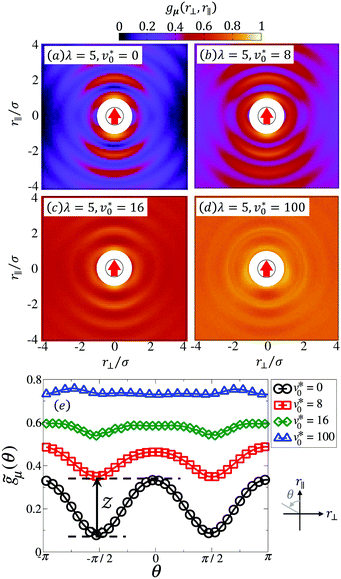 | ||
Fig. 17 Spatial correlation function of dipole moments, gμ(r⊥, r‖) defined in eqn (10), at Φ = 0.58 and λ = 5 for the motility v0* = 0 (a), 8 (b), 16 (c), and 100 (d). The black circle represents the reference particle with the red arrow indicating the particle's orientation as well as the dipole moment. The area  is drawn in white color to reflect that the center-to-center distance between particles can not be smaller than its diameter due to steric repulsion. (e) The angular correlation function of dipole moments, is drawn in white color to reflect that the center-to-center distance between particles can not be smaller than its diameter due to steric repulsion. (e) The angular correlation function of dipole moments, ![[g with combining tilde]](https://www.rsc.org/images/entities/i_char_0067_0303.gif) μ(θ) defined in eqn (11), as a function of θ = atan2(−r⊥, r‖) with the coupling strength λ = 5. The graph at the bottom-right corner of (e) illustrates the definition of θ. μ(θ) defined in eqn (11), as a function of θ = atan2(−r⊥, r‖) with the coupling strength λ = 5. The graph at the bottom-right corner of (e) illustrates the definition of θ. | ||
4 Conclusions
Using Brownian dynamics simulations, we have studied how dipolar interactions and self-propulsion combine to influence the dynamical self-assembly of a monolayer of dipolar active Brownian particles. To this end, we have presented state diagrams in the plane spanned by the dipolar coupling and the motility for three representative densities.When the motility is small, the state diagrams are similar for all densities considered. Specifically, homogeneous and isotropic fluids are observed for nearly passive particles with weak dipolar coupling, whereas strong dipolar coupling leads to chain-like structures. At high motilities, the state diagrams strongly depend on the mean area fraction Φ. At low densities (Φ = 0.12) and strong dipolar coupling, an increase in the motility v0* from zero causes chain-like structures to break into fragments of short chains and individual beads. At intermediate densities, passive, strongly-coupled dipolar particles self-assemble into a state with chain-like structures. With increasing v0* from zero, chains start to break and the system displays a micro-flocking state, where particles form finite-sized clusters with polar order. Finally, at a high densities and strong dipolar interactions, we observe a motility-induced transition from a state with chain-like structures into a micro-flocking state and finally into a macro-flocking state, where particles show global orientational ordering and form “giant” clusters.
To provide a simple argument for the emergence of polar order (which is absent in the passive 2D case), we have considered the time evolution of two dipolar particles starting from four representative initial configurations. As a result of the interplay between dipolar coupling and self-propulsion, the head-to-tail configuration remains the most stable one (same as the passive case), while the antiparallel side-by-side configuration is destabilized. With increasing particle number, the head-to-tail alignment mechanism can finally lead to a flocking state if the density is sufficiently high (Φ ≳ 0.23).
It has been reported earlier that finite size effects may hide crucial features of the flocking behavior in active systems, such as the first order nature of the flocking transition followed by the formation of traveling bands.6 We note that the sizes of the present simulations are limited to the order of 103 particles, due to the long-range character of the dipolar interactions and, subsequently, the expensive computational cost. Besides the qualitative behavior, it would be very interesting to study the scaling behavior and explore whether the dipolar active particles belong to any of the existing universality classes, such as the one of the Vicsek model.4,66,67 To this end, however, it would be necessary to perform extensive simulations with system sizes much larger than N ≈ 103, which is, again, limited by the computational resources. Nevertheless, it is worth mentioning a fundamental difference regarding the flocking transition: in the Vicsek model the onset of the flocking state is characterized by simultaneous spontaneous appearance of density and orientational inhomogeneities.6–8 In contrast, in our model the emergence of global orientational order is decoupled from the formation of large-scale structures, such as “giant” clusters.
At Φ = 0.58 and large values of v0*, the system displays motility-induced phase separation, where “giant” clusters composed of densely-packed particles with random orientations coexist with freely moving particles in the dilute region. The phase separation persists as long as the dipolar coupling λ is negligible against thermal fluctuations (0 < λ ≲ 1). Once the dipolar interactions dominate (λ > 1), the orientations of the active particles are no longer uncorrelated and the particles tend to align with their neighbors, leading to a break down of the self-trapping mechanism and a subsequent suppression of the phase separation.
We note that our model does not account for hydrodynamic interactions between the particles. In the absence of dipolar coupling, simulation studies have reported that hydrodynamic interactions tend to suppress motility-induced phase separation due to, either, the near-field interactions,68,69 or the rapid decorrelation of the particle orientations.70–72 Through investigating the pair distribution function, it has been shown that hydrodynamic interactions generally damp out the translational structure of active particles at high densities.73 Moreover, hydrodynamically interacting particles with a certain range of force dipole strengths can spontaneously form a state with global polar order,68,69,74,75 which can be attributed to either the actively induced rotation-translation coupling,76 or the near-field lubrication forces.68,69 Therefore, one may expect that dipolar coupling and hydrodynamic interactions combine to further suppress the phase separation and promote the polar ordering. The details of the resulting collective behavior are a topic of future studies.
In the real world, active particles are often asymmetric.77,78 As a result, the effective propulsion force does not coincide with the particle's center of mass, thus generating a propulsion torque which induces chiral active motion.35,79 Such a mechanism is also expected for the magnetic or dielectric Janus particles, whose dipole moments (either permanent or induced) are mostly shifted from the center of the individual particles.80–83 Therefore, it would be very interesting to investigate models accounting for the chiral motion and the shifted dipole moment, so as to obtain more comprehensive understanding of dipolar active systems.
Conflicts of interest
There are no conflicts to declare.A Appendix
A.1 Ewald summation
To deal with the long-range character of the dipole–dipole interactions, we employ 2D Ewald summation with the “tinfoil” boundary condition.84 Within this method, the total dipole–dipole energy is separated into different contributions,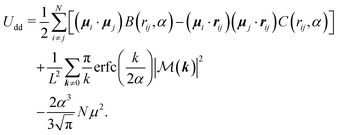 | (17) |
 | (18) |
 | (19) |
 | (20) |
 . We evaluate the reciprocal-space summation for the k-vectors within the range m2 = mx2 + my2 ≤ 152.85 The third term represents the correction due to unphysical self-interaction of dipole moments.85
The Langevin eqn (4) and (5) involve the forces and torques due to the dipolar interactions. From eqn (17), the force acting on the ith particle due to dipole–dipole interactions is given by
| Fi,dd = −∇riUdd = FRi,dd + Fk≠0i,dd, | (21) |
 | (22) |
 | (23) |
 | (24) |
 and
and  [see eqn (20)].
In the present work, every dipole moment is restricted to point in the xy-plane with ψi characterizing its direction relative to the x-axis. Therefore, the torque acting on the ith particle is always directed along the z-axis. It is given by
Ti,dd = −∂ψiUdd![[thin space (1/6-em)]](https://www.rsc.org/images/entities/char_2009.gif) ẑ = TRi + Tk≠0i, ẑ = TRi + Tk≠0i, | (25) |
 | (26) |
 | (27) |
A.2 The cluster size distribution
The purpose of this paragraph is to show that the clusters observed in the “micro-flocking” state at intermediate densities are indeed microscopic structures. To this end, we performed a finite size analysis of the cluster size distribution. If these clusters are microscopic patterns, they should not grow as the total number of particles N (i.e., the system size) becomes larger. Fig. 19 shows the weighted cluster size distribution nP(n) at Φ = 0.23, v0* = 100 and λ = 6 for various system sizes N, where the cluster size n represents the number of particles within a cluster. For N < 1000, the distribution decays faster as N decreases, indicating that the systems are influenced by the finite sizes. However, as we increase the particle number up to N ≳ 1000, the data points collapse onto a single curve. To obtain a more quantitative description, we fit the data points for each system size via the function,| nP(n) = P(1)n−1e−(n−1)/n0, | (28) |
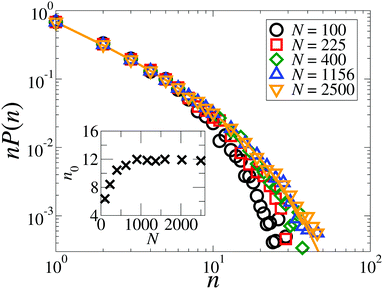 | ||
| Fig. 19 Weighted distribution of cluster size at Φ = 0.23 for the particle number N = 100 (black circles), 225 (red squares), 400 (green diamonds), 1156 (blue triangles up), and 2500 (orange triangles down). The orange solid line indicates the curve fitted to N = 2500 according to eqn (28). Inset: Characteristic size of clusters, n0, as a function of particle number N. | ||
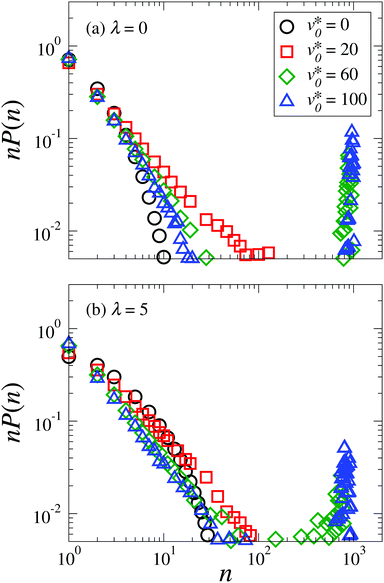
To provide additional information on the clustering behavior at high densities (Φ = 0.58), we plot in Fig. 20 the weighted cluster size distribution for non-dipolar and strong coupled dipolar active particles at Φ = 0.58. At the coupling strength λ = 0, our model reduces to the limiting case of active Brownian particles.3,63 Here, the correspondent weighted cluster size distribution function undergoes a transition from an exponential decay (v0* ≲ 20) into a curve with a power law decay at small cluster sizes n and a peak at large n (v0* ≲ 20), as shown in Fig. 20(a). Interestingly, the distribution functions of strongly-coupled dipolar particles (λ = 5) bear resemblance to the case of active Brownian particles, as can be seen in Fig. 20(b). For passive dipolar particles (v0* = 0), the weighted distribution function vanishes at n ≈ 30, which is three times as large as in the non-dipolar case. This is due to the fact that the strongly-coupled particles tend to form head-to-tail configurations and therefore display chain-like structures. With increasing motilities, such structures disappear. Further, the dipolar particles start to align with their neighbors and form into clusters, as shown in Fig. 10(d). As indicated by the peaks at n ≈ 103 in Fig. 20(b), these particles form “giant” clusters when v0* ≳ 20.
Acknowledgements
The authors would like to thank Deutsche Forschungsgemeinschaft for the financial support from GRK 1524 (DFG No. 599982). This work was also supported by NSF's Research Triangle MRSEC under grant number DMR 1121107.Notes and references
- P. Romanczuk, M. Bär, W. Ebeling, B. Lindner and L. Schimansky-Geier, Eur. Phys. J.-Spec. Top., 2012, 202, 1 CrossRef CAS.
- A. Zöttl and H. Stark, J. Phys.: Condens. Matter, 2016, 28, 253001 CrossRef.
- I. Buttinoni, J. Bialké, F. Kümmel, H. Löwen, C. Bechinger and T. Speck, Phys. Rev. Lett., 2013, 110, 238301 CrossRef PubMed.
- J. Toner and Y. Tu, Phys. Rev. Lett., 1995, 75, 4326 CrossRef CAS PubMed.
- E. Bertin, M. Droz and G. Grégoire, Phys. Rev. E: Stat., Nonlinear, Soft Matter Phys., 2006, 74, 022101 CrossRef PubMed.
- H. Chaté, F. Ginelli, G. Grégoire and F. Raynaud, Phys. Rev. E: Stat., Nonlinear, Soft Matter Phys., 2008, 77, 046113 CrossRef PubMed.
- A. P. Solon, H. Chaté and J. Tailleur, Phys. Rev. Lett., 2015, 114, 068101 CrossRef PubMed.
- T. Vicsek, A. Czirók, E. Ben-Jacob, I. Cohen and O. Shochet, Phys. Rev. Lett., 1995, 75, 1226 CrossRef CAS PubMed.
- A. Martín-Gómez, D. Levis, A. Díaz-Guilera and I. Pagonabarraga, Soft Matter, 2018, 14, 2610 RSC.
- E. Sesé-Sansa, I. Pagonabarraga and D. Levis, EPL, 2018, 124, 30004 CrossRef.
- C. Bechinger, R. Di Leonardo, H. Löwen, C. Reichhardt, G. Volpe and G. Volpe, Rev. Mod. Phys., 2016, 88, 045006 CrossRef.
- F. Kogler and S. H. L. Klapp, EPL, 2015, 110, 10004 CrossRef.
- A. Kaiser, K. Popowa and H. Löwen, Phys. Rev. E: Stat., Nonlinear, Soft Matter Phys., 2015, 92, 012301 CrossRef PubMed.
- F. Guzmán-Lastra, A. Kaiser and H. Löwen, Nat. Commun., 2016, 7, 13519 CrossRef PubMed.
- A. Kaiser, A. Snezhko and I. S. Aranson, Sci. Adv., 2017, 3, e1601469 CrossRef PubMed.
- G. Kokot and A. Snezhko, Nat. Commun., 2018, 9, 2344 CrossRef PubMed.
- R. P. Blakemore, Annu. Rev. Microbiol., 1982, 36, 217 CrossRef CAS PubMed.
- R. B. Frankel, Annu. Rev. Biophys. Bioeng., 1984, 13, 85 CrossRef CAS PubMed.
- S. Klumpp, C. T. Lefèvre, M. Bennet and D. Faivre, Phys. Rep., 2018, 789, 1 CrossRef.
- N. Waisbord, C. T. Lefèvre, L. Bocquet, C. Ybert and C. Cottin-Bizonne, Phys. Rev. Fluids, 2016, 1, 053203 CrossRef.
- F. Meng, D. Matsunaga and R. Golestanian, Phys. Rev. Lett., 2018, 120, 188101 CrossRef CAS PubMed.
- J. Harder and A. Cacciuto, Phys. Rev. E, 2018, 97, 022603 CrossRef CAS PubMed.
- J. Yan, M. Han, J. Zhang, C. Xu, E. Luijten and S. Granick, Nat. Mater., 2016, 15, 1095 CrossRef CAS PubMed.
- M. Han, J. Yan, S. Granick and E. Luijten, Proc. Natl. Acad. Sci. U. S. A., 2017, 114, 7513 CrossRef CAS PubMed.
- L. Baraban, D. Makarov, O. G. Schmidt, G. Cuniberti, P. Leiderer and A. Erbe, Nanoscale, 2013, 5, 1332 RSC.
- L. Baraban, R. Streubel, D. Makarov, L. Han, D. Karnaushenko, O. G. Schmidt and G. Cuniberti, ACS Nano, 2013, 7, 1360 CrossRef CAS PubMed.
- J. M. Tavares, J. J. Weis and M. M. Telo da Gama, Phys. Rev. E: Stat., Nonlinear, Soft Matter Phys., 2002, 65, 061201 CrossRef CAS PubMed.
- P. D. Duncan and P. J. Camp, J. Chem. Phys., 2004, 121, 11322 CrossRef CAS PubMed.
- P. D. Duncan and P. J. Camp, Phys. Rev. Lett., 2006, 97, 107202 CrossRef PubMed.
- S. Kantorovich, J. J. Cerdà and C. Holm, Phys. Chem. Chem. Phys., 2008, 10, 1883 RSC.
- J. J. Cerdà, S. Kantorovich and C. Holm, J. Phys.: Condens. Matter, 2008, 20, 204125 CrossRef PubMed.
- S. H. L. Klapp and M. Schoen, J. Chem. Phys., 2002, 117, 8050 CrossRef CAS.
- W.-Z. Ouyang, S.-H. Xu and Z.-W. Sun, J. Chem. Phys., 2011, 134, 014901 CrossRef PubMed.
- R. Geiger and S. H. L. Klapp, J. Mod. Phys., 2013, 04, 401 CrossRef.
- S. van Teeffelen and H. Löwen, Phys. Rev. E: Stat., Nonlinear, Soft Matter Phys., 2008, 78, 020101 CrossRef PubMed.
- G.-J. Liao and S. H. L. Klapp, Soft Matter, 2018, 14, 7873 RSC.
- P. E. Kloeden and E. Platen, Numerical Solution of Stochastic Differential Equations, Springer, Berlin, Heidelberg, 1992 Search PubMed.
- The alternative definition of the area fraction is given by
![[capital Phi, Greek, tilde]](https://www.rsc.org/images/entities/i_char_e0db.gif) = Nπσ2/(4L2). Therefore, Φ =
= Nπσ2/(4L2). Therefore, Φ = ![[capital Phi, Greek, tilde]](https://www.rsc.org/images/entities/i_char_e0db.gif) (σeff/σ)2. In this work, we consider three different density values
(σeff/σ)2. In this work, we consider three different density values ![[capital Phi, Greek, tilde]](https://www.rsc.org/images/entities/i_char_e0db.gif) = 0.1, 0.2, and 0.5. Consequently, the exact area fractions to the fifth decimal place are Φ = 0.11632, 0.23264, and 0.58160.
= 0.1, 0.2, and 0.5. Consequently, the exact area fractions to the fifth decimal place are Φ = 0.11632, 0.23264, and 0.58160. - M. E. Cates and J. Tailleur, Annu. Rev. Condens. Matter Phys., 2015, 6, 219 CrossRef CAS.
- J. Blaschke, M. Maurer, K. Menon, A. Zöttl and H. Stark, Soft Matter, 2016, 12, 9821 RSC.
- J. Tailleur and M. E. Cates, Phys. Rev. Lett., 2008, 100, 218103 CrossRef CAS PubMed.
- J. Bialké, H. Löwen and T. Speck, EPL, 2013, 103, 30008 CrossRef.
- P. Digregorio, D. Levis, A. Suma, L. F. Cugliandolo, G. Gonnella and I. Pagonabarraga, Phys. Rev. Lett., 2018, 121, 098003 CrossRef CAS PubMed.
- The pair correlation function has been obtained with a spatial resolution Δr = 0.0125σ. The resulting exact values for rL are rL = 1.15625σ for Φ = 0.12, rL = 1.13125σ for Φ = 0.23, and rL = 1.11875σ for Φ = 0.58.
- J.-J. Weis and D. Levesque, Advanced Computer Simulation Approaches for Soft Matter Sciences II, Springer, Berlin, Heidelberg, 2005, pp. 163–225 Search PubMed.
- J.-J. Weis, J. Chem. Phys., 2005, 123, 044503 CrossRef PubMed.
- R. A. Trasca and S. H. L. Klapp, J. Chem. Phys., 2008, 129, 084702 CrossRef CAS PubMed.
- J. J. Weis, Mol. Phys., 2002, 100, 579 CrossRef CAS.
- J.-J. Weis, J. Phys.: Condens. Matter, 2003, 15, S1471 CrossRef CAS.
- J. J. Weis and D. Levesque, Phys. Rev. Lett., 1993, 71, 2729 CrossRef CAS PubMed.
- L. Rovigatti, J. Russo and F. Sciortino, Phys. Rev. Lett., 2011, 107, 237801 CrossRef PubMed.
- L. Rovigatti, J. Russo and F. Sciortino, Soft Matter, 2012, 8, 6310 RSC.
- L. Rovigatti, S. Kantorovich, A. O. Ivanov, J. M. Tavares and F. Sciortino, J. Chem. Phys., 2013, 139, 134901 CrossRef PubMed.
- S. Kantorovich, A. O. Ivanov, L. Rovigatti, J. M. Tavares and F. Sciortino, Phys. Rev. Lett., 2013, 110, 148306 CrossRef PubMed.
- S. S. Kantorovich and A. O. Ivanov, in Soft Matter Self-Assembly, ed. C. N. Likos, F. Sciortino, P. Ziherl and E. Zaccarelli, IOS Press, 2016, pp. 137–163 Search PubMed.
- M. Ronti, L. Rovigatti, J. M. Tavares, A. O. Ivanov, S. S. Kantorovich and F. Sciortino, Soft Matter, 2017, 13, 7870 RSC.
- P. J. Camp, in Modern Problems of Molecular Physics, ed. L. A. Bulavin and A. V. Chalyi, Springer, Cham, 2018, pp. 185–204 Search PubMed.
- S. D. Peroukidis and S. H. L. Klapp, Soft Matter, 2016, 12, 6841 RSC.
- H. Schmidle, C. K. Hall, O. D. Velev and S. H. L. Klapp, Soft Matter, 2012, 8, 1521 RSC.
- H. Schmidle, S. Jäger, C. K. Hall, O. D. Velev and S. H. L. Klapp, Soft Matter, 2013, 9, 2518 RSC.
- I. Theurkauff, C. Cottin-Bizonne, J. Palacci, C. Ybert and L. Bocquet, Phys. Rev. Lett., 2012, 108, 268303 CrossRef CAS PubMed.
- S. S. Kantorovich, A. O. Ivanov, L. Rovigatti, J. M. Tavares and F. Sciortino, Phys. Chem. Chem. Phys., 2015, 17, 16601 RSC.
- J. Stenhammar, A. Tiribocchi, R. J. Allen, D. Marenduzzo and M. E. Cates, Phys. Rev. Lett., 2013, 111, 145702 CrossRef PubMed.
- J. Stenhammar, D. Marenduzzo, R. J. Allen and M. E. Cates, Soft Matter, 2014, 10, 1489 RSC.
- L. Luo and S. H. L. Klapp, J. Chem. Phys., 2009, 131, 034709 CrossRef PubMed.
- G. Baglietto, E. V. Albano and J. Candia, Interface Focus, 2012, 2, 708 CrossRef PubMed.
- B. Mahault, F. Ginelli and H. Chaté, 2019, arXiv: 1908.03794v1[cond-mat.stat-mech].
- N. Yoshinaga and T. B. Liverpool, Phys. Rev. E, 2017, 96, 020603 CrossRef PubMed.
- N. Yoshinaga and T. B. Liverpool, Eur. Phys. J. E, 2018, 41, 76 CrossRef PubMed.
- R. Matas Navarro, R. Golestanian, T. B. Liverpool and S. M. Fielding, Phys. Rev. E: Stat., Nonlinear, Soft Matter Phys., 2014, 90, 032304 CrossRef PubMed.
- R. Matas Navarro and S. M. Fielding, Soft Matter, 2015, 11, 7525 RSC.
- M. Theers, E. Westphal, K. Qi, R. G. Winkler and G. Gompper, Soft Matter, 2018, 14, 8590–8603 RSC.
- F. J. Schwarzendahl and M. G. Mazza, J. Chem. Phys., 2019, 150, 184902 CrossRef PubMed.
- F. Alarcón and I. Pagonabarraga, J. Mol. Liq., 2013, 185, 56 CrossRef.
- B. Delmotte, E. E. Keaveny, F. Plouraboué and E. Climent, J. Comput. Phys., 2015, 302, 524 CrossRef.
- C. Hoell, H. Löwen and A. M. Menzel, J. Chem. Phys., 2018, 149, 144902 CrossRef PubMed.
- E. Lauga, W. R. DiLuzio, G. M. Whitesides and H. A. Stone, Biophys. J., 2006, 90, 400 CrossRef CAS PubMed.
- M. Loose and T. J. Mitchison, Nat. Cell Biol., 2014, 16, 38 CrossRef CAS PubMed.
- F. Kümmel, B. ten Hagen, R. Wittkowski, I. Buttinoni, R. Eichhorn, G. Volpe, H. Löwen and C. Bechinger, Phys. Rev. Lett., 2013, 110, 198302 CrossRef PubMed.
- L. Baraban, D. Makarov, M. Albrecht, N. Rivier, P. Leiderer and A. Erbe, Phys. Rev. E: Stat., Nonlinear, Soft Matter Phys., 2008, 77, 031407 CrossRef PubMed.
- G. Steinbach, S. Gemming and A. Erbe, Eur. Phys. J. E, 2016, 39, 69 CrossRef PubMed.
- A. B. Yener and S. H. L. Klapp, Soft Matter, 2016, 12, 2066 RSC.
- S. H. Klapp, Curr. Opin. Colloid Interface Sci., 2016, 21, 76 CrossRef CAS.
- M. Mazars, Phys. Rep., 2011, 500, 43 CrossRef CAS.
- M. Schoen and S. H. L. Klapp, Reviews in Computational Chemistry, John Wiley & Sons, Inc., 2007, pp. 301–340 Search PubMed.
- Y. Fily, S. Henkes and M. Cristina Marchetti, Soft Matter, 2014, 10, 2132 RSC.
| This journal is © The Royal Society of Chemistry 2020 |

