 Open Access Article
Creative Commons Attribution 3.0 Unported Licence
Effect of extended short-circuiting in proton exchange membrane fuel cells†
Panagiotis
Trogadas‡
 *a,
Jason I. S.
Cho‡
*ab,
Nidhi
Kapil
 a,
Lara
Rasha
 b,
Albert
Corredera
b,
Dan J. L.
Brett
b,
Albert
Corredera
b,
Dan J. L.
Brett
 b and
Marc-Olivier
Coppens
 a
a
aEPSRC “Frontier Engineering” Centre for Nature Inspired Engineering, Department of Chemical Engineering, University College London, London, UK. E-mail: p.trogadas@ucl.ac.uk; in.cho.13@alumni.ucl.ac.uk
bElectrochemical Innovation Lab, Department of Chemical Engineering, University College London, London, UK
First published on 24th September 2020
Abstract
Short-circuiting is regularly utilized in Proton Exchange Membrane Fuel Cells (PEMFCs) to reverse short-term reversible catalyst degradation. However, do these improvements in fuel cell performance and durability still exist after extended operation? We provide an answer to this question by comparing the performance and durability of a PEMFC under open-circuit voltage (OCV) and a commercial short-circuiting protocol, against a PEMFC under OCV without short-circuiting for the same extended period (∼144 h). The experimental results demonstrate the detrimental effect of extended short-circuiting on the durability of the catalyst and the performance of the fuel cell. Electrochemically active surface area losses reach ∼46% for the short-circuiting case, compared to only ∼18% losses for the OCV without short-circuiting. TEM and XPS measurements are employed to monitor the morphological changes of the catalyst layer, revealing that Ostwald ripening, carbon corrosion, and Pt migration and precipitation into the polymer membrane are the main degradation mechanisms of the cathode catalyst layer. At the end of PEMFC operation, XPS measurements reveal that only ∼0.1% (atomic) of Pt remains on the surface of the cathode catalyst layer after OCV with short-circuiting, compared to the initial ∼0.4% Pt of the unused cathode MEA and ∼0.3% Pt for the cathode MEA after OCV without short-circuiting. These results show that short-circuiting can cause facile degradation of the catalyst layer and significant decrease in fuel cell performance, rendering this technique non-beneficial for extended operation.
1. Introduction
Short-circuiting, a technique where a controller electrically coupled with the fuel cell shunts the electrical current between the anode and the cathode, is often used to temporarily boost the performance of Proton Exchange Membrane Fuel Cells (PEMFCs).1 A limited number of reports about this technique are available in the literature enumerating the provisional positive effects of this method on the performance of PEMFCs.1–7 The first patents on short-circuiting appeared two decades ago, speculating that electrical shunting momentarily increases the power output of a PEMFC stack due to: (i) an increase in the amount of water available in the membrane electrode assembly (MEA), enhancing the proton conductivity of the membrane, and (ii) an increase in the dissipation of heat, which is sufficient to evaporate the excess generated water from the gas diffusion layers, hereby improving the flow of oxygen to the cathode side.1,4These positive effects of short-circuiting on the power density of a PEMFC led to the commercialization of periodical short-circuiting controllers by fuel cell manufacturers a decade later;5,6 a 500 ms short applied every minute or a 100 ms short applied every 10 s of fuel cell operation are the most commonly employed current pulsing profiles.2,5,6 Immediately after short-circuiting the fuel cell system, the fuel cell voltage increases substantially5,6 and then decays over time back to its equilibrium value. Stripping of oxygen species from the cathode is proposed to be the reason for the enhancement in catalytic activity, which decreases over time due to the re-oxidation of the catalyst. The formation of platinum oxide is well characterized and highly dependent on the applied potential:8–19
| Pt + H2O → Pt–OHads + H+ + e− (0.8–1.1 V vs. NHE) | (1a) |
| Pt + H2O ↔ PtO + 2H+ + 2e− (0.8–1.1 V vs. NHE) | (1b) |
| PtO + H2O ↔ PtO2 + 2H+ + 2e− (0.8–1.1 V vs. NHE) | (1c) |
| Pt ↔ Pt2+ + 2e− (>1.19 V vs. NHE) | (2) |
| PtO + 2H+ ↔ Pt2+ + H2O (<1.05 V vs. NHE) | (3) |
Initial oxidation of the platinum surface at potentials above 0.8 V (vs. NHE) results in the adsorption of OH species (one electron process – eqn (1a))8,11 or direct adsorption of O2− from water via a two-electron process13 (eqn (1b) and (1c)). Full coverage of platinum with OH is achieved at ∼1.1 V (vs. NHE) for both cases,8,13,20 and interfacial place exchange between surface Pt atoms and OHads occurs at this potential value.13 At higher applied potentials than 1.1 V (vs. NHE), Pt dissolution (eqn (2)) occurs, whereas at potentials lower than 1.05 V (vs. NHE), PtO is dissolved from the Pt surface, which is fully covered with oxygenated species, and Pt2+ is exposed on the surface of the catalyst (eqn (3)).13 The surface of PtOH is stripped at potentials below ∼0.7 V (vs. NHE), resulting in an oxide-free surface.10
Hence, there are two hypotheses about the cause of PEMFC performance improvement by short-circuiting, even though there is still a lack of evidence and there are contradicting reports3,7 about the actual mechanism. However, the overall very short duration of an electrical shunt renders any speculation about water increase in the polymer membrane extremely unlikely.
Even though all reports in the literature describe beneficial effects of short-circuiting on the power output of the fuel cell, the performance and durability results presented are for a short period of time (∼1–2 h). Will the beneficial effect of short-circuiting persist under extended operation? Here, an answer is provided to this question, by investigating the effect of short-circuiting on PEMFC performance and durability over an extended period (∼144 h). A commercial short-circuiting protocol is employed (application of a 100 ms short-circuit every 10 s of fuel cell operation) and the performance and durability of a closed cathode PEMFC under open-circuit voltage (OCV) over 144 h are compared to the ones obtained for a closed cathode PEMFC under OCV without short-circuiting for the same period. Cathode MEA samples that have not been subjected to fuel cell testing are referred to as “Pt/C MEA unused”, whereas the cathode MEA samples measured after PEMFC operation for 144 h are referred to as “Pt/C MEA s-c” and “Pt/C MEA OCV”, denoting PEMFC under OCV with and without short-circuiting, respectively.
2. Experimental section
Membrane electrode assembly (MEA) fabrication
10 cm2 MEAs were fabricated in-house by hot pressing a GORE membrane (GORE) and gas diffusion electrodes (GDEs) with 0.4 mg cm−2 platinum loadings (HyPlat) in the anode and cathode using a 12-ton thermal press (Carver, 4122CE). The membrane was used without any pre-treatment and the MEA was pressed at 130 °C for 4 minutes with an applied pressure of 400 psi. These are the typically employed experimental conditions for the fabrication of Nafion-based MEAs, resulting in optimal interfacial contact between the catalyst layer and the polymer membrane.21PEMFC operation
Fuel cell temperature, inlet gas flow rate and relative humidity were regulated using an 850e fuel cell station (Scribner Associates, USA). The anode and cathode gas flow rates were fixed to 0.1 L min−1, and 0.4 mgPt cm−2 loadings on the anode and cathode were used. The inlet gas relative humidity of the anode was kept the same as the cathode at 35 °C (=100% RH), and the cell temperature was set to 35 °C. This low operating temperature was chosen to minimize the effect of temperature on Pt dissolution and deposition in the polymer membrane.22To evaluate the effect of short-circuiting (application of a 100 ms short-circuit every 10 s of fuel cell operation – Fig. 1) on Pt degradation within a short-time frame, all PEMFC measurements were conducted at OCV, an accelerated fuel cell testing condition,23 to subject the catalyst layer to a condition favorable toward Pt oxidation and agglomeration, while preventing accelerated degradation of the carbon support (at potentials higher than 0.9 V vs. NHE).24
The conditioning of the PEMFC was based on a procedure reported earlier in the literature by Horizon Fuel Cell Systems.2 One polarization measurement (5 min per 0.1 A cm−2) was conducted until the PEMFC reached 1.2 A cm−2, followed by twenty polarizations (30 s per 0.1 A cm−2) until the fuel cell again reached 1.2 A cm−2. Cyclic voltammograms were measured directly after conditioning.
Characterization
When the cyclic voltammogram of the cathode was measured, the cathode side was used as the working electrode, while the anode served as the counter and reference electrode. The potential was scanned between 0.05 V and 1 V, with a 0.02 V s−1 scan rate. Electrochemically active surface areas were calculated from the average charge obtained from the integration of the hydrogen adsorption and desorption peaks, assuming a Pt charge per unit area of 210 μC cm−2 for a monolayer coverage of hydrogen.Cross-section samples from the unused and used cathode MEAs (under OCV with and without short-circuiting) were selected from the central region of each MEA. After the gas diffusion layer was peeled off, the samples were dried in vacuum at 60 °C overnight, prior to transmission electron microscopy (TEM) and X-ray photoelectron spectroscopy (XPS) measurements. TEM images were taken with a JEOL 2100 transmission electron microscope at an accelerating voltage of 200 kV. These images were used to distinguish between individual and agglomerated particles. ImageJ software was used to calculate the particle size distribution. Surface sensitive XPS measurements were additionally employed to provide detailed information of the composition and chemical state of each element present on the surface of the catalyst layer. A survey scan between 0 and 1200 eV was performed for each sample. Then, high-resolution scans for carbon, fluorine, oxygen, platinum and sulfur were conducted with 20 eV pass energy. CasaXPS software was used for data processing. The peak area ratio of the Pt 4f doublet (f5/2![[thin space (1/6-em)]](https://www.rsc.org/images/entities/char_2009.gif) :
:![[thin space (1/6-em)]](https://www.rsc.org/images/entities/char_2009.gif) f7/2) was fixed to 3
f7/2) was fixed to 3![[thin space (1/6-em)]](https://www.rsc.org/images/entities/char_2009.gif) :
:![[thin space (1/6-em)]](https://www.rsc.org/images/entities/char_2009.gif) 4.
4.
3. Results and discussion
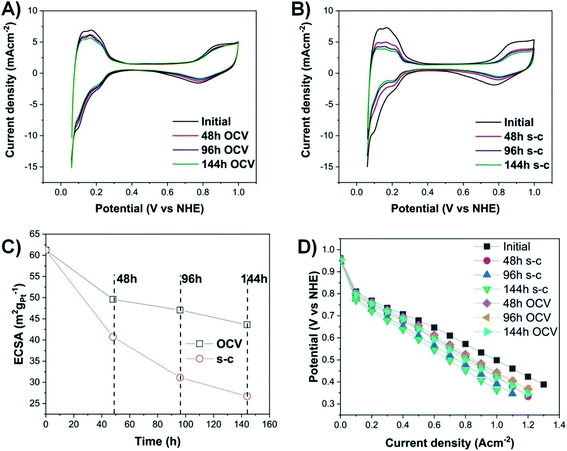
Cyclic voltammograms (Fig. 2A and B) are conducted at the beginning and, then, every two days, until the end of PEMFC operation (144 h in total). The highest loss in electrochemically active surface area (ECSA) in the case of a PEMFC operating at OCV with short-circuiting occurs during the first 48 h (Fig. 2C), with a loss of ∼25%, followed by a lower decay rate (additional ∼14% and 7% decrease after 96 h and 144 h, respectively). The voltage decay can be calculated from the difference between the initial and final voltage over the total duration of PEMFC operation. The PEMFC under OCV and a short-circuiting protocol demonstrates a high voltage degradation rate of ∼93 μV h−1, compared to the lower voltage decay rate of a PEMFC under OCV without short-circuiting (∼17 μV h−1 loss) and the targeted automotive degradation rate of less than 10 μV h−1.24 To fully determine the exact percentage of voltage degradation caused by the OCV with and without short-circuiting, additional measurements of the extent of the carbon oxidation reaction and the formation of hydrogen peroxide are required, since the OCV is also affected by those factors.23,25Moreover, there are two pronounced hydrogen desorption peaks at ∼0.125 and 0.23 V (vs. NHE), corresponding to the underpotential desorption of adsorbed hydrogen on different crystal facets of platinum.26 During OCV hold with or without short-circuiting, the most significant decrease occurs in the first peak, indicating that the very active Pt (110) sites contribute less to the ECSA, and hence to the overall activity of the electrocatalyst.27,28
To evaluate the morphological changes in the cathode MEAs tested, TEM measurements are conducted (Fig. 3). TEM images demonstrate that the unused Pt/C MEA consists of well-dispersed, nanosized Pt nanoparticles (∼2.3 nm) onto the carbonaceous support. After PEMFC operation at OCV with and without short-circuiting, individual Pt particles grow larger to diameters of ∼5.3 nm (OCV only) and ∼7.5 nm (OCV and short-circuiting), resulting in a broader size distribution of Pt particles with tails toward a large particle size (>10 nm) in the case of short-circuiting. The conditioning step consisting of several polarization measurements is also likely to have partly contributed to the growth of these nanoparticles. In addition, corrosion of the carbon support starts at potential values below 0.5 V (vs. NHE), where radical species form, due to the two-electron pathway of the oxygen reduction reaction, and attack the carbon support.24 The rate of carbon corrosion is increased at potentials above 0.6 V (vs. NHE), as it is catalyzed by Pt oxidizing the adsorbed CO species on its surface into CO2.24,29,30 Furthermore, Pt particles amass into densely packed Pt agglomerates after only 144 hours of operation, and individual Pt particles are no longer distinguishable. These TEM results suggest that Pt particles on the carbon support undergo Ostwald ripening at the nanometer scale via local dissolution of small particles (Pt0) coupled with transport of these dissolved species (Pt2+) and electrons through the liquid/ionomer and the carbon support, respectively [eqn (4)], and their precipitation onto larger particles (Pt0) [eqn (5)]:26,31–33
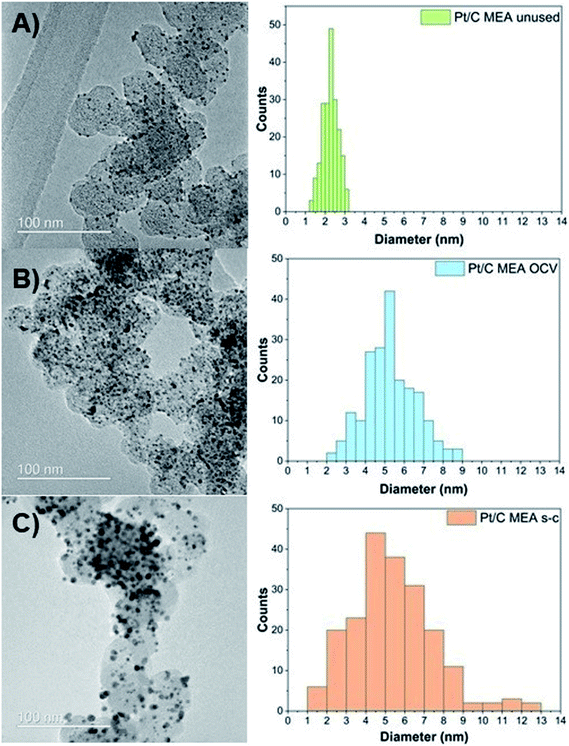 | ||
| Fig. 3 Pt particle size and distribution for unused (A), after OCV without (B), and with short-circuiting (C) cathode MEAs. | ||
Dissolution:
| Pt0(small particles) → Pt2+(ionomer/liquid) + 2e−(carbonaceous support) | (4) |
Precipitation:
| Pt2+(ionomer/liquid) + 2e−(carbonaceous support) → Pt0(large particles) | (5) |
TEM results confirm the observed reduction in the calculated ECSA values. Small particles tend to assemble into, and onto larger particles to minimize the overall surface energy of the total catalyst mass, which is the thermodynamically favorable state.34 As this process continues over time, the driving force for particle growth diminishes, due to the increased average particle size and reduced associated surface energy.35,36 Thus, the decrease in ECSA values is more pronounced in the first 48 h, during which most of the Pt agglomeration occurs. An additional reason for the enhanced ECSA losses of the Pt/C MEA subjected to short-circuiting is the migration of platinum species and precipitation of platinum particles in the polymer membrane, as evidenced by TEM (Fig. S1 and S2†).
Pt migration is confirmed by XPS studies, which are conducted to quantify the chemical changes of the elements comprising the cathode side of the MEA. Survey scans verify the presence of platinum, oxygen, sulfur, carbon and fluorine in all samples (Fig. S3–S5†). The observed decrease in total Pt surface concentration (Table 1) from 0.4% in the unused sample to 0.3% and 0.1% in the OCV and short-circuited cathode MEA samples, respectively, is in good agreement with reports in the literature.26,34,37,38 This drastic decrease in Pt content suggests Pt migration toward the deeper interface between the catalyst layer and the polymer membrane,26 which is confirmed by the decrease in the intensity signal of the surface sensitive XPS method.
| Element | Elemental composition (atomic concentration %) | ||
|---|---|---|---|
| Unused | OCV | OCV & short-circuiting | |
| C | 56.93 | 58.99 | 59.45 |
| F | 38.56 | 35.47 | 34.6 |
| O | 3.12 | 4.68 | 5.21 |
| S | 1 | 0.56 | 0.65 |
| Pt | 0.39 | 0.30 | 0.09 |
| Total | 100 | 100 | 100 |
The degradation of the catalyst layer is also depicted in the XPS spectrum of fluorine (Fig. 4). The spectrum of the unused cathode MEA sample is resolved into two components attributed to the hydrophobic CFx groups of the ionomer (∼689 eV) and the other fluorine-containing groups, such as OCF (∼692.4 eV).39 A decrease in the total surface concentration of fluorine is observed from ∼38.6% to ∼35.5% and ∼34.6% for the OCV and short-circuited cathode MEA samples, indicating the decomposition of CFx groups and the loss of ionomer. The degradation of the polymer membrane is also confirmed by the polarization curves (Fig. 2D), where a clearly visible linear loss with current density appears after ageing, suggesting decomposition of the membrane.
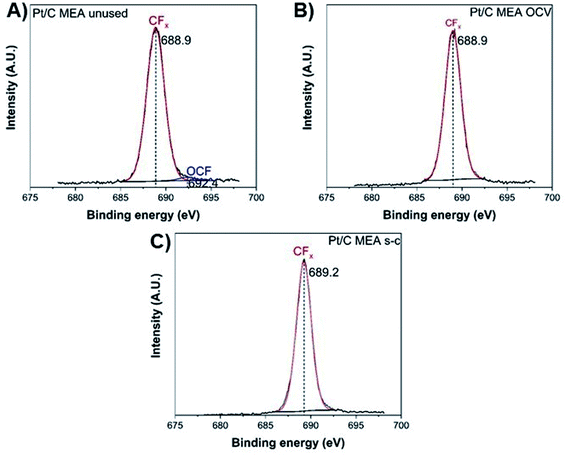 | ||
| Fig. 4 XPS fluorine spectra of unused (A), after OCV without (B), and with short-circuiting (C) cathode MEAs. | ||
Finally, the oxygen XPS spectrum of the catalyst layer exhibits two chemical states at ∼531.5 eV and ∼533–534 eV (Fig. 5), corresponding to the oxidized forms of platinum and carbon and the sulfonic acid group (–S![[double bond, length as m-dash]](https://www.rsc.org/images/entities/char_e001.gif) O), respectively.40 After fuel cell operation, the atomic concentration (%) per element of the sulfonic acid groups has decreased from ∼77.9 to ∼72.1 and ∼24.4 for cathode MEAs subjected to OCV without and with short-circuiting, respectively, suggesting significant loss of sulfonic acid groups from the polymer membrane during short-circuiting (Table 2).40
O), respectively.40 After fuel cell operation, the atomic concentration (%) per element of the sulfonic acid groups has decreased from ∼77.9 to ∼72.1 and ∼24.4 for cathode MEAs subjected to OCV without and with short-circuiting, respectively, suggesting significant loss of sulfonic acid groups from the polymer membrane during short-circuiting (Table 2).40
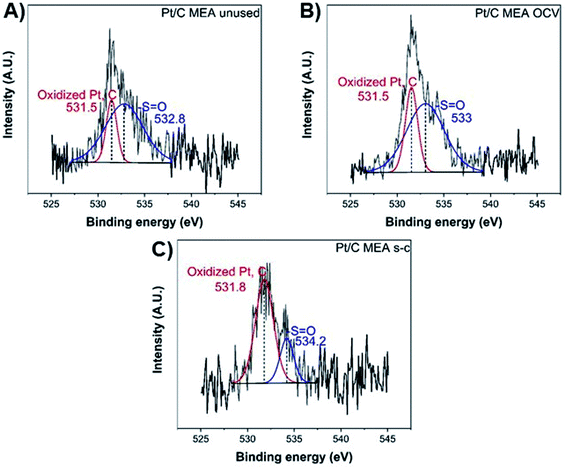 | ||
| Fig. 5 XPS O 1s spectra of unused (A), after OCV without (B), and with short-circuiting (C) cathode MEAs. | ||
| Element | Species | Atomic concentration % per element | ||
|---|---|---|---|---|
| Unused | OCV | OCV & short-circuiting | ||
| O | –S![[double bond, length as m-dash]](https://www.rsc.org/images/entities/char_e001.gif) O O |
77.18 | 71.22 | 24.42 |
| Oxidized forms of carbon and platinum | 22.82 | 28.78 | 75.58 | |
The exact opposite trend is observed for the oxidized forms of platinum and carbon, with the MEA subjected to short-circuiting exhibiting the highest degradation. The unused MEA sample contains only metallic Pt0,40,41 while oxidized Pt2+ is also present in the MEA samples subjected to OCV and short-circuiting conditions (Fig. 6).40–43 The atomic percentage of metallic Pt0 decreases to ∼61.8% and ∼42.2% for the MEAs under OCV and short-circuiting (Table S1†), respectively, indicating that the frequent application of short-circuiting causes significant oxidation of metallic Pt. This decrease in the Pt content of the catalyst layer occurs concurrently with a reduction in ECSA, demonstrating that the degradation of the catalyst layer proceeds via redeposition and oxidation of Pt into PtO.42
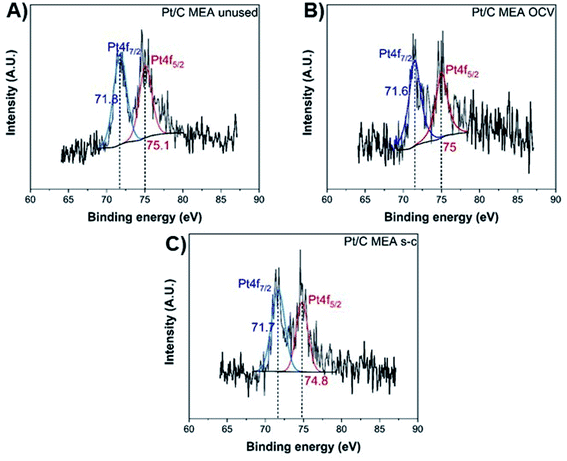 | ||
| Fig. 6 XPS Pt 4f spectra of unused (A), after OCV without (B), and with short-circuiting (C) cathode MEAs. | ||
The observed agglomeration of catalyst particles and the inevitable ECSA losses result in performance losses as well (Fig. 2D and S6–S10†). Degradation of the membrane increases dramatically with a loss of ∼42% in current density at 0.6 V, compared to ∼29% loss for the OCV without short-circuiting case after 144 h of operation. In the case of a short-circuited PEMFC, there are significant potential losses in the kinetic and high current density regions of the polarization curves, due to the decay of ECSA caused by Ostwald ripening, Pt migration, and corrosion of the carbon support. These catalyst and support degradation mechanisms reduce the number of Pt reaction sites available on the catalyst layer, resulting in increased oxygen transfer resistance and transport losses, since a higher flux of the reactant through the ionomer is needed to maintain the same total current density.40,43 The Pt depleted regions of the MEA become inactive and behave as part of the polymer membrane,44 suggesting an increase in ohmic resistance, as steeper lines are observed in the ohmic region of the polarization curves of MEAs subjected to OCV and short-circuiting (Fig. S12–S16†).
4. Conclusions
The above experimental results provide an answer to the question posed in the introduction: short-circuiting is not beneficial to the performance of a PEMFC under extended operation, and this technique should only be used when there is a substantial loss of electrochemically active surface area and, thus, the gain in performance from short-circuiting outweighs the expedited damage to the catalyst layer during the shorting process. To reach this conclusion, the performance and durability of a PEMFC under OCV with a commercial short-circuiting protocol (application of 100 ms short-circuit every 10 s of fuel cell operation) were compared against the performance of a PEMFC under OCV over 144 h. PEMFC under OCV and short-circuiting demonstrated the highest loss in ECSA at the end of operation (∼46% loss), compared to only ∼18% loss of the PEMFC under OCV, translating into a ∼93 μV h−1 and ∼17 μV h−1 voltage degradation rate, respectively. To comprehend the reasons for such facile degradation of the catalyst, TEM and XPS measurements of MEAs subjected to OCV with and without short-circuiting were conducted. TEM revealed degradation of the carbon support and Ostwald ripening of Pt particles in the short-circuited cathode MEA; Pt particles amass into densely packed Pt agglomerates after only 144 hours of operation, exhibiting a wide size distribution with tails toward large particle size. Moreover, Pt migrates and precipitates into the polymer membrane, which was confirmed by XPS measurements.XPS also demonstrated the detrimental effects of extended PEMFC under OCV with short-circuiting, revealing extended degradation of the polymer membrane and the catalyst. At the end of operation, a short-circuited cathode MEA contained only ∼0.1% (atomic) Pt on its surface, compared to ∼0.4% and ∼0.3% (atomic) Pt for the initial MEA and the MEA after OCV without short-circuiting, respectively.
Even though these experimental results showcased the deleterious effect of short-circuiting after a one-week period, long-term PEMFC performance under periodic application of short-circuiting is needed to fully comprehend its effect on catalyst and membrane degradation. Based on these initial results, we can speculate that the agglomeration of Pt nanoparticles will significantly increase over time under short-circuiting and open circuit voltage conditions, resulting in further ECSA losses and a fully degraded MEA after a few months. A parametric study on the operating conditions (e.g., temperature and operating potential) is also required to more clearly differentiate the contributions of different degradation mechanisms (carbon oxidation, catalyst and membrane degradation, and hydrogen peroxide formation) on cathode potential, along with ORR activity measurements to demonstrate the effect of different operating conditions on the catalytic activity of commercial Pt/C.
Abbreviations
| ECSA | Electrochemically active surface area of Pt (m2 gPt−1) |
| MEA | Membrane electrode assembly |
| NHE | Normal hydrogen electrode |
| OCV | Open-circuit voltage (V) |
| PEMFCs | Proton exchange membrane fuel cells |
| TEM | Transmission electron microscopy |
| XPS | X-ray photoelectron spectroscopy |
Conflicts of interest
There are no conflicts of interest to declare.Acknowledgements
The authors gratefully acknowledge support from the EPSRC “Frontier Engineering” Centre for Nature Inspired Engineering (EP/K038656/1) and an EPSRC “Frontier Engineering: Progression” Grant (EP/S03305X/1).References
- W. A. Fuglevand, P. D. DeVries, G. A. Lloyd, D. R. Lott and J. P. Scartozzi, US Pat., 6096449A, 2000.
- G. Gupta, B. Wu, S. Mylius and G. J. Offer, Int. J. Hydrogen Energy, 2017, 42, 4320–4327 CrossRef CAS.
- J. Kim, D.-M. Kim, S.-Y. Kim, S. W. Nam and T. Kim, Int. J. Hydrogen Energy, 2014, 39, 7925–7930 CrossRef CAS.
- A. Koschany, C. Lucas and T. Schwesinger, US Pat., 6451470B1, 2002.
- M. Pearson, US Pat., 20040224192A1, 2004.
- M. Pearson, US Pat., 7632583B2, 2009.
- Y. Zhan, Y. Guo, J. Zhu and L. Li, J. Power Sources, 2014, 270, 183–192 CrossRef CAS.
- H. Angerstein-Kozlowska, B. E. Conway and W. B. A. Sharp, J. Electroanal. Chem. Interfacial Electrochem., 1973, 43, 9–36 CrossRef CAS.
- B. E. Conway, Prog. Surf. Sci., 1995, 49, 331–452 CrossRef CAS.
- J. P. Hoare, Electrochim. Acta, 1982, 27, 1751–1761 CrossRef CAS.
- G. Jerkiewicz, G. Vatankhah, J. Lessard, M. P. Soriaga and Y.-S. Park, Electrochim. Acta, 2004, 49, 1451–1459 CAS.
- R. Roberts and D. C. Johnson, Electroanalysis, 1992, 4, 741–749 CrossRef CAS.
- A. A. Topalov, S. Cherevko, A. R. Zeradjanin, J. C. Meier, I. Katsounaros and K. J. J. Mayrhofer, Chem. Sci., 2014, 5, 631–638 RSC.
- D. Fantauzzi, S. Krick Calderón, J. E. Mueller, M. Grabau, C. Papp, H.-P. Steinrück, T. P. Senftle, A. C. T. van Duin and T. Jacob, Angew. Chem., Int. Ed., 2017, 56, 2594–2598 CrossRef CAS.
- Y. Furuya, T. Mashio, A. Ohma, M. Tian, F. Kaveh, D. Beauchemin and G. Jerkiewicz, ACS Catal., 2015, 5, 2605–2614 CrossRef CAS.
- P. P. Lopes, D. Strmcnik, D. Tripkovic, J. G. Connell, V. Stamenkovic and N. M. Markovic, ACS Catal., 2016, 6, 2536–2544 CrossRef CAS.
- R. Mom, L. Frevel, J.-J. Velasco-Vélez, M. Plodinec, A. Knop-Gericke and R. Schlögl, J. Am. Chem. Soc., 2019, 141, 6537–6544 CrossRef CAS.
- C. A. Rice, P. Urchaga, A. O. Pistono, B. W. McFerrin, B. T. McComb and J. Hu, J. Electrochem. Soc., 2015, 162, F1175–F1180 CrossRef CAS.
- L. Xing, G. Jerkiewicz and D. Beauchemin, Anal. Chim. Acta, 2013, 785, 16–21 CrossRef CAS.
- M. L. B. Rao, A. Damjanovic and J. O. M. Bockris, J. Phys. Chem., 1963, 67, 2508–2509 CrossRef CAS.
- Q. Meyer, N. Mansor, F. Iacoviello, P. L. Cullen, R. Jervis, D. Finegan, C. Tan, J. Bailey, P. R. Shearing and D. J. L. Brett, Electrochim. Acta, 2017, 242, 125–136 CrossRef CAS.
- S. R. Dhanushkodi, S. Kundu, M. W. Fowler and M. D. Pritzker, J. Power Sources, 2014, 245, 1035–1045 CrossRef CAS.
- R. Borup, J. Meyers, B. Pivovar, Y. S. Kim, R. Mukundan, N. Garland, D. Myers, M. Wilson, F. Garzon, D. Wood, P. Zelenay, K. More, K. Stroh, T. Zawodzinski, J. Boncella, J. E. McGrath, M. Inaba, K. Miyatake, M. Hori, K. Ota, Z. Ogumi, S. Miyata, A. Nishikata, Z. Siroma, Y. Uchimoto, K. Yasuda, K.-i. Kimijima and N. Iwashita, Chem. Rev., 2007, 107, 3904–3951 CrossRef CAS.
- L. Castanheira, W. O. Silva, F. H. B. Lima, A. Crisci, L. Dubau and F. Maillard, ACS Catal., 2015, 5, 2184–2194 CrossRef CAS.
- S. A. Vilekar and R. Datta, J. Power Sources, 2010, 195, 2241–2247 CrossRef CAS.
- P. J. Ferreira, G. J. la O', Y. Shao-Horn, D. Morgan, R. Makharia, S. Kocha and H. A. Gasteiger, J. Electrochem. Soc., 2005, 152, A2256–A2271 CrossRef.
- S. Kundu, M. Fowler, L. C. Simon and R. Abouatallah, J. Power Sources, 2008, 182, 254–258 CrossRef CAS.
- US DOE, Fuel Cells Technology Office, Multi-Year Research, Development, and Demonstration Plan, Section 3.4, 2012, pp. 1–58 Search PubMed.
- M. D. Maciá, J. M. Campiña, E. Herrero and J. M. Feliu, J. Electroanal. Chem., 2004, 564, 141–150 CrossRef.
- E. Guilminot, A. Corcella, M. Chatenet, F. Maillard, F. Charlot, G. Berthomé, C. Iojoiu, J.-Y. Sanchez, E. Rossinot and E. Claude, J. Electrochem. Soc., 2007, 154, B1106–B1114 CrossRef CAS.
- L. M. Roen, C. H. Paik and T. D. Jarvi, Electrochem. Solid-State Lett., 2004, 7, A19–A22 CrossRef CAS.
- P. T. Yu, Z. Liu and R. Makharia, J. Electrochem. Soc., 2013, 160, F645–F650 CrossRef CAS.
- A. V. Virkar and Y. Zhou, J. Electrochem. Soc., 2007, 154, B540–B547 CrossRef CAS.
- J. Xie, D. L. Wood, K. L. More, P. Atanassov and R. L. Borup, J. Electrochem. Soc., 2005, 152, A1011–A1020 CrossRef.
- P. Trogadas, T. F. Fuller and P. Strasser, Carbon, 2014, 75, 5–42 CrossRef CAS.
- P. Trogadas and M.-O. Coppens, Chem. Soc. Rev., 2020, 49, 3107–3141 RSC.
- P. Trogadas, V. Ramani, P. Strasser, T. F. Fuller and M.-O. Coppens, Angew. Chem., Int. Ed., 2016, 55, 122–148 CrossRef CAS.
- H. R. Colón-Mercado and B. N. Popov, J. Power Sources, 2006, 155, 253–263 CrossRef.
- H. Xu, R. Kunz and J. M. Fenton, Electrochem. Solid-State Lett., 2007, 10, B1–B5 CrossRef CAS.
- F.-Y. Zhang, S. G. Advani, A. K. Prasad, M. E. Boggs, S. P. Sullivan and T. P. Beebe, Electrochim. Acta, 2009, 54, 4025–4030 CrossRef CAS.
- G. M. Bancroft, I. Adams, L. L. Coatsworth, C. D. Bennewitz, J. D. Brown and W. D. Westwood, Anal. Chem., 1975, 47, 586–588 CrossRef CAS.
- A. Ostroverkh, M. Dubau, V. Johánek, M. Václavů, B. Šmíd, K. Veltruská, Y. Ostroverkh, R. Fiala and V. Matolín, Fuel Cells, 2018, 18, 51–56 CrossRef CAS.
- V. Parry, G. Berthomé, J.-C. Joud, O. Lemaire and A. A. Franco, J. Power Sources, 2011, 196, 2530–2538 CrossRef CAS.
- T. A. Greszler, D. Caulk and P. Sinha, J. Electrochem. Soc., 2012, 159, F831–F840 CrossRef CAS.
Footnotes |
| † Electronic supplementary information (ESI) available: TEM images of Pt/C cathode MEAs after short-circuiting (Fig. S1 and S2), XPS survey scans (Fig. S3–S5), chemical state information obtained from the platinum spectrum of the cathode MEA before and after OCV with and without short-circuiting (Table S1), and polarization curves of PEMFCs under OCV with or without short-circuiting (Fig. S6–S10). See DOI: 10.1039/d0se00943a |
| ‡ P. Trogadas and J. I. S. Cho contributed equally. |
| This journal is © The Royal Society of Chemistry 2020 |


