 Open Access Article
Effect of partial pressure on product selectivity in Cu-catalyzed electrochemical reduction of CO2†
Mozhgan
Moradzaman
a,
Carlos Sánchez
Martínez
b and
Guido
Mul
 *a
*a
aPhotocatalytic Synthesis Group, Faculty of Science & Technology of the University of Twente, PO Box 217, Enschede, The Netherlands. E-mail: g.mul@utwente.nl
bDepartment of Sustainable Process and Energy Systems, TNO, Leeghwaterstraat 44, 2628 CA Delft, The Netherlands
First published on 17th August 2020
Abstract
The influence of CO2 partial pressure on electrochemical reduction of CO2 using oxide-derived electrodeposited copper surfaces in a conventional two compartment cell configuration, is discussed. Contrary to what has been reported in the literature for polished copper surfaces, demonstrating a linear decrease in the faradaic efficiency (FE) as a function of decreasing partial pressure, the (FE) and partial current density of both ethylene and methane are improved when the CO2 partial pressure is decreased below 1 atm, and an optimized ethylene efficiency of ∼45% is achieved in the range of ∼0.4–∼0.6 atm at −1.1 V vs. RHE. Such optimum in ethylene FE, ranging from ∼10–45%, is obtained at a variety of applied voltages (−0.7 to −1.1 V vs. RHE), but only at relatively low concentrations of KHCO3 of less than 0.25 M. Since a low KHCO3 concentration induces only a low buffer capacity, we conclude that a rise of local pH induced by a decreased CO2 partial pressure explains improved selectivity towards ethylene. If the CO2 partial pressure decreases below ∼0.4 atm, not only the availability of CO2 limits ethylene selectivity, but also a fall in local pH, associated with the decreasing partial current density in formation of ethylene. Calculations of local concentrations of CO2 and the pH corroborate these hypotheses. These findings contribute to, and substantiate the current understanding of the significant role of local pH conditions on the selectivity of CO2 electroreduction products, and suggest high ethylene selectivity over oxide derived Cu electrodes can be obtained for diluted CO2 feed compositions if the electrolyte has a relatively low buffer capacity.
1. Introduction
The accumulation of CO2 in the atmosphere is generally accepted to have significant impact on climate conditions. A promising methodology for reducing carbon dioxide is conversion of CO2 into fuels or commodity chemicals through an electrochemical process based on renewable electricity.1 Among the metal electrodes used, copper is the most extensively studied since it is capable of producing hydrocarbons from CO2 with high faradaic efficiencies.2–5 Although a broad mix of hydrocarbons and minor products have been reported, the main products at relatively high potentials are ethylene and methane.4,6,7 Ethylene is a desired product in electrochemical reduction of CO2, given the large market potential and use as feedstock for several industrial processes. In particular oxide-derived copper electrodes have been reported to show a high faradaic selectivity towards ethylene.8–11 Furthermore, significant progress has recently been made in increasing the current density towards ethylene by utilization of highly basic electrolytes in combination with advanced gas diffusion electrodes. Generally these studies have evaluated the cell performance using highly purified feeds (>98%). Yet direct utilization of flue gas would imply that the CO2 partial pressure is only ∼0.15 bar. Furthermore, the single-pass electrochemical conversion of CO2, even in gas-diffusion-based reactors, is still low,12 and recycling is required to increase the overall process efficiency. Thus, in practical applications, diluted concentrations of CO2 can be expected.Kenis et al. have nicely evaluated the effect of sub-atmospheric partial pressures on the performance of Ag-based gas diffusion electrodes, and showed that the decrease in partial current density for CO was less than 45% when switching from a pure CO2 feed to a feed of 10% CO2 in inert gas.12 Furthermore, Kyriacou et al.13 have conclusively shown that on smooth copper surfaces in 0.5 M KHCO3, the faradaic efficiency (FE) and the rates of formation of the reduction products, including ethylene, diminish linearly with decreasing PCO2, while the efficiency in hydrogen evolution increases.
Lum et al.,14 in their study focusing on the effect of surface roughness of copper electrodes in 0.1 M KHCO3, observed that the FE in methane formation improves when the PCO2 decreases from 1.0 to 0.8 or to 0.6 atm.
Finally, the effect of CO partial pressure on the formation of several products of electroreduction, has been investigated in detail.15–18 In a study by Wang et al.,18 a major decrease in partial current densities of CO reduction products is observed as a function of decreasing partial pressure of CO. Li et al.15 examined the effect of the local CO concentration on ethylene selectivity both theoretically and experimentally, and interestingly showed that constraining CO, favored ethylene production.
As discussed above, research on the subject of variations in partial pressure of CO2 has been mostly restricted to smooth copper electrodes or gas diffusion electrodes. Herein, we examine for the first time the effect of partial pressure on performance of rough, oxide-derived copper electrodes in the electrochemical reduction (CO2R) of CO2. This paper begins by investigating the effect of partial pressure at variable applied potential. It will then go on to correlate effects of partial pressure as a function of buffer (KHCO3) concentration, which highly affects the local surface pH. The third part deals with the effect of surface roughness, a factor also known to be responsible for the rise of local pH. The impact of the mentioned factors on local pH, proton activity and consequently hydrocarbon selectivity will be discussed on the basis of several results of calculation of the local concentration of CO2 and pH near the electrode.
2. Experimental section
2.1. Materials and film deposition
Cuprous oxide films were electrodeposited onto copper foils (Alfa Aesar, 99.99%) from Cu2+ containing solutions prepared using 0.4 M CuSO4 (Sigma Aldrich, 99%) and 3 M lactic acid (Sigma Aldrich) at 60 °C, according to a published procedure described elsewhere.19 A one-compartment, three electrode cell with Cu foil as working electrode, Pt mesh as counter electrode and Ag/AgCl (3 M NaCl) as the reference electrode were used. Copper foils were prepared by mechanical polishing and then electropolishing (in 85% phosphoric acid, potentiostatically at 2.1 V vs. a graphite foil counter electrode), followed by cleaning ultrasonically in ethanol and water. The pH of the solution was adjusted to 12 using NaOH (Sigma Aldrich, 98%). Galvanostatic deposition was performed at 0.8 mA cm−2 using a potentiostat/galvanostat (PAR, Versastat 3) until a desired film thickness was achieved. The structural and phase compositions of the deposited films were identified by XRD (Bruker D2 Phaser, equipped with a Cu-Kα radiation source operating at 30 kV and 10 mA).2.2. Electrochemical measurements
All electrochemical measurements were carried out using a Bio-Logic VSP potentiostat. A home-made two compartment electrochemical cell using a three electrode assembly was used to carry out the CO2 electrochemical reduction. The as-prepared cuprous oxide films with the thickness equivalent to a total charge of 3 C (Coulomb) were used as the working electrode, unless another thickness is mentioned. Glassy carbon (SIGRADUR® G) was used as the counter electrode and was separated from the working electrode using an anion exchange membrane (Selemion AMV, AGC, Inc.). Ag/AgCl in 3 M NaCl was used as a reference electrode and potentials were converted to the Reversible Hydrogen Electrode (RHE) scale by:| Vvs. RHE = Vmeasured vs. Ag/AgCl + 0.198 + 0.059 × (pH of solution). |
The electrolyte solutions of KHCO3 (Sigma-Aldrich, 99.99% metals basis) were prepared with deionized water (Millipore MilliQ, 18.2 MΩ cm), in concentrations ranging from 0.05 M to 0.5 M. The gas mixture (CO2 and He) was continuously purged through a glass frit at a rate of 20 ml min−1 for 30 minutes before each experiment, using two mass flow controllers, to attain steady CO2 concentration in the electrolyte. The pH of the electrolytes of various concentrations of KHCO3 and PCO2 was monitored. The flow rate was decreased to 5 ml min−1 during the electrochemical reduction experiments. The reactor effluent was then vented directly into the gas sampling loop of a micro-gas chromatograph (micro-GC) equipped with a pulsed discharge detector (PDD) every 4 minutes. The micro-GC was equipped with two different columns (Molsieve plot and Rt-Q Bond) for separation of H2, O2, CO, CO2 and hydrocarbons. The mass balance was typically closed within +90%, and therefore the electrolyte was not analyzed for liquid phase products, which based on other studies most likely contains some formate/formic acid, as will be further addressed in the description of the results. Average faradaic efficiencies were obtained by averaging results from the last 3 injections in the GC analysis. Each experiment was repeated 3 times to establish statistical significance of the data. Error between measurements was calculated by means of standard deviation of the mean for Fig. 2a and 3. Due to an error margin below 10%, the error bars are not included in the other figures.
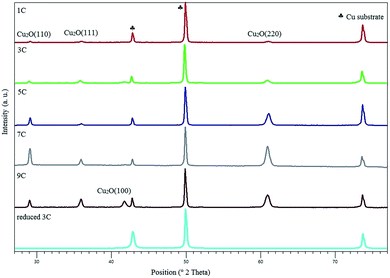 | ||
| Fig. 1 XRD of Cu2O electrodes with increase in thickness. The diffraction pattern shown at the bottom was obtained after electrochemical reduction. | ||
2.3. Electrochemical surface area measurements
The relative surface roughness factors of the electrochemically active surfaces were calculated by measuring the double layer capacitance values in 0.1 M KCl. Pt mesh was used as a counter electrode and Ag/AgCl was used as reference electrode. After reducing the layers in 0.1 M KHCO3, cyclic voltammetry (CV) was performed with different scan rates (5, 20, 40, 60, 80, 100 mVs−1) in the potential range in which no faradaic processes occur. The slope of the (difference in) current density vs. scan rate gave the capacitance value which was normalized to smooth copper, to obtain the surface roughness factors.2.4. Modelling methodology
The modelling approach was analogous to the one reported by Gupta et al.20 In such 1-D model, a 3-region system is considered, being ‘Bulk’, ‘Boundary Layer’ and ‘Electrode Surface’ in a batch, isothermal, and non-stationary situation. This is representative of the experimental set-up used in the present study. Only the cathodic half-cell is described in the model, as it is considered to be the limiting reaction in the whole electrochemical process (in the anodic half-cell, the oxygen evolution reaction takes place). The thickness of the ‘Boundary Layer’ region is given by the input parameter δ, which is taken to be 100 μm, in accordance with previous literature;20,21 for the current density j, the experimentally obtained value of 25 mA cm−2 was used.At the ‘Bulk’ region, the equilibria of all dissolved species, CO2(aq) and KHCO3, were considered. The equation of state for the calculation of the CO2 saturation concentration in pure water was taken from Duan et al.22 Then, the salt-out effect due to the presence of an electrolyte is also considered using the model from Schumpe,23 having as output a saturated concentration of CO2(aq), given a certain pressure, temperature and initial KHCO3 concentration. Bulk equilibria for the buffered system CO2(aq)–KHCO3 were calculated having as input CO2(aq) (after salt-out effect) and KHCO3 initial concentrations. It is assumed that the ‘Bulk’ region is unaffected by the electrochemical reaction at the ‘Electrode Surface’, and neither by the transport effect in the ‘Boundary Layer’.
At the ‘Boundary Layer’ region, two phenomena are taking place: diffusion of all species (modelled with Fick's 2nd Law), and homogeneous equilibrium reactions for the buffered system CO2(aq)–KHCO3. All necessary data for these two effects were taken from Gupta et al.,20 for a constant temperature. It is assumed that diffusion is the only transport mechanism for the reactive species to reach the ‘Electrode Surface’ region. Resulting equations are a set of Partial Differential Equations (PDE), solved with the PDE method in Matlab R2019A. Initial conditions (at instant zero and all spatial domains) consider that the concentration of all species is equal to the concentrations at the ‘Bulk’ region (from the equilibrium calculations). Boundary conditions at x = 0 (considering the border with ‘Bulk’ region to be x = 0, at all-time domains) assume that concentrations are equal to the ‘Bulk’ region equilibrium concentrations. Boundary conditions at x = δ (considering the border with ‘Electrode Surface’ region to be x = δ, at all time domains) presume that a Neumann boundary condition is applied. Consumption or formation rates for the set of electrochemical reactions (only affecting CO2(aq) and OH−) are used in this boundary layer.
At the ‘Electrode Surface’ region, the CO2(aq) consumption and OH− formation rates are calculated from the given faradic Efficiency values taken from the experimental data. All products formed at the electrode are considered not to affect the modelled system and have been neglected. Since faradaic efficiency values are constant with respect to current density, reactant concentration, or other variables, the CO2(aq) consumption and OH− formation rates are therefore constant. The only considered products are: H2 by hydrogen evolution, and CH4, C2H4, and CO by CO2R.
3. Results and discussion
3.1. Electrochemical deposition of Cu2O films
The XRD patterns of the as prepared Cu2O films with varying thickness and a reduced electrode are shown in Fig. 1. It can be seen that with an increase in thickness, the intensity of the Cu2O (110), (111), (100) and (220) diffraction lines increases while the intensity of the peaks associated with metallic copper (the substrate) decrease. The observed change in orientation (for the 9 C sample) is believed to be the result of pH and Cu+ variations during electrodeposition.24 Furthermore, XRD patterns of the reduced copper electrode signify that the surface of the oxide film had been fully reduced to metallic copper during CO2R, consisting of Cu (111), (220) and (200). The predominant orientation of Cu is (200). SEM images of oxide-derived copper with the thickness of 3 C, before and after electrochemical reduction, are shown in Fig. S1 of the ESI.† A rough surface is obtained consisting of pyramidal shapes, showing cracks after electrochemical reduction. This is in agreement with the observations of Kas et al.273.2. CO2R in 0.1 M KHCO3 at various partial pressures and potentials
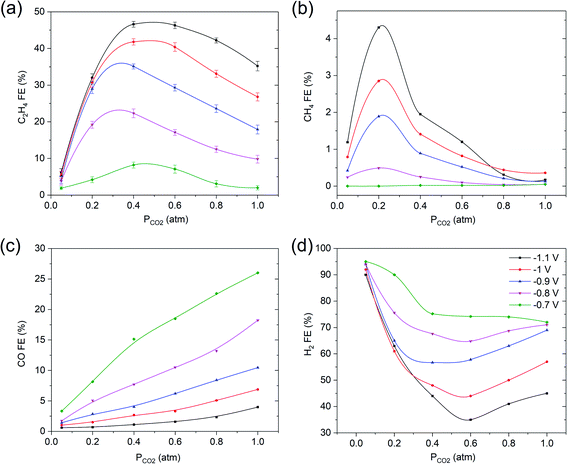
Electrochemical measurements were initially conducted at fixed potentials varying from −0.7 V to −1.1 V vs. RHE in 0.1 M KHCO3 electrolyte as function of a PCO2 ranging from 0.05 to 1 atm. The most striking observation to emerge from this study is the trend of FE of C2H4 and CH4 as function of PCO2 (see Fig. 2a and b). What stands out is that upon decreasing PCO2, the FEC2H4 continuously increases until reaching a maximum at PCO2 = 0.4 atm, followed by a sharp drop at PCO2 = 0.05 atm. Furthermore, in the case of CH4, the FECH4 strongly increases between 0.4 and 0.2 atm, until it sharply falls between PCO2 = 0.2 atm and PCO2 = 0.05 atm. On the other hand, the FE of CO linearly diminishes with decreasing PCO2, as previously reported in the literature.13,14The sharp decline in FE of ethylene is correlating to a sharply increasing H2 efficiency below 0.4 atm (Fig. 2d, note that the y-axis scales between 30–100%). The trend in FE of hydrogen production approximately mirrors the FE of C2H4, suggesting an inverse correlation between hydrogen and ethylene production. Finally, the various results reported in Fig. 2 indicate that the FE towards ethylene is strongly potential dependent, −1.1 V vs. RHE being optimal, while the formation of CO and hydrogen are favored at relatively low potential. This is further illustrated in Fig. S2,† which shows the partial current density vs. potential (V vs. RHE) of C2H4, CH4, CO and H2 under varying PCO2 in 0.1 M KHCO3. Please note that the total current density during the experiments was relatively constant, at 28 ± 2 mA.cm−2 (see Fig. S2†).
3.3. CO2R in various KHCO3 electrolyte concentrations
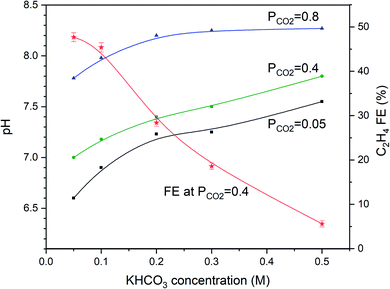
To evaluate whether the strong dependency of the ethylene FE shown in Fig. 2 is depending on electrolyte concentration (and pH), we varied the KHCO3 concentration and evaluated the pH as a function of PCO2, as shown in Fig. 3. Fig. 3 shows that the higher the KHCO3 concentration is, the stronger is the buffer capacity, leading to higher values of the bulk pH at variable partial pressure of CO2. At the same time, the higher the pressure of CO2, the lower the pH of the bulk solution appears to be, as expected from equilibrium calculations.Fig. 3 shows that an inverse trend between concentration of the KHCO3 solution (and solution pH) and FE towards ethylene at PCO2 = 0.4 atm exists. While the pH of the solution increases as a function of increasing KHCO3 concentration, the FEC2H4 decreases. However, the pH near the electrode surface significantly deviates from that of the solution, as will be discussed in more detail in the discussion of the model data. More experimental data of the combinations of PCO2 and concentration of electrolyte are shown in Fig. 4a–d. With increasing buffer strength of the electrolyte, the trend in FEC2H4 as a function of PCO2 changes from an optimum at ∼0.4 atm, to an almost continuous trend with the highest KHCO3 concentration at 0.5 M.
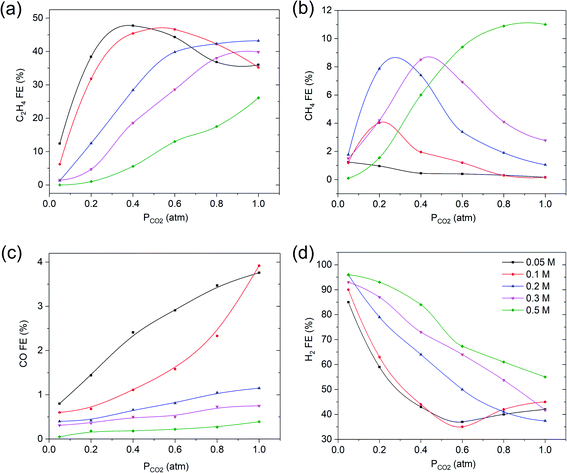 | ||
| Fig. 4 The effect of varying KHCO3 electrolyte concentrations at −1.1 V vs. RHE on faradaic efficiency of (a) C2H4, (b) CH4, (c) CO and (d) H2. The solid lines are there to guide the eye. | ||
Fig. 4b reveals that with increasing the electrolyte concentration, the maximum in FECH4 increases, and takes place at gradually increasing values of PCO2 at higher KHCO3 concentrations. The FECO decreases with decreasing PCO2 for all KHCO3 electrolyte concentrations investigated (Fig. 3c), with the highest FE at the lowest concentrations. Again the FE of hydrogen evolution shows an inverse correlation with ethylene (Fig. 3d), and is the lowest at the lowest concentration of KHCO3 electrolyte.
3.4. CO2R on different cuprous oxide film thicknesses
The third, and last correlation investigated, was how the combination of variation in surface roughness and CO2 partial pressure affect the FE. Sample surface roughness, relative to that of smooth copper, is reported in Table 1. As the oxide layer thickness increases, the roughness factors of the in situ formed nanoparticulate copper surface increase as well, in agreement with the data of Kas et al.27| Charge passed through (C cm−2) | Capacitance (mF) | Surface roughness factor |
|---|---|---|
| Electropolished copper | 0.26 | 1 |
| 1 | 2.8 | 11 |
| 3 | 4.56 | 18 |
| 5 | 6.87 | 26 |
| 7 | 10.86 | 42 |
| 9 | 11.33 | 44 |
CO2R on copper electrodes with different oxide thicknesses was conducted at −1.1 V vs. RHE in 0.1 M KHCO3 at various partial pressures of CO2. Fig. 5 shows that a thicker film with higher surface roughness, leads to a lower optimum FE in ethylene and methane at partial pressures of CO2 in the range of 0.2–0.8 atm or 0.05 to 0.3 atm, respectively, while the formation of hydrogen is favored by the increasing thickness of the film. These observations are in agreement with previous studies, also showing a decrease in ethylene selectivity when the surface roughness increases,21,25–28 but these have not been discussed in detail. We assume that multiple layers of copper, will lead to a certain porosity of the film, and therefore lower accessibility of CO2 towards the reduced copper sites closest to the electrode inner surface. While the local pH will be high in/near these porous films, the low concentration of CO2 likely limits the formation of ethylene. This is in agreement with the low amount of methane formed for thicker films, which is also restricted by the availability of CO2. Detailed studies and modeling of mass transport in porous layers is required to corroborate this hypothesis.
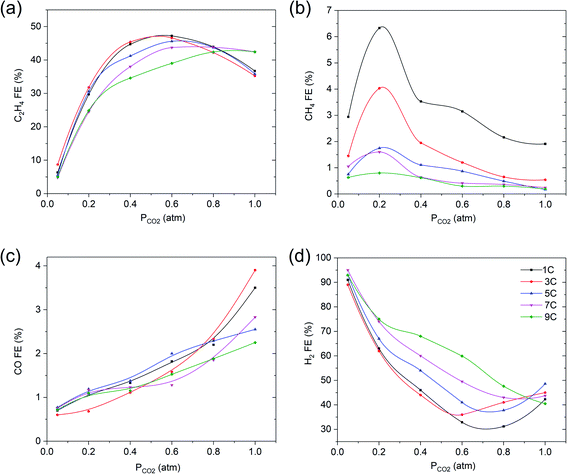 | ||
| Fig. 5 Faradaic efficiency vs. PCO2 of (a) C2H4, (b) CH4, (c) CO and (d) H2 for various oxide layer thicknesses at −1.1 V vs. RHE in 0.1 M KHCO3. The solid lines are there to guide the eye. | ||
It remains striking that the FE of C2H4 and CO is much lower for smooth copper surfaces than obtained for the thinnest modified, oxide-derived film (see Fig. 6 and compare to Fig. 5). The methane FE is much higher than observed for ex-oxide derived surfaces, and in agreement with other CO2/CO electroreduction studies on smooth copper surfaces. A linear dependency of the ethylene selectivity as a function of partial pressure of CO2 is observed.13,16,18
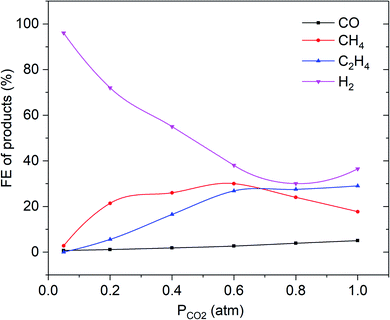 | ||
| Fig. 6 Faradaic efficiency vs. PCO2 of C2H4, CH4, CO and H2 for electropolished Cu electrode at −1.1 V vs. RHE in 0.1 M KHCO3. The solid lines are there to guide the eye. | ||
Hydrogen evolution continuously increases with a decrease in PCO2 below 0.8 atm.
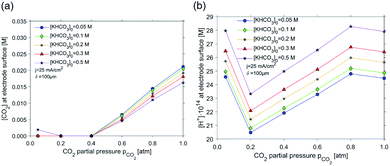
As is demonstrated in Fig. 7a, the concentration of CO2 near the electrode surface decays as a function of partial pressure, and the trend is not strongly dependent on the initial KHCO3 concentration. Generally, for all KHCO3 concentrations taken into consideration, a depletion in the CO2 concentration can be discerned starting from a CO2 partial pressure of 0.4 atm. For the 0.50 M KHCO3 series, depletion in CO2 concentration can be observed at 0.2–0.4 atm, rising slightly at 0.05 atm. Depletion of CO2 can be correlated to the minimum in proton concentration at CO2 partial pressures of 0.2–0.6 bar in Fig. 7b. These two observed facts correlate to the high FE towards ethylene (and rise in methane FE) in the CO2 partial pressure range of 0.2–0.6 atm, as is evident from the experimental results shown in Fig. 2 and 4. While decreasing the partial pressure evidently results in a lower local concentration of CO2 (which should lower ethylene selectivity), this also results in an increasing basicity (lower H+ concentration in Fig. 7b) near the electrode surface. This overcompensates for the lower CO2 concentration, and leads to better selectivity in ethylene. The decreasing trend in H+ concentration is further stimulated by the exceptionally high consumption of H+, which accompanies CO2R to C2H4: 12 moles of H+ per mole of C2H4 are consumed (or 12 moles of OH− formed), while hydrogen evolution only converts 2 moles of H+ per mole of H2 produced. Since the CO2 concentration depletes at low partial pressures, ethylene can no longer be formed, explaining the lower FE towards ethylene at partial pressure below 0.4 bar, and the rise in local concentrations of H+, as shown in Fig. 7b. It is interesting to note that for all studied concentrations of KHCO3, such minimum in proton concentration in Fig. 7b increases in absolute value of proton concentration as the buffer capacity goes up. This trend is in accordance with the experimental results for ethylene selectivity. A higher proton concentration results in a lower ethylene formation rate (and rate of CH4 formation, which also has a high H+ consumption per mol of C-product).
The modeling results thus strongly suggest that the local pH (proton concentration) near the surface of the electrode is strongly correlated to the selectivity towards ethylene in the electrochemical reduction of CO2.
An analogous reasoning can be proposed for the formation of ethylene, where the surface concentration of COads (assuming CO dimerization is the limiting step for the formation of ethylene) needs to be significantly higher than for the formation of CH4. Therefore the optimum in production of ethylene occurs at relatively higher partial pressures of CO2, than the optimized formation of CH4. This is in agreement with existing literature, such as a previous study of Raciti et al.,28 who also demonstrates a high local pH is needed for maximal selectivity toward multi-carbon products.
Conclusions
In general, our results confirm that the local pH, i.e. the pH near the surface of the electrode, is largely affecting the selectivity of roughened, oxide-derived copper electrodes in the electrochemical reduction of CO2 towards ethylene. What is new, is that for the utilized roughened electrodes, the selectivity towards C2+ products does not depend linearly on partial pressure of CO2. We have demonstrated experimentally, and by modeling, that the partial pressure of CO2 has a small, yet significant effect on local pH, in particular when the buffer capacity of the applied electrolyte (KHCO3) is limited (at low concentrations of ∼0.05 M). This implies that the partial pressure not only directly affects the near-surface concentration of CO2 (required for the formation of CO and consecutively CH4 and C2H4), but also indirectly affects the local pH, which is essential in determining product selectivity.Funding sources
MM was financially supported by the NWO financed Solar to Products project 733.000.008 – ‘Electrochemical reduction of CO2 to ethylene’.Conflicts of interest
There are no conflicts to declare.References
- N. S. Lewis and D. G. Nocera, Powering the planet: Chemical challenges in solar energy utilization, Proc. Natl. Acad. Sci. U. S. A., 2006, 103(43), 15729–15735 CrossRef CAS PubMed.
- Y. Hori, K. Kikuchi, A. Murata and S. Suzuki, Production of methane and ethylene in electrochemical reduction of carbon dioxide at copper electrode in aqueous hydrogencarbonate solution, Chem. Lett., 1986, 15(6), 897–898 CrossRef.
- Y. Hori, K. Kikuchi and S. Suzuki, Production of CO and CH4 in electrochemical reduction of CO2 at metal electrodes in aqueous hydrogencarbonate solution, Chem. Lett., 1985, 14(11), 1695–1698 CrossRef.
- K. P. Kuhl, E. R. Cave, D. N. Abram and T. F. Jaramillo, New insights into the electrochemical reduction of carbon dioxide on metallic copper surfaces, Energy Environ. Sci., 2012, 5(5), 7050–7059 RSC.
- Y. i. Hori, Electrochemical CO2 reduction on metal electrodes, in Modern aspects of electrochemistry, Springer, 2008, pp. 89–189 Search PubMed.
- H. Shibata, J. A. Moulijn and G. Mul, Enabling electrocatalytic Fischer–Tropsch synthesis from carbon dioxide over copper-based electrodes, Catal. Lett., 2008, 123(3–4), 186 CrossRef CAS.
- Y. Hori, I. Takahashi, O. Koga and N. Hoshi, Electrochemical reduction of carbon dioxide at various series of copper single crystal electrodes, J. Mol. Catal. A: Chem., 2003, 199(1), 39–47 CrossRef CAS.
- D. Ren, Y. Deng, A. D. Handoko, C. S. Chen, S. Malkhandi and B. S. Yeo, Selective Electrochemical Reduction of Carbon Dioxide to Ethylene and Ethanol on Copper(I) Oxide Catalysts, ACS Catal., 2015, 5(5), 2814–2821 CrossRef CAS.
- A. D. Handoko, C. W. Ong, Y. Huang, Z. G. Lee, L. Lin, G. B. Panetti and B. S. Yeo, Mechanistic Insights into the Selective Electroreduction of Carbon Dioxide to Ethylene on Cu2O-Derived Copper Catalysts, J. Phys. Chem. C, 2016, 120(36), 20058–20067 CrossRef CAS.
- C. W. Li and M. W. Kanan, CO2 Reduction at Low Overpotential on Cu Electrodes Resulting from the Reduction of Thick Cu2O Films, J. Am. Chem. Soc., 2012, 134(17), 7231–7234 CrossRef CAS PubMed.
- R. Kas, R. Kortlever, A. Milbrat, M. T. M. Koper, G. Mul and J. Baltrusaitis, Electrochemical CO2 reduction on Cu2O-derived copper nanoparticles: controlling the catalytic selectivity of hydrocarbons, Phys. Chem. Chem. Phys., 2014, 16(24), 12194–12201 RSC.
- B. Kim, S. Ma, H.-R. M. Jhong and P. J. Kenis, Influence of dilute feed and pH on electrochemical reduction of CO2 to CO on Ag in a continuous flow electrolyzer, Electrochim. Acta, 2015, 166, 271–276 CrossRef CAS.
- G. Kyriacou and A. Anagnostopoulos, Influence CO2 partial pressure and the supporting electrolyte cation on the product distribution in CO2 electroreduction, J. Appl. Electrochem., 1993, 23(5), 483–486 CAS.
- Y. Lum, B. Yue, P. Lobaccaro, A. T. Bell and J. W. Ager, Optimizing C–C coupling on oxide-derived copper catalysts for electrochemical CO2 reduction, J. Phys. Chem. C, 2017, 121(26), 14191–14203 CrossRef CAS.
- J. Li, Z. Wang, C. McCallum, Y. Xu, F. Li, Y. Wang, C. M. Gabardo, C.-T. Dinh, T.-T. Zhuang, L. Wang, J. Y. Howe, Y. Ren, E. H. Sargent and D. Sinton, Constraining CO coverage on copper promotes high-efficiency ethylene electroproduction, Nat. Catal., 2019, 2(12), 1124–1131 CrossRef CAS.
- M. Schreier, Y. Yoon, M. N. Jackson and Y. Surendranath, Competition between H and CO for active sites governs Cu mediated electrosynthesis of hydrocarbon fuels, Angew. Chem., Int. Ed., 2018, 130, 10378–10382 CrossRef.
- J. Li, K. Chang, H. Zhang, M. He, W. A. Goddard, J. G. Chen, M.-J. Cheng and Q. Lu, Effectively Increased Efficiency for Electroreduction of Carbon Monoxide Using Supported Polycrystalline Copper Powder Electrocatalysts, ACS Catal., 2019, 9(6), 4709–4718 CrossRef CAS.
- L. Wang, S. A. Nitopi, E. Bertheussen, M. Orazov, C. G. Morales-Guio, X. Liu, D. C. Higgins, K. Chan, J. K. Nørskov and C. Hahn, Electrochemical carbon monoxide reduction on polycrystalline copper: Effects of potential, pressure, and pH on selectivity toward multicarbon and oxygenated products, ACS Catal., 2018, 8(8), 7445–7454 CrossRef CAS.
- T. D. Golden, M. G. Shumsky, Y. Zhou, R. A. VanderWerf, R. A. Van Leeuwen and J. A. Switzer, Electrochemical deposition of copper (I) oxide films, Chem. Mater., 1996, 8(10), 2499–2504 CrossRef CAS.
- N. Gupta, M. Gattrell and B. MacDougall, Calculation for the cathode surface concentrations in the electrochemical reduction of CO2 in KHCO3 solutions, J. Appl. Electrochem., 2006, 36(2), 161–172 CrossRef CAS.
- Y. Hori, A. Murata and R. Takahashi, Formation of hydrocarbons in the electrochemical reduction of carbon dioxide at a copper electrode in aqueous solution, J. Chem. Soc., Faraday Trans. 1, 1989, 85(8), 2309–2326 RSC.
- Z. Duan and R. Sun, An improved model calculating CO2 solubility in pure water and aqueous NaCl solutions from 273 to 533 K and from 0 to 2000 bar, Chem. Geol., 2003, 193(3), 257–271 CrossRef CAS.
- A. Schumpe, The estimation of gas solubilities in salt solutions, Chem. Eng. Sci., 1993, 48(1), 153–158 CrossRef CAS.
- S. Joseph and P. V. Kamath, Electrodeposition of Cu2O Coatings on Stainless Steel Substrates Control over Orientation and Morphology, J. Electrochem. Soc., 2007, 154(7), E102–E106 CrossRef CAS.
- M. Ma, K. Djanashvili and W. A. Smith, Controllable hydrocarbon formation from the electrochemical reduction of CO2 over Cu nanowire arrays, Angew. Chem., 2016, 128(23), 6792–6796 CrossRef.
- A. S. Varela, M. Kroschel, T. Reier and P. Strasser, Controlling the selectivity of CO2 electroreduction on copper: The effect of the electrolyte concentration and the importance of the local pH, Catal. Today, 2016, 260, 8–13 CrossRef CAS.
- R. Kas, R. Kortlever, H. Yılmaz, M. T. Koper and G. Mul, Manipulating the hydrocarbon selectivity of copper nanoparticles in CO2 electroreduction by process conditions, ChemElectroChem, 2015, 2(3), 354–358 CrossRef CAS.
- D. Raciti, M. Mao, J. H. Park and C. Wang, Local pH Effect in the CO2 Reduction Reaction on High-Surface-Area Copper Electrocatalysts, J. Electrochem. Soc., 2018, 165(10), F799–F804 CrossRef CAS.
Footnote |
| † Electronic supplementary information (ESI) available. See DOI: 10.1039/d0se00865f |
| This journal is © The Royal Society of Chemistry 2020 |

