 Open Access Article
Creative Commons Attribution 3.0 Unported Licence
Bipolar-interface fuel cells – an underestimated membrane electrode assembly concept for PGM-free ORR catalysts
Dominik
Seeberger
ab,
David
McLaughlin
ab,
Pascal
Hauenstein
ab and
Simon
Thiele
 *ab
*ab
aForschungszentrum Jülich GmbH, Helmholtz-Institute Erlangen-Nürnberg for Renewable Energy (IEK-11), Egerlandstr. 3, 91058 Erlangen, Germany. E-mail: si.thiele@fz-juelich.de
bDepartment of Chemical and Biological Engineering, Friedrich-Alexander University Erlangen-Nürnberg, Egerlandstr. 3, 91058 Erlangen, Germany
First published on 26th March 2020
Abstract
We present the first combination of a bipolar interface fuel cell with a commercial Fe–N/C catalyst as an alkaline cathode and a PGM-based, acidic anode, both separated by a proton exchange membrane (PEM). This membrane electrode assembly (MEA) concept enables the employment of Fe–N/C catalysts in a less corrosive alkaline environment, while simultaneously keeping the profound advantages of the hydrogen oxidation reaction in acidic media with extremely low PGM-material requirement. We compare two different cases for the anion exchange polymer–proton exchange polymer (AEM|PEM) interface at the alkaline cathode and the acidic membrane. In one case the PEM is simply pressed against the alkaline electrode and in the other case a part of the PEM is deposited onto the alkaline electrode. We achieved power densities of about 38 mW cm−2 and 210 mW cm−2 respectively. This is corresponding to 2.1 W mgPt−1 cm−2. Our results show, that the bipolar interface design is one of the most important factors for performance optimization in BPM fuel cells. In addition, we compared a conventional PEM fuel cell with identical Fe–N/C cathode loading to the bipolar deposition case. After a 15 hour test run the PEMFC cell showed a strongly increased overpotential at lower current densities, whereas the overpotential increase for the bipolar cell was only marginally in the same current density region. With this work we show a facile manufacturing approach that enables bipolar interface fuel cells with Fe–N/C catalysts, showing promising power densities at low total PGM-loadings.
Introduction
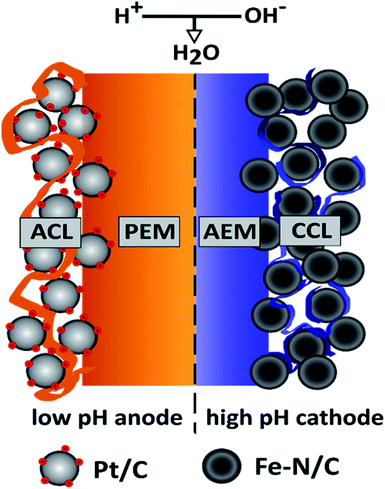
In present-day research PEMFCs are the prevailing fuel cell type for PGM-free oxygen reduction reaction (ORR) catalysts, like Fe–N/C. This fact is mainly attributed to the high power densities achieved at low to medium temperatures and the sophisticated, commercially available fuel cell components like catalysts and highly conductive proton exchange membranes. But stability studies on Fe–N/C ORR-catalysts in acidic media revealed that catalyst deactivation occurs via carbon corrosion at potentials above 0.9 V and via Fe demetallation at potentials below 0.7 V.1 This is one of the reasons anion exchange membrane fuel cells (AEMFCs) became a focus of interest. The alkaline environment facilitates the use of a broader range of material classes, like hydrocarbon based ionomers and provide a more stable operating environment for non-PGM ORR-catalysts.2 However, the exchange current densities for the HOR in alkaline media are at least one order of magnitude slower than in acidic media.3 This consequently increases the anode overpotential losses (which are nearly negligible in PEMFCs) in an AEMFC to an extent, where high Pt-loadings or extensive research on novel PGM-free HOR catalysts are necessary to compensate for those losses. In our opinion, when considering the AEMFC-technology as an option to stabilize PGM-free catalysts, to reduce overall device costs, it is counterproductive to increase the amount of PGMs at the anode to a level similar or even higher than in an entire state-of-the-art PEMFC.2–4An alternative, desirable implementation of PGM-free ORR-catalysts would combine the best of both worlds. By providing a non-corrosive, alkaline environment at the PGM-free cathode side the catalyst would be stabilized. Additionally, an acidic anode environment would reduce the anode overpotential and consequently the required PGM-loading to a minimum. In 2009 Ünlü et al. introduced a fuel cell configuration concept, with one electrode operating at high and the other electrode operating at low pH.5 The schematic illustration of such a hybrid fuel cell setup with a PGM-free cathode and its fundamental working principle is shown in Fig. 1.
The main difference between the hybrid configuration and the PEMFC/AEMFC configurations on their own are the sites of the water formation and consumption reaction: in the PEMFC water is produced at the cathode, in the AEMFC at the anode. In contrast to the conventional fuel cell configurations the water formation reaction is not located within the electrodes, but at the interface of the PEM and the AEM within the membrane. This combination of a PEM and an AEM is often referred to as a ‘bipolar membrane’, since the interface forms a junction similar to the p–n junction in a semiconductor. For a more detailed description of the theoretical background of the bipolar “PEM|AEM” junction, see Ünlü et al.5 The overall electrochemical reaction for the bipolar membrane fuel cell (BPMFC) can be split into the half-cell and the interface reactions as following:
Anode:
| H2 → 2H+ + 2e−; E0A = 0.00 V (SHE) | (1) |
Cathode:
| ½O2 + H2O + 2e− → 2OH−; E0C = 0.40 V (SHE) | (2) |
Interface:
| 2H+ + 2OH− → 2H2O | (3) |
Full cell:
| ½O2 + H2 → H2O; EBPMFC = 1.23 V | (4) |
Although the ORR in alkaline media is shifted to lower potentials, compared to acidic media, the thermodynamically cell potential is 1.23 V, as the overall reaction remains identical to the reaction in classical fuel cell designs. The lower ORR potential is compensated by a potential at the bipolar membrane interface. This interfacial potential arises from fixed charges on each side of the interface, creating an electric field and consequently a potential difference between the AEM and PEM.5
Since the development of the first BPMFC 10 years ago nearly all studies were performed on Pt-based catalysts and mostly concentrated on the functionality and the development of different MEA architectures.5,6 Although the employment of PGM-free catalysts was suggested since the first BPMFC in 2009, only one detailed study enabling silver in the CCL was published since then by Xu et al. Due to an optimization of the CCL ionomer content they reached an optimized fuel cell performance of 19.3 mW cm−2 under dry gas feed conditions.7 Additionally, Ramani and coworkers demonstrated another bipolar MEA configuration with a Ag based cathode under fully humidified conditions and a resulting power density of ∼50 mW cm−2.8
As demonstrated in previous work, a crucial element that needs to be taken into account, when manufacturing MEAs, is the quality of the individual layer interfaces.9 In contrast to conventional FCs (PEMFC and AEMFC) in BPMFCs an additional interface is introduced by the “PEM|AEM” junction, creating a localized reaction zone for the water formation reaction in the membrane. The local confinement of an electrochemical reaction is contrary to the conventional FCs, where the water formation reaction is distributed over the corresponding electrode and is not fully localized at the respective interface. Therefore, the main development focus for BPMFCs should be extended to the “PEM|AEM” interface and not only be restricted to an electrode optimization process.
Previous publications focused on the development of the CL|PEM interface in conventional PEMFCs, by employing a manufacturing approach called “direct membrane deposition” (DMD).10–12 The DMD approach substitutes the catalyst coated membrane (CCM) with two gas diffusion electrodes (GDE) being coated with ionomer solution and forming the PEM after solvent evaporation and additionally eliminating the need for a hot-pressing step. The application of the ionomer solution can be executed with a variety of manufacturing approaches like ink-jet printing,10 ultrasonic spray coating11 or as realized in this work via doctor-blading. DMD opens up the possibility to manipulate essential fuel cell membrane parameters like mechanical and chemical stability by implementing electrospun polymer nanofibers13 or radical scavengers like cerium-oxide.14 Additionally DMD is capable of fabricating membranes as thin as 12 μm. MEAs fabricated with DMD have demonstrated a more than 100% increased power density of 4 W cm−2 (300 kPa O2) compared to a CCM with identical membrane thickness and identical catalyst loading.15 The main reason for the high power densities was attributed to a dramatically reduced charge transfer and mass transport resistance, originating from the enhanced contact of the PEM and the ionomer in the electrode at the CL|PEM interface.12
The manufacturing of state-of-the-art BPMFCs is typically performed by hot-pressing a PEM and an AEM to create the bipolar membrane. Also state-of-the-art BPMFCs rely on the usage of GDEs, attributable to material inherent manufacturing processes like the common KOH-treatment of the AEM-materials. Our hypothesis was that DMD, in contrast to the commonly used PEM/AEM or GDE/BPM hot-pressing steps, might not only lower the internal resistance of the BPMFC, but also might have the potential to enhance the interfacial contact at the PEM|AEM junction, resulting in drastically increased power densities.
This work is the first one that enables DMD as a facile tool to create and manipulate the additional PEM|AEM interface in BPMFCs. Moreover, this is the first reported usage of an M–N/C ORR catalyst in a BPMFC. In addition, this work demonstrates the first exploration of doctor-blading as a tool to manufacture half-MEAs via DMD. To emphasize the importance of this novel and easy manufacturing approach, it was desisted to employ self-made materials and rely on commercially available materials only.
During this study, we focus on the variation of the PEM|AEM interface to better understand its importance for BPMFCs. In the second part, we investigated the potential benefits of BPMFCs for the mitigation of the Fe–N/C degradation. This degradation is commonly observed in classical PEMFCs. For this reason, we manufactured three different MEA architectures in this work: compressed BPMFC (c-BPMFC), deposited BPMFC (d-BPMFC), and reference PEMFCs. They are schematically depicted in Fig. 2.
We designed the compressed BPMFC (c-BPMFC) configuration to create the BPM interface by physical compression of the two half-MEAs only. Contrary to that, the BPM interface in the deposited BPMFC (d-BPMFC) configuration emerges from directly casting half of the PEM on the alkaline part of the MEA. To prevent direct contact between PEM and catalytic active centres of the catalyst a thin layer of AEM was casted onto the alkaline CCL for both BPMFC-configurations beforehand. The total thickness of the PEM was kept constant for both configurations. The d-BPMFC was physically analysed with SEM-cross-section images and the evolution of the BPM interface was studied via cross-section and surface images to evaluate possible morphological changes of the electrode and the quality of the interfacial contact. The BPMFCs were characterized with a fuel cell characterisation setup, such as electrochemical impedance spectroscopy (EIS) and current-interrupt iR measurements, also in regards to pressure dependency. In the second part the d-BPMFC configuration was compared to the PEMFC configuration, in regards to fuel cell data collected before, during and after continuous operation at constant current and potentials below 0.7 V.
Results and discussion
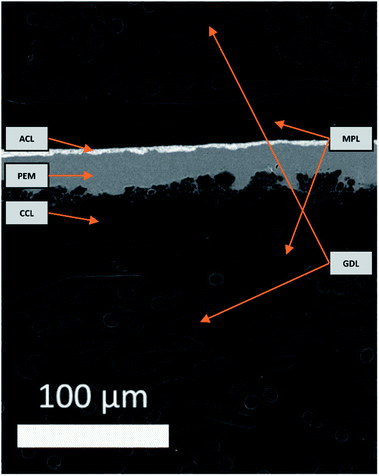
Physical characterization
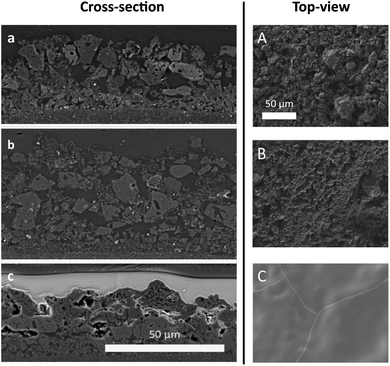
An electron image of the d-BPMFC cross-section is provided in Fig. 3. The image shows the layer structure of this design. Clearly visible is the junction between catalyst layer and membrane. Here the membrane conforms to the structure of the catalyst layer.We documented the manufacturing process by imaging cross sections and surfaces following each major step. The steps include the deposition of the CCL, the infiltration of the CCL with the AEM and the deposition of the PEM in the last step. Fig. 4 shows the surface images and the cross section images for the individual manufacturing steps. Both for the plain and the AEM coated sample (Fig. 4A and B) a rough surface is observed. Following the coating with Nafion a smooth surface is observed (Fig. 4C). Thus a large interface is expected, if the Nafion conforms to the surface of the catalyst layer. Fig. 4a and b also reveal that the AEM does not significantly decrease the surface roughness at the scale accessible by a mechanical cross section. In general, no major change can be observed between the AEM coated and untreated catalyst layer. Fig. 4c indicates that the Nafion conforms to the surface of the AEM treated catalyst layer. Additionally, it appears to infiltrate the upper layers of the catalyst layer. This could lead to an even larger bipolar interface. While we cannot assert this, without verifying that the AEM interlayer infiltrates the catalyst layer to the same degree. The bipolar interface would be substantially large than both the geometric area and the surface roughness indicates.
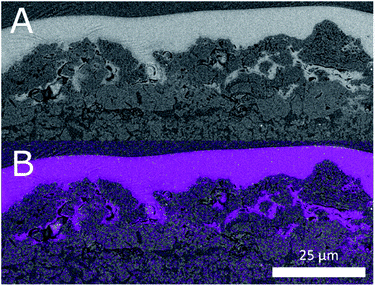 | ||
| Fig. 5 (A) In-lens backscattered electron image of the Fe–N/C catalyst layer and PEM interface (B) fluorine EDX map of the same region. | ||
The degree of infiltration can be estimated by considering EDX maps of the sections. Especially the fluorine signal gives an indication as to the degree of infiltration. We have reproduced the fluorine EDX map of the cross section in Fig. 4c. It shows the interface between PEM and CCL. The fluorine signal matches the light areas in the backscattered electron image. Furthermore, even in pores not fully infiltrated in the image a strong fluorine signal is detected. This indicates at least partial infiltration.
Interface study – electrochemical characterization
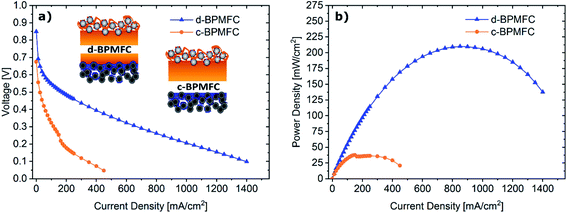
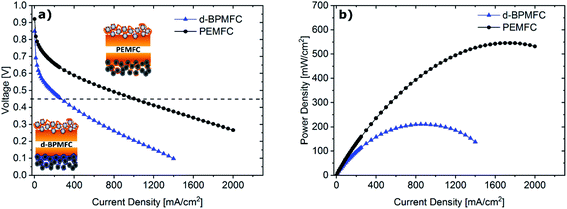
To investigate the impact of the bipolar reaction-interface, the two BPMFC configurations d-BPMFC and c-BPMFC were analysed with respect to their overall device performance in a fuel cell setup (Fig. 6). The individual configurations were varied in the AEM|PEM-interface only. The catalyst loading, ionomer content in the CLs and the thickness of the PEM were constant for both cases. One bipolar interface was created via the direct deposition of a concentrated Nafion-dispersion on the alkaline half-MEA (d-BPMFC – configuration). The second half of the PEM was manufactured by depositing a membrane with identical thickness on the acidic electrode. The second BPMFC was fabricated by depositing a Nafion-membrane, with twice the thickness as the membrane on the individual half-MEAs in the PEM|PEM case, on the low pH electrode only. In this configuration (c-BPMFC-configuration) the BPM-interface was generated by physical compression of the two half-MEAs in the fuel cell setup.The MEAs were then assembled as described in previous work.10–12 When comparing the polarization and power density data for both BPMFCs: the increased maximum power density of the d-BPMFC (209 mW cm−2), compared to the c-BPMFC (38 mW cm−2) was visible at first sight. Although it seemed natural to claim the superiority of the d-BPMFC-configuration, it was necessary to understand the impact of the interface in a more detailed manner. Therefore, we investigated the reasons for the differences between the two configurations. The over-potentials at lower current densities (up to 100 mA cm−2) seemed to be significantly higher for the c-BPMFC. In this low current density regime, the potential losses of conventional PEMFCs are usually dominated by the ORR-kinetics of the catalyst.16 However, when comparing the d-BPMFC configuration to the c-BPMFC configuration it is obvious that the kinetic regions, in spite of the same electrode configurations, were strongly different. Moreover, in PEMFCs the difference between the theoretical, thermodynamically potential and the OCV is usually an indicator for the magnitude of parasitic current arising from electrical shorts or fuel cross-over.17 When considering the lower OCV for the c-BPMFC configuration (Fig. 6) compared to the d-BPMFC-configuration, despite identical membrane properties, it is reasonable to assume an additional influence of the interface quality on the achievable OCV. Therefore, we propose the open-circuit-voltage (OCV) as a good indicator for the state of the BPM-interface, as the interfacial reaction, according to eqn (1)–(4), accounts for ∼66% of the achievable potential.
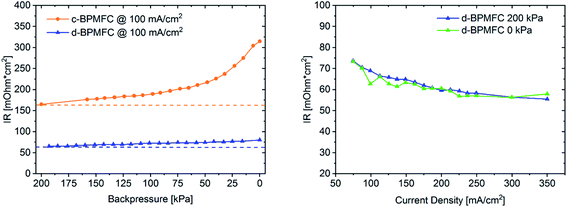
After identifying the major differences in the current–voltage characteristics it was necessary to probe for intrinsic characteristics of the MEAs, that would allow for a qualitative visualization of the respective bipolar reaction interface quality and the reasons behind the drastically different performances. One intrinsic parameter to look at is the ohmic cell resistance (RΩ). The total ohmic resistance of the fuel cell is the sum of contact resistances and ohmic resistances of all individual components and interfaces. Those include the ohmic resistance of the membrane, the catalyst layer, the gas diffusion media, the bipolar-plates and all resulting contact resistances at the respective interfaces.18 When excluding variations of the individual cell components, a possible difference of RΩ for the two BPMFC configurations, may be traced back directly to the interfacial contact quality and nature of the AEM|PEM interface. RΩ can be determined with a variety of electrical on-line test-methods, like AC resistance, current interrupt (iR), electrochemical impedance spectroscopy (EIS) and high frequency resistance (HFR).19 For the determination of RΩ during this study, the system integrated current interrupt method was used.19 As can be extracted form Fig. 7, RΩ was reduced by more than 50% when switching from the c-BPMFC to the d-BPMFC-configuration at 100 mA cm−2 and a gas backpressure of 200 kPagauge.
This enhancement should arise from a reduced contact resistance at the PEM|AEM interface, since the other ohmic resistance contributions remain identical for both configurations. During the conventional DMD process for PEMFCs, Nafion infiltrates into the electrodes to a certain degree, which was proposed as one of the main reasons for an enhanced PEM|CL interface contact and the increased power output.10–12 Since the AEM was also fabricated via DMD in this work, the AEM should be viewed as a very thin layer covering the catalyst agglomerates in the upper electrode region after infiltration and not as a planar membrane on top of the alkaline electrode. As visible from the SEM images, the electrode pore-space was still accessible from the alkaline electrode side after the AEM deposition. Therefore, as shown in Fig. 5 the PEM is partly incorporated into the upper pore space region of the alkaline half MEA. The infiltration with the Nafion dispersion consequently leads to a larger AEM|PEM interfacial area, compared to the physical compression of a nearly planar PEM-surface on a porous substrate. This infiltration consequently leads to a reduction of the PEM|AEM contact resistance. Interestingly, for the c-BPMFC-configuration a strong dependence of RΩ from the applied gas backpressure was observed. As shown in Fig. 7 the ohmic resistance of the c-BPMFC increased drastically for backpressure values below 75 kPagauge, whereas RΩ of the d-BPMFC varied little with the applied gas pressure at a constant current. Furthermore, the d-BPMFC's resistances at 200 kPagauge and 0 kPagauge showed good agreement over a broad current range. We attributed the reduction of RΩ with increasing backpressure in the c-BPMFC-configuration mainly to an improved physical lamination of the AEM|PEM interface and an enhancement of the reaction area, as the soft membrane may be pressed further into the porous electrode structure. Whereas in the d-BPMFC-configuration the BPM-interface may not be altered via additional physical compression, due to the unique possibility of PEM-electrode-infiltration during the DMD-process. When reversing the adjustment of applied backpressure from 200 kPagauge to 0 kPagauge, the increase of RΩ in the c-BPMFC-configuration implied a beginning delamination of the AEM|PEM-interface as a consequence of insufficient adhesion between both interfaces. The DMD-manufacturing approach for the d-BPMFC-configuration enhanced the performance in two ways. First direct deposition of the PEM decreased RΩvia the enhancement of the AEM|PEM interfacial area. Second the polymer infiltration also appears to promote the adhesion between the alkaline half MEA and the PEM. This adhesion was concluded from an unaltered RΩ at atmospheric gas pressure and its endurance over a broad range of current densities.
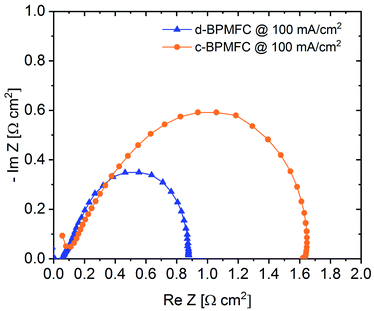
Electrochemical impedance spectroscopy (EIS) was used as another diagnostic tool for the evaluation of the processes within the BPMFCs (Fig. 8).
Usually the EIS-spectrum for a PEMFC creates a semi-circle loop, which is often referred to as the kinetic loop, as the diameter of the semi-circle is usually controlled by the kinetic processes of the ORR at low current densities.18 Calculating the difference between the two x-axis intercepts of the semi-circle is usually a facile method for determining the charge transfer resistance (RCT) of the ORR. This resistance depends mainly on inherent properties of the cathode such as the electrochemical surface area of the catalyst, the utilization of the catalytic active sites or the catalyst loading.18 As visible from the EIS spectra in Fig. 8, the diameter of the c-BPMFC-semi-circle was nearly double the diameter of the d-BPMFC-semi-circle. The difference resulted mainly from an increase in low-frequency resistance (RLFR) for the c-BPMFC-configuration, whereas the increase of the high-frequency resistance (HFR), which can be interpreted like RΩ, was comparatively small. Since both cells share the same cathode characteristics, a facile ORR-RCT interpretation of the EIS data may not be fully adequate for the BPMFCs used in this study. As already presumed from the polarization data in Fig. 6, the large polarization difference in the low current density regime could not be explained by different cathode characteristics. Now the EIS data provided a measurable value that may account for a majority of the fuel cell performance discrepancy. Although different interpretations are plausible, to explain the differences in the EIS data, it is most feasible to think of an additional resistance term in BPMFCs, which includes the H+/OH− charge recombination at the AEM|PEM-interface (RCR).
Grew et al. have discussed the transport of the charge recombination at the BPM-interface.20 They found that the charge recombination most likely occurs via a trap-assisted mechanism. They have underpinned their assumption, among others, with the high current densities achieved with BPMFCs over the last years, which would not be possible for a different type of recombination mechanism. Additionally, they bring up the fact that AC impedance spectra of BPMFCs display a classical charge-transfer behaviour with a RCT in the same order of magnitude as the predicted trap-assisted charge recombination resistance of H+ and OH− at the BPM interface. They suggest that the charge recombination at the BPMFC might even be a rate limiting step in the overall cell and that a development of an impedance model for BPMFCs is highly recommended.20 Ramani and co-workers concluded similarly to explain the large charge transfer resistance difference (measured at OCV conditions) from their bipolar MEA to their purely alkaline reference fuel cell.8
Due to the manufacturing related manipulation of the bipolar interface, our EIS data, collected at 100 mA cm−2, for the first time provided significant experimental confirmation for the assumptions of Grew et al. and Ramani et al. As the impedance spectra in Fig. 8 showed, a change in the nature of the AEM|PEM interface not only influenced the ohmic cell resistance (HFR), as it was observed for alterations of the CL|PEM interface in PEMFCs at similarly low current densities, but also increased the apparent charge transfer resistance.12 The impedance data suggest, that the AEM|PEM interface differs significantly from other interfaces in the MEA, as the total cell performance was strongly dependent on the quality of the bipolar interface. At this point it would be too speculative to discuss more detailed, manufacturing related dependencies of RCR, but as evaluated from the current-interrupt-measurements the AEM|PEM contact resistance and adhesion properties between the two components appeared to be crucial parameters of the AEM|PEM-interface quality. When designing BPMFCs with an alkaline electrode and an acidic membrane, an alteration of the electrode composition may also influence the interfacial contact behaviour between the PEM and the alkaline CL and consequently RCR. When evaluating such BPMFC electrode optimizations with EIS, the data should be interpreted with care, since the facile approaches for PEMFCs may not be transferrable to BPMFCs.
Comparison between BPMFC and PEMFC
Comparing the fuel cell performance of the d-BPMFC to a classical PEMFC (Fig. 9) with identical Fe–N/C cathode loading and PEM-thickness, it becomes obvious that the measured maximum power density of the BPMFC was still relatively lower than the power density achieved with the conventional PEMFC.Further analyzing the polarization characteristics of the two FC configurations, the more than twofold higher maximum power density of ∼550 mW cm−2, achieved with the PEMFC, seemed to originate from reduced overpotentials in the low current density regime and not from a lowered ohmic cell resistance. This assertion is underpinned by the current dependent measurements of RΩ for both cells (Fig. 10). The internal cell resistance was only marginally increased for the BPMFC compared to the PEMFC. A high increase would imply high interfacial contact resistance at the AEM|PEM interface as described previously on the one hand or inadequate OH− transport through the CCL towards the reaction interface on the other hand. The high overpotential observed for the BPMFC in the low current density regime may therefore either be attributed to the charge-transfer processes at the bipolar interface or to a non-optimized electrode design. At this point we cannot clearly assign the increased overpotential to one of the mentioned contributions alone. But it is reasonable to assume, that apart from the bipolar interface, there is a strong impact of the electrode ionomer content, the catalyst loading, the ionomer equivalent weight and the lack of additives on the overall cell performance. This was demonstrated in literature for AEMFCs as well as for BPMFCs and will therefore be an additional focus in our future work.7,21–23 Moreover, the used Fe–N/C in this study was designed and optimized for the application in PEMFCs and not exclusively for the use in a high pH environment.
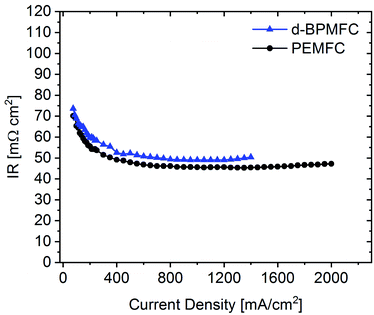 | ||
| Fig. 10 Current dependent measurement of the ohmic resistance for the d-BPMFC configuration (blue) and the conventional PEMFC (black). | ||
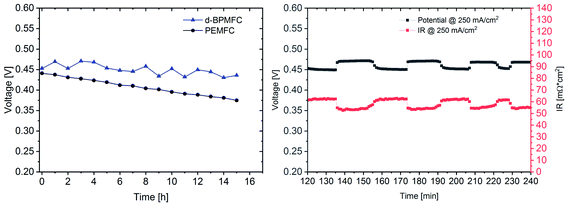
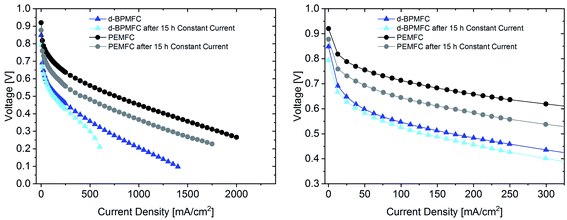
For further comparison between the two FC configurations a constant current experiment was performed. For both cells the current was adjusted to a correlating cell potential of ∼0.45 V (as visible in Fig. 9). This value was chosen to operate at potentials below the stable operation potential window of 0.9–0.7 V. Due to the high overpotential of the BPMFC the potential was adjusted to values lower than 0.5 V to operate in the ohmic regime of both fuel cells. After the current hold for 15 h (Fig. 11) additional polarization data was collected. As visible from Fig. 11 the voltage decay of the PEMFC and the BPMFC after 15 h is ∼66 mV and ∼17 mV respectively.
Although the overall potential loss for the BPMFC is smaller after 15 h, compared to the PEMFC, the potential of the BPMFC fluctuates more than 25 mV in shorter periods of time. Interestingly the strong potential fluctuations of the BPMFC visible during the 15 h test run create a repetitive pattern of alternating periods of nearly constant potential at smaller time scales. The potential alternates between 0.45 V and 0.475 V in time periods of 10–15 minutes. The origin of the potential fluctuations seems strongly connected with the RΩ of the BPMFC. The conventional PEMFC also showed fluctuations of the potential and the RΩ, but in a range of one order of magnitude smaller compared to the BPMFC. Since the location of the water formation reaction and the additional need for H2O as a reactant at the cathode in the BPMFC is significantly changed compared to the PEMFC, we believe that the alternating change of the internal cell resistance may be a consequence of an unbalanced water transport within the MEA. Further investigations will be necessary to understand this phenomenon in more detail.
The polarization data collected after the constant current experiment (Fig. 12) reveals different insights into the aging processes of the two cell configurations.
When looking at the lower current density regime for both FC configurations, the polarization characteristics until 0.6 V changed only marginally after 15 h current hold at 250 mA cm−2 for the BPMFC, whereas a greatly increased overpotential can be observed for the PEMFC. At a potential of 0.45 V the resulting current density has decreased by 40 mA cm−2 and 375 mA cm−2 for the BPMFC and the PEMFC respectively. But despite the reduced degradation of the BPMFC observed for potentials above 0.45 V, a characteristic mass transport restricted voltage loss could be observed for potentials below 0.3 V after the constant current hold. We assumed that the mass transport losses after the current hold either arose from an excessive flooding of the CL micropores, which is followed by a strongly increased oxygen transport resistance, or from changes of the ion and water transport properties towards and from the AEM|PEM interface, which could limit the water recombination rate and as a consequence reduce the limiting current density. We exclude delamination of the AEM|PEM interface, since no significant change of RΩ could be observed before and after the constant current hold. For future work it is strongly necessary to further investigate such degradation phenomena occurring in BPMFC configurations. In summary there are different possible reasons for the shown degradation, but currently we cannot be certain as to the cause of the degradation.
Conclusion and outlook
This work demonstrated a facile manufacturing approach for a MEA with a non-PGM cathode catalyst layer operating at high pH, a proton conducting membrane and a low-Pt loading anode catalyst layer operating at low pH. Polarization data and EIS analysis revealed the interface at the alkaline CCL and the PEM (AEM|PEM-interface) as a crucial element for designing MEAs operating in a bipolar configuration. According to the EIS analysis the AEM|PEM interface directly influences the measured apparent charge-transfer resistance, even at low current densities, which leads to the conclusion of the necessity of an altered equivalent-circuit model for the interpretation of BPMFCs compared to the interpretation of conventional PEMFCs. The ohmic cell resistance of the BPMFCs can be an adequate indicator for the quality of the respective AEM|PEM interface, as pressure dependent measurements could estimate the characteristics of the lamination and adhesion between the electrode and the PEM. In our opinion an increased surface area of the AEM|PEM-interface facilitates the lamination and adhesion of the two polymers on the one hand and decreases the overall resistance for the water-formation reaction on the other hand. A comparison between the best-performing BPMFC and a conventional PEMFC still pictured a superiority of the PEMFC regarding the measured maximum power density, but a constant current experiment with an identical starting potential of 0.45 V indicated a lower catalyst degradation rate. In summary we see two main advantages of a bipolar MEA architecture (alkaline CCL and acidic ACL) over the conventional PEMFC and AEMFC technology for the employment of PGM-free ORR catalysts. Firstly, existing technology can be used to provide a more stable cathode operating environment, compared to the conventional PEMFC. Additionally, and in contrast to AEMFC technology, it is still possible to profit from low-Pt loadings on the anode side. The still relatively low power densities might be drastically enhanced by the optimized selection and refined processing of already existing materials. Additional improvements may result from an enhanced focus on the manufacturing of the bipolar AEM|PEM interface for fuel cell applications. For future work, the role of the interfacial AEM-layer will be investigated in more detail, by the adjustment of the polymer properties and possible catalytic active additives to facilitate the water recombination at the respective AEM|PEM interface.Experimental
MEA-preparation
The ink for the Pt/C-anode-GDE fabrication comprised of a total 1 wt% solids in a solvent mixture of 20 wt% isopropylalcohol (IPA) in H2O. The solid fraction consisted of 70 wt% Pt/C (HiSPEC4000; 40 wt% Pt on carbon) and 30 wt% ionomer (Nafion D520; DuPont). The ink was homogenised at 0 °C with an ultrasonic horn (Hielscher) at 60 W for 20 min. The catalyst ink was applied onto a Freudenberg H23C8 gas diffusion media with an ultrasonic spraycoater (Biofluidix) on a heated stage at 85 °C. The ink flow-rate and the movement-speed of the spray-head was controlled to a deposition rate of approximately 6 μgPt cm−2 per deposition cycle, until a total Pt-loading of 0.1 mg cm−2 was reached. The Pt loading of the GDEs was measured by weighing (Sartorius Cubis®, 0.001 mg) the samples before and after the catalyst ink spray deposition. The PGM-free high pH cathode was fabricated from an ink comprised of a total 10 wt% solids in 1-propanol. The solid fraction was made up by 70 wt% Fe–N/C (Pajarito Powder) and 30 wt% ionomer (Aemion HNN8-00-X, Ionomer) with IEC > 2.4. The ionomer was dissolved in the solvent and then added to the catalyst powder. The resulting ink was mechanically stirred for one hour, placed in an ultra-sonication bath for one hour, stirred overnight and sonicated again for another hour on the next day. After that the ink was stirred until usage. The ink was applied onto a Freudenberg H23C8 gas diffusion media (4 × 4 cm) with an automated film applicator (ZAA 2300, Zehnter). The wet film thickness was determined by adjusting the gap-height on the doctor blade. The gap-height was set to 350 μm, which resulted in an average loading of ∼1 mg cm−2. After that the samples were dried at 40 °C for 1 h and at 40 °C under reduced pressure for an additional hour. The Fe–N/C loading of the GDEs was measured by weighing (Sartorius Cubis®, 0.001 mg) the samples before and after the catalyst ink deposition and solvent evaporation. For the fabrication of the AEM layer on the high-pH GDE, a 10 wt% solution of ionomer (Aemion HNN8-00-X, Ionomer) in DMSO (for gas chromatography, Sigma Aldrich), was applied to the previously prepared GDEs with the automated film applicator and a doctor blade gap height of 100 μm. The samples were dried at 40 °C for four hours and at 40 °C under reduced pressure for two hours. After that the samples were placed in 1 M KOH for 48 h for a complete ion exchange. The samples were rinsed with H2O multiple times, until a neutral pH was measured in the washing solution. The samples were dried at room temperature. For the direct deposition of the proton exchange membrane in the PEM|PEM BPMFC configuration, a 20 wt% Nafion dispersion (D2021, DuPont) was applied to the high-pH cathode and the low-pH anode with the automated film applicator. The gap-height at the doctor blade was adjusted to 150 μm, which resulted in a PEM thickness of ∼7.5 μm on each electrode. For the AEM|PEM BPMFC configuration the 20 wt% Nafion dispersion was applied to the low-pH anode only. The doctor blade gap height was set to 300 μm, resulting in a PEM thickness of ∼15 μm. All samples were dried at room temperature for at least two hours. For the PEMFC-reference the low-pH cathode was fabricated from an ink comprised of a total 10 wt% solids in a H2O/2-propanol (2![[thin space (1/6-em)]](https://www.rsc.org/images/entities/char_2009.gif) :
:![[thin space (1/6-em)]](https://www.rsc.org/images/entities/char_2009.gif) 1 v/v) mixture. The solid fraction was made up by 55 wt% Fe–N/C (Pajarito Powder) and 45 wt% ionomer (Nafion D2021, DuPont). The ink was further processed in the identical manner as described prior. The ink was applied to the gas diffusion media with a doctor blade gap height of 300 μm. After that the electrodes were dried at 40 °C for 1 h and at 40 °C under reduced pressure for an additional hour. It was necessary to perform the coating and solvent evaporation two times to achieve a total Fe–N/C loading of 1 mg cm−2.
1 v/v) mixture. The solid fraction was made up by 55 wt% Fe–N/C (Pajarito Powder) and 45 wt% ionomer (Nafion D2021, DuPont). The ink was further processed in the identical manner as described prior. The ink was applied to the gas diffusion media with a doctor blade gap height of 300 μm. After that the electrodes were dried at 40 °C for 1 h and at 40 °C under reduced pressure for an additional hour. It was necessary to perform the coating and solvent evaporation two times to achieve a total Fe–N/C loading of 1 mg cm−2.
Fuel cell testing
The fuel cells were assembled using 150 μm glass-fibre enforced PTFE gaskets for the anode and 230 μm for cathode side and a 50 μm PTFE foil as a sub-gasket between the GDEs. The sub-gasket had an opening of 2 × 2 cm, which reduced the active area of the fuel cell to 4 cm2.15 No additional hot-pressing steps were performed. The cell was mounted with a torque of 5 N m. The fuel cells were operated at 80 °C with 200 kPa symmetrical backpressure on a Scribner 850e (Scribner Associates) under power-optimized conditions with H2 (0.25 L min−1) and pure O2 (0.5 L min−1) and a relative humidity (RH) of 100%. The polarization data was measured galvanostatically with a step-size of 0.05 A per point and 1 min per point up to 1 A and at higher currents with a step-size of 0.2 A per point and 1 min per point. The polarization data collection was repeated, until no significant changes could be observed to the prior polarization data. The integrated on-line current-interrupt measurement was used to evaluate the ohmic cell resistance (RΩ) at every recorded polarization data point.19EIS-measurement
The EIS data were collected galvanostatically with the Scribner 885-HS Fuel Cell Potentiostat (Scribner Associates). Before the EIS measurement a constant current hold was performed at the desired current density for 15 min. The frequency sweep was performed from 10 kHz to 0.1 Hz (10 steps per decade), with an AC RMS amplitude of 5% of the DC current.Preparation of SEM samples
The MEA and GDE cross sections were obtained by sanding and polishing an embedded and infiltrated sample. For this purpose, we embedded the MEAs and respectively GDEs in an Epoxy Resin (Buehler Inc, EpoThin). Infiltration was facilitated by placing the mould with liquid epoxy in a desiccator and applying a vacuum. Following overnight curing of the resin, we ground the sample using SiC sanding paper (Struers GmbH) up to 4000 grain. The sanding was followed by a two-step polishing procedure. For the first step a 3 μm polishing agent (ATM GmbH) was used with a MDdac polishing plate (Struers GmbH). This was followed by polishing using a 250 nm Diamond solution (ATM GmbH) with MDmol plate (Struers GmbH). In a final step the samples were coated with a conductive layer of carbon using a thread evaporation coater (Balzers Union, MED 010).The samples for surface images where prepared on aluminum sample stubs. First, a small piece of each sample (ca. 5 × 8 mm) where cut out from the GDEs using a razor blade. Second, the pieces where attached to aluminum sample stubs using carbon adhesive tabs (Plano GmbH).
SEM imaging
All SEM images where recorded using a Gemini II electron column of a Zeiss Crossbeam 540 microscope. The imaging parameters are given in the table below. The cross-section images where recorded using the microscopes four-quadrant backscatter detector in compositional mode (5 kV accelerating voltage, 2 nA beam current). The surface images were recorded using the secondary electron detector (3 kV accelerating voltage, 2 nA beam current). EDX maps were recorded using a silicon drift detector (X-Max 150, Oxford Instruments), using an accelerating voltage of 5 kV and a beam current of 2 nA. The data was processed using Aztec (Oxford Instruments).XPS measurements
Measurements were carried out using a Quantera II (Physical Electronics Inc.). Cutouts where made from GDEs at 2 stages of the manufacturing process: following the deposition of the catalyst layer and following the deposition of the AEM interlayer. The samples were not treated in KOH and thus the ion exchange has not taken place yet. The samples were mounted on the XPS sample stage using double sided tape. The XPS spectra were analysed using CasaXPS (Casa Software Ltd.).Conflicts of interest
There are no conflicts to declare.Acknowledgements
We gratefully thank the Vector-Stiftung (Project-Nr. P2017-0075) for the financial support, that made this work possible. The authors are thankful to T. Böhm for his support and discussions.References
- C. H. Choi, C. Baldizzone, J.-P. Grote, A. K. Schuppert, F. Jaouen and K. J. J. Mayrhofer, Angew. Chem., Int. Ed., 2015, 54, 12753–12757 CrossRef CAS PubMed.
- D. R. Dekel, J. Power Sources, 2018, 375, 158–169 CrossRef CAS.
- N. Ramaswamy, S. Ghoshal, M. K. Bates, Q. Jia, J. Li and S. Mukerjee, Nano Energy, 2017, 41, 765–771 CrossRef CAS.
- J. R. Varcoe and R. C. T. Slade, Fuel Cells, 2005, 5, 187–200 CrossRef CAS.
- M. Ünlü, J. Zhou and P. A. Kohl, J. Phys. Chem. C, 2009, 113, 11416–11423 CrossRef.
- M. Unlü, J. Zhou and P. A. Kohl, Angew. Chem., Int. Ed., 2010, 49, 1299–1301 CrossRef PubMed.
- X. Xu, S. Peng, S. Lu, J. Gong, J. Zhang, W. Huang and Y. Xiang, J. Power Sources, 2017, 354, 92–99 CrossRef CAS.
- C. G. Arges, V. Prabhakaran, L. Wang and V. Ramani, Int. J. Hydrogen Energy, 2014, 39, 14312–14321 CrossRef CAS.
- M. Breitwieser, M. Klingele, S. Vierrath, R. Zengerle and S. Thiele, Adv. Energy Mater., 2018, 8, 1701257 CrossRef.
- M. Breitwieser, M. Klingele, B. Britton, S. Holdcroft, R. Zengerle and S. Thiele, Electrochem. Commun., 2015, 60, 168–171 CrossRef CAS.
- M. Klingele, B. Britton, M. Breitwieser, S. Vierrath, R. Zengerle, S. Holdcroft and S. Thiele, Electrochem. Commun., 2016, 70, 65–68 CrossRef CAS.
- S. Vierrath, M. Breitwieser, M. Klingele, B. Britton, S. Holdcroft, R. Zengerle and S. Thiele, J. Power Sources, 2016, 326, 170–175 CrossRef CAS.
- M. Breitwieser, C. Klose, M. Klingele, A. Hartmann, J. Erben, H. Cho, J. Kerres, R. Zengerle and S. Thiele, J. Power Sources, 2017, 337, 137–144 CrossRef CAS.
- M. Breitwieser, T. Bayer, A. Büchler, R. Zengerle, S. M. Lyth and S. Thiele, J. Power Sources, 2017, 351, 145–150 CrossRef CAS.
- M. Klingele, M. Breitwieser, R. Zengerle and S. Thiele, J. Mater. Chem. A, 2015, 3, 11239–11245 RSC.
- J. Zhang, PEM Fuel Cell Electrocatalysts and Catalyst Layers. Fundamentals and Applications, Springer-Verlag, London, 2008 Search PubMed.
- R. P. O'Hayre, F. B. Prinz, S.-W. Cha and W. G. Colella, Fuel cell fundamentals, Wiley, Hoboken, 2016 Search PubMed.
- X. Yuan, H. Wang, J. Colinsun and J. Zhang, Int. J. Hydrogen Energy, 2007, 32, 4365–4380 CrossRef CAS.
- K. R. Cooper and M. Smith, J. Power Sources, 2006, 160, 1088–1095 CrossRef CAS.
- K. N. Grew, J. P. McClure, D. Chu, P. A. Kohl and J. M. Ahlfield, J. Electrochem. Soc., 2016, 163, F1572–F1587 CrossRef CAS.
- M. Ünlü, J. Zhou, I. Anestis-Richard, H. Kim and P. A. Kohl, Electrochim. Acta, 2011, 56, 4439–4444 CrossRef.
- M. M. Hossen, K. Artyushkova, P. Atanassov and A. Serov, J. Power Sources, 2018, 375, 214–221 CrossRef CAS.
- M. Mandal, G. Huang, N. U. Hassan, X. Peng, T. Gu, A. H. Brooks-Starks, B. Bahar, W. E. Mustain and P. A. Kohl, J. Electrochem. Soc., 2020, 167, 54501 CrossRef CAS.
| This journal is © The Royal Society of Chemistry 2020 |

