 Open Access Article
Creative Commons Attribution 3.0 Unported Licence
Mitigating voltage losses in photoelectrochemical cell scale-up†
Fatwa F.
Abdi
 *a,
Ronald Ramiro
Gutierrez Perez
b and
Sophia
Haussener
 b
b
aInstitute for Solar Fuels, Helmholtz-Zentrum Berlin für Materialien und Energie GmbH, Hahn-Meitner-Platz 1, Berlin 14109, Germany. E-mail: fatwa.abdi@helmholtz-berlin.de
bLaboratory of Renewable Energy Science and Engineering, Institute of Mechanical Engineering, École Polytechnique Fédérale de Lausanne, 1015 Lausanne, Switzerland
First published on 3rd April 2020
Abstract
In solar water splitting, efforts in scaling up the photoelectrochemical cell beyond laboratory scale have started to attract significant attention. Several large-area devices have been demonstrated, but typically the efficiencies are much lower than their small-area equivalent. Here, two-dimensional finite element modeling is used to evaluate the different sources of voltage loss specifically related to scale-up in solar water splitting devices operated in neutral pH solutions. We quantitatively investigate the influence of the electrode area to these scale-up associated losses (substrate ohmic loss, electrolyte ohmic loss, and local pH-gradient related losses). About 600 mV additional overpotential is needed due to these losses for a cell with electrodes of height of 8 cm at a current density of 10 mA cm−2. We show, however, that by applying engineering and cell design strategies, the voltage losses can be mitigated, resulting in an acceptable ∼50 mV overpotential. Overall, this study highlights the additional challenges to be considered in photoelectrochemical cell scale-up and provides strategies to manage and mitigate scaling-related losses.
Introduction
The progress in photoelectrode materials development for solar water splitting in the past 10–15 years has resulted in numerous demonstrations of unassisted solar water splitting devices. Various architectures have been utilized and solar-to-hydrogen (STH) efficiencies as high as 30% have been reported.1–4 Unfortunately, the high efficiencies (>15%) have only been demonstrated using expensive and scarce III–V semiconductors,5–8 which are challenging to be scaled up to the GW or TW level, unless concentrated irradiation is considered.9 On the other hand, relatively low-cost oxide-based devices have only achieved STH efficiency of ∼8%.10–12 These oxide-based devices typically use BiVO4 as the top-absorber in a tandem configuration, and the theoretical maximum for such a device is only ∼9%, limited by the 2.4 eV bandgap absorption of BiVO4. Significant research efforts are therefore directed towards developing novel complex oxides with smaller bandgaps (1.7–1.9 eV) to replace BiVO4.13–18In addition, given the impressive development of solar water splitting devices, the next step is to shift beyond the laboratory experiments and demonstrate large-scale devices. Scaling can be quantified by the power of a device and can be increased by concentrating the solar irradiation or by increasing the photoabsorber area. The latter is more commonly done. Large-area demonstrations have started to emerge in the past few years, but the number is still very limited. Most reported devices have an area of smaller than 1 cm2, and only a handful demonstrated areas larger than 10 cm2.2,19–23 Moreover, these large-area devices tend to deliver much lower STH efficiency (by up to a factor of ∼5) as compared to their small-area equivalent.2 For example, it was recently reported that while small-area (0.24 cm2) BiVO4-based tandem device delivers STH efficiency of ∼6%, the large-area (50 cm2) equivalent is only capable of delivering an STH efficiency of ∼2%.21 The significant loss of efficiency has been attributed not to the scale-up of the light absorber material (i.e., BiVO4) itself, but more to the ohmic losses and mass-transport (proton/hydroxyl ions) limitations. Several modeling studies have also investigated some of these aspects (substrate losses, ionic drop, mass transfer),24–28 but the overall quantification of the various loss mechanisms related to scale-up has not been reported. This is important in order to propose and implement appropriate (photo)electrochemical engineering and design strategies in order to overcome the scale-up related losses.
Here, we use two-dimensional (2-D) finite element modeling to quantify the different scale-up related loss mechanisms in a solar-water splitting device: substrate ohmic loss, electrolyte ohmic loss, and local pH-gradient related losses. We consider a membrane-less water splitting device, where the product (i.e., O2 and H2) separation is done using hydrodynamic control,29,30 operated with buffered electrolyte at neutral pH. Although the use of neutral pH increases the potential drop in the cell (i.e., due to the evolving pH-gradient and the associated overpotentials), a device operating at neutral pH allows the use of abundant seawater and is safer to operate over large collection areas. Also, many earth-abundant light absorbers and catalysts are unstable in acidic or alkaline electrolytes.31–33 The influence of electrode area to the scale-up associated losses is investigated. Finally, we offer engineering and design strategies in order to manage and mitigate the overall voltage losses.
Model description and boundary conditions
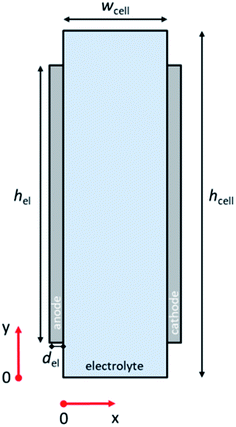
Fig. 1 illustrates the 2-D schematic of the cell geometry used in this study, i.e., a membrane-less planar two-electrode configuration. In such a configuration, hydrodynamic flow alone is sufficient to separate the products and ensure safe operation without the use of conventional membranes.29,30 Since it has been shown that the voltage losses associated with scale-up are not due to additional potential drop within the light absorbers,21 only dark electrochemical reactions are taken into consideration here. For our analysis to be valid, the resistance of the semiconductor layer itself should therefore be negligible and the deposition at large area should still result in homogenous films. The baseline parameters used in our simulations are tabulated in Table S1 (ESI†). COMSOL Multiphysics® was used to solve the governing conservation and transport equations (see ESI Note 1† for details).The computational domain consisted of the liquid electrolyte channel of different widths (wcell) and heights (hcell) between the two solid electrodes of a given thickness (del) and of different heights (hel). Assuming the density (ρ) and dynamic viscosity (μ) of the electrolyte to be equal to those of water, and considering all the combinations of cell widths (wcell) and inlet velocities (vy = vin) used in this study, the maximum Reynolds number (Re) is 1200, so that laminar flow can be assumed. Re values for the various wcell and vin investigated in this study are shown in Fig. S1;† all remain below the laminar-to-turbulence transition value (i.e., 2000). The solution of the mass conservation and Navier–Stokes equation provided a parabolic velocity profile. The boundary conditions consisted of an inlet velocity vin normal to the inlet with developed flow (i.e. an entrance length of 1 cm was used). The pressure of the top boundary of the electrolyte is fixed (pout). At the walls of the cell, no-slip boundary conditions (vx = vy = 0) were used.
The transport of ionic species was calculated in a diluted solution by solving the Nernst–Planck equation for the following species: H+, K+, HPO42−, and H2PO4−. The concentration of dissolved gases was calculated by solving the diffusion–advection equation for O2 and H2 in water. Diffusion coefficients of the various species are indicated in Table S1.† Concentration-dependent Butler–Volmer equations were solved at the electrode–electrolyte interface, using potential–current characteristics on the surface of the anode and cathode. Kinetic values representative of state-of-the-art catalysts (Pt for HER and RuO2 for OER)27,34–37 were used (see Table S1†). Constant concentration for the ionic species (ci = c0,i) and zero concentration for H2 and O2 were set at the inlet, and no diffusive outflow (nDi∇ci = 0) at the outlet. 2 M potassium phosphate (KPi) buffer was considered for this study, and the following equilibrium reaction with the respective equilibrium constant is considered:
| HPO42− + H+ ⇌ H2PO4−, Keq = 1.5 × 10⁻⁴ mol m−3 | (1) |
Charge conservation and transport was solved in the electrolyte. Average current density was applied at the anode's electrical contact. The potential of the cathode's electrical contact was set to ground (see Fig. S2†). The edges at which no flux (−nJi = 0) and insulation (−nis = 0) boundary conditions were used are also specified in Fig. S2.† The electrode's conductivity (σel) of 105 S m−1 was used as a typical value for a transparent conducting oxide (TCO) substrate. Although the typical thickness of TCO is in the order of 500 nm, we used a 1 mm pseudo-domain to represent the film thickness to avoid meshing complexity at the interface. Anisotropic conductivity (σs), eqn (2)–(4), and scaling factors were applied in order to ensure that the difference between the real thickness (del,0) and the pseudo-domain thickness (del) does not affect the simulation.
 | (2) |
 | (3) |
 | (4) |
The total cell voltage (Vcell) is the sum of the equilibrium potential (Eeq), the kinetic overpotentials for the oxygen and hydrogen evolution reactions (ηOER and ηHER), the ohmic loss in the substrate (Vohmic,substrate), the ohmic loss in the electrolyte (Vohmic,electrolyte), and the Nernstian loss due to pH gradients at the surface of the electrodes (VpH grad).
| Vcell = Eeq + ηOER − ηHER + Vohmic,substrate + Vohmic,electrolyte + VpH grad | (5) |
E eq, ηOER, and ηHER are not affected by scaling up of the electrodes; the values are therefore not reported here. The following equations describe the three voltage losses considered in this study.
| Vohmic,substrate = Vohmic,substrate-anode + Vohmic,substrate-cathode | (6) |
| Vohmic,electrolyte = Velectrolyte,anode − Velectrolyte,cathode | (7) |
 | (8) |
![[thin space (1/6-em)]](https://www.rsc.org/images/entities/char_2009.gif) 485 C mol−1). The schematic illustration of these losses in the cell is shown in Fig. S3.†
485 C mol−1). The schematic illustration of these losses in the cell is shown in Fig. S3.†
100% faradaic conversion efficiency to H2 and O2 was assumed at the surface of the cathode and anode, respectively. The local current at the electrode surface (iloc) was coupled with the generation rate (Ri, see also eqn (S1)†) of H2 and O2.
 | (9) |
All the geometry was meshed with free triangular elements. The maximum mesh element size and the relative tolerance for the simulation were studied in order to minimize the relative error of electrode potential and local current density. The results are shown in Fig. S4† in which the chosen mesh (quantified through the maximal mesh element size) and relative tolerance for our simulations are identified. The optimized mesh configuration used in our study is shown in Fig. S5.† Steady-state solutions were obtained using the multifrontal massively parallel sparse (MUMPS) direct solver of COMSOL Multiphysics®. A minimum inlet velocity, vin, of 0.27 cm s−1 was needed in order to obtain convergence of the steady-state solution, as the input flux of the electrolyte is not sufficient to reach an equilibrium. When vin is lower than this value, voltage losses can only be evaluated for a period of time, but steady-state solution cannot be obtained (see Fig. S6†).
Results and discussions
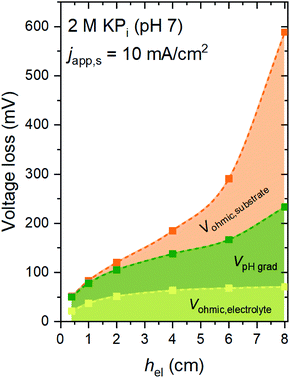
Fig. 2 shows the voltage losses associated with scaling up the electrode height from 0.3 to 8 cm in 2 M KPi buffer electrolyte (pH 7). The average current density at the surface of the electrodes (japp,s) was set to 10 mA cm−2, and the inlet electrolyte velocity (vin) was 0.27 cm s−1. Three different sources of voltage loss are identified: Vohmic,substrate, VpH grad, and Vohmic,electrolyte (see eqn (6)–(8)). Vohmic,electrolyte is found to be the least affected by the electrode size; it remains less than 100 mV even for the largest electrode height of 8 cm. The pH gradient and the associated VpH grad increase with increasing electrode height, which results from the inability to replenish protons at the region close to the surface of the electrodes. The largest voltage loss is Vohmic,substrate, due to the limited conductivity of the substrate (σel = 105 S m−1). For the 8 cm electrode, the Vohmic,substrate value is as high as 350 mV. Overall, the total voltage loss is shown to be significantly increased with increasing electrode height, from ∼50 mV for the 0.3 cm electrode to ∼600 mV for the 8 cm electrode. Such a substantial voltage loss is unacceptable for the operation of the overall water splitting device; this value needs to be minimized, ideally to a more acceptable level of 50–100 mV.Voltage losses in the substrates
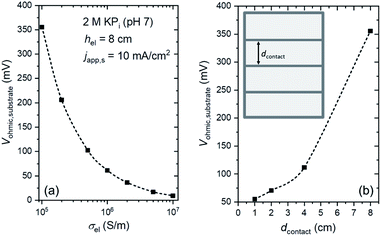
We first consider minimizing and mitigating the Vohmic,substrate. An obvious way is to replace the substrate with a more conductive material. Fig. 3a shows the influence of substrate conductivity on Vohmic,substrate. At japp,s = 10 mA cm−2, replacing the substrate from FTO (σel ∼ 105 S m−1) to ITO (σel ∼ 106 S m−1 (ref. 39–41)) significantly decreases Vohmic,substrate by a factor of ∼7. Vohmic,substrate can be further decreased to ∼10 mV when Ag is used as the substrate (σel ∼ 107 S m−1 (ref. 42 and 43)). However, these high conductivity substrates may pose additional challenges. For example, in addition to being more expensive, ITO is less resistant to high temperature as compared to FTO; deposition of many thin-film semiconductors, especially metal oxides, typically require temperatures higher than 500 °C. Ag, on the other hand, is opaque. For an overall solar water splitting device that employs stacked tandem configurations, a transparent substrate is needed in order to allow the transmitted light from the first photoabsorber to reach the last photoabsorber. Spectrum splitting or a back reflector can be utilized for non-transparent tandem devices,12,44,45 but the configuration is complicated and might be impractical. Alternatively, highly conductive metallic lines can be deposited on FTO substrates to improve the effective conductivity (see inset of Fig. 3b). Although these metallic lines would partially block the light, a much more significant reduction in ohmic losses (i.e., minimize Vohmic,substrate) could be obtained. Fig. 3b shows the influence of the spacing between the metallic lines (dcontact) on Vohmic,substrate. When dcontact is 2 cm or less, Vohmic,substrate can be decreased to <75 mV; this is a 5-fold reduction of voltage loss while only blocking ∼4% of the transmitted light (contact width, wcontact, of 1 mm). Indeed, this method has been employed in photovoltaic cells, where metallic busbars are deposited on the front contact of the cells.46,47 Photocurrent improvements on 50 cm2 BiVO4 photoelectrodes have also been demonstrated by depositing conducting nickel lines on top of the FTO substrates.21Decreasing dcontact to less than 1 cm will further reduce Vohmic,substrate. However, at the same time, a larger portion of the transmitted light will be blocked (see Fig. S7†). This can be overcome by decreasing wcontact to e.g., 0.5 mm, but it should be noted that the resistance of the metallic lines increases with decreasing wcontact, and voltage losses along the metallic lines can no longer be neglected. Overall, these two parameters (i.e., dcontact and wcontact) need to be specifically optimized depending on the type of metal and the current density, in light of the competing factors of blocked transmission and resistive losses in the metallic lines.
pH gradient losses
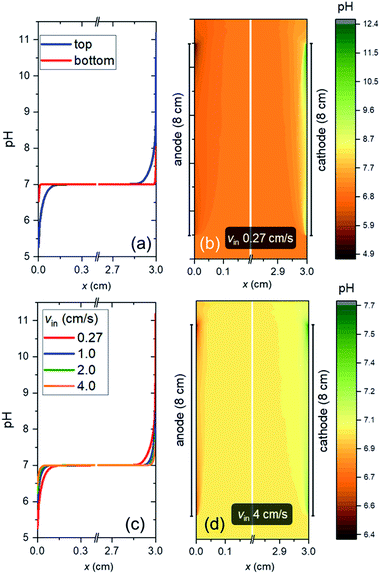
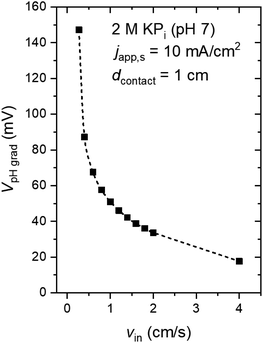
Fig. 4a shows the pH profile across the electrolyte, from the anode to the cathode (along the x-direction). Two pH profiles, at the bottom and the top of the electrode, are shown. At the anode side, water oxidation takes place and the accumulation of proton results in a local decrease of pH, while depletion of proton close to the cathode side, where water reduction occurs, causes a local pH increase. The pH variation is found to be limited to the vicinity of the surface (<2 mm away), and it is larger at the top of the electrode as compared to the bottom of the electrodes. This is a result of a constant supply of fresh electrolyte from the inlet, closer to the bottom of the electrodes. A color map of the pH of the electrolyte is shown in Fig. 4b. A maximum pH difference of ∼4.3 is observed, which corresponds to a voltage loss of ∼250 mV. This pH gradient can be minimized by increasing the inlet velocity (Fig. 4c). That is, increasing the mixing helps in reducing the pH gradient. Turbulence could further enhance this mixing effect and reduce the pH gradient, but at the same time increases the risks of products (O2 and H2) mixing. With increasing inlet velocity, the replenishment and transport of protons close to the anode and cathode surface, respectively, are promoted. This is in agreement with the “restricted” electrolyte volume effect recently demonstrated in an experimental study by Ahmet et al.21 At an inlet velocity of 4 cm s−1, the maximum pH difference is limited to ∼0.6 (Fig. 4d), which corresponds to a voltage loss of only ∼40 mV.The dependence of VpH grad on the inlet velocity is summarized in Fig. 5 for an electrode of 8 cm height with a substrate that has conducting metal lines spaced at 1 cm distance (i.e., dcontact = 1 cm). Note that, for simplicity, japp,s is kept at 10 mA cm−2. Increasing the inlet velocity dramatically decreases the pH gradient close to the electrodes' surface and the corresponding VpH grad. VpH grad can be minimized to ∼20 mV by having an inlet velocity of 4 cm s−1. The difference between this value to the one shown in Fig. 4c and d (∼40 mV) suggests that there is a synergy between the application of conducting metal lines and increasing the inlet velocity. With the application of conducting metal lines, the local current density distribution at the surface of the electrodes becomes more uniform (Fig. S8a†). Similarly, with higher inlet velocity, a more uniform local current distribution is obtained (Fig. S8b†). As a result, Vohmic,substrate is further minimized to ∼15 mV for dcontact = 1 cm and vin = 4 cm s−1 (Fig. S8c†).
Electrolyte ohmic losses
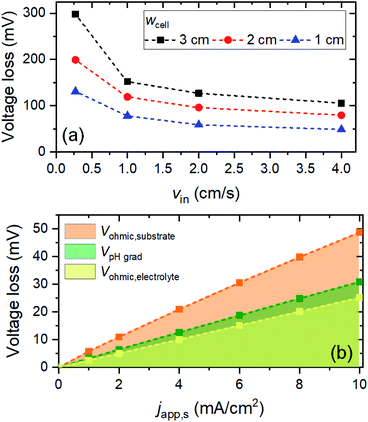
With VpH grad and Vohmic,substrate minimized to a sum of ∼35 mV, the electrolyte ohmic loss (Vohmic,electrolyte) becomes the dominant contributor to the total voltage loss. Vohmic,electrolyte can be reduced by increasing the ionic conductivity of the electrolyte, i.e., by increasing the molarity of the phosphate buffer. However, the molarity used in this simulation (i.e., 2 M) is already very close to the solubility limit; it has been reported that concentrations of KPi higher than 2 M results in rapid precipitation of phosphate crystals on the walls of the cell.21 Alternatively, one can reduce the distance between the anode and the cathode (i.e., wcell). However, since a membrane-less configuration is used here, it has to be ensured that decreasing wcell still results in no (or minimal) product cross-over. We calculated the percentages O2 and H2 cross-over (i.e., O2 collected at the cathode outlet and H2 collected at the anode outlet) with various wcell and for various vin, as shown in Fig. S9.† The amount of product cross-over increases with decreasing wcell, but it is still less than 1% even for wcell of 1 cm. A 1%-product concentration contour is also shown in Fig. S9b,† for the case of wcell = 1 cm, indicating that more than 99% of H2 and O2 can be collected at the designated outlets.We then combined the simple engineering and design parameter strategies (i.e., application of metallic lines, increasing inlet velocity and decreasing cell width) and examined the total voltage loss (Fig. 6a). At a current density of 10 mA cm−2, the total voltage loss can be minimized to ∼50 mV for wcell = 1 cm, vin = 4 cm s−1 and dcontact = 1 cm. This amount of voltage loss is much more acceptable than the initial ∼600 mV voltage loss (vide supra). Fig. 6b shows the contribution of each type of voltage loss for various current densities. Note that VpH grad is even further decreased (vs. the values in Fig. 5) because the smaller wcell increases the electrolyte velocity closer to the surface of the electrodes. This increases the replenishment/transport rate of protons close to the surface of the electrodes and reduces the pH gradient further. As a result, both pH gradient and substrate conductivity are no longer the main limitations; instead, the electrolyte ohmic loss (Vohmic,electrolyte) constitutes half of the total voltage loss. Other strategies to decrease the ionic resistance, e.g., introducing a conductive supporting electrolyte or using a highly conductive MEA configuration, need to be explored in order to minimize the voltage loss further.
Finally, we re-emphasize that our study does not take turbulence or multi-phase flow into consideration. While laminar flow is a valid assumption based on the Reynolds numbers for all examined conditions (vide supra), multi-phase flow induced mixing may enhance the mass transport, which will affect the pH gradient loss and product mixing. A particular example is bubble-induced convection; a recent study shows that an average bubble rise velocity of ∼5 mm s−1 is obtained for a current density of 10 mA cm−2.48 To estimate the influence on the voltage loss, we adapted our model by including a volume force in the y-direction at the electrolyte regions close to the electrodes (0.2 mm, based on the reported average bubble diameter48), so that the electrolyte velocity in these regions is in the range of 4–6 mm s−1 (see Fig. S10†). Indeed, the main effect lies in the reduction of VpH grad, while only minor variations are observed for Vohmic,electrolyte and Vohmic,substrate. Multi-phase transport modeling considering bubble formation (which is dependent on surface roughness), aggregation and transport is needed to provide further details on its effect on the mass transport and mixing.
Conclusions
Using a two-dimensional Multiphysics model, we have identified various loss mechanisms related to scale-up in solar water splitting devices operating in neutral pH solutions. For an operating current density of 10 mA cm−2, the total voltage loss increases from ∼50 mV for a cell with an electrode height of 0.3 cm to ∼600 mV for a cell with 8 cm electrode height. This includes substrate ohmic loss (∼350 mV), pH gradient loss (∼150 mV), and electrolyte ohmic loss (∼100 mV). However, the application of relatively simple engineering strategies, such as the deposition of metallic lines on the substrate and adjusting the operation/design parameters (e.g., electrolyte flow rate, cell width), was found to be effective in overcoming these voltage losses. Combining all the presented strategies, a total voltage loss of only ∼50 mV can be obtained, which is an acceptable level for the device operation. About half of this voltage loss is now due to the ohmic losses in the electrolyte. Other engineering strategies, such as the application of cell design (e.g., using flow fields)49–51 to optimize flow pattern or the use of electrolyte with higher conductivity (e.g., operation at higher temperature to increase buffer solubility),52–54 may be explored in order to further minimize the voltage loss. Finally, we note that our simulation results, which show non-linearity dependence between the electrode area and the total scale-up associated losses, qualitatively agree with experimental results reported in the literature.21,23,55 Further experiments using – for example – in situ pH monitoring56,57 and particle image velocimetry58 are needed to quantitatively validate our findings.Conflicts of interest
There are no conflicts to declare.Acknowledgements
We thank Dr Yannick K. Gaudy, Dr Saurabh Tembhurne and Prof. Roel van de Krol for valuable discussions. This work was partially carried out with the support of the Helmholtz Energy Materials Foundry (HEMF), a large-scale distributed research infrastructure founded by the German Helmholtz Association, and the Swiss National Science Foundation through the Starting Grant SCOUTS (#155876).References
- J. W. Ager, M. R. Shaner, K. A. Walczak, I. D. Sharp and S. Ardo, Energy Environ. Sci., 2015, 8, 2811–2824 RSC.
- J. H. Kim, D. Hansora, P. Sharma, J.-W. Jang and J. S. Lee, Chem. Soc. Rev., 2019, 48, 1908–1971 RSC.
- S. Tembhurne, F. Nandjou and S. Haussener, Nat. Energy, 2019, 4, 399–407 CrossRef CAS.
- Solar PhotoElectroChemical Device Optimization, https://specdo.epfl.ch/.
- J. Jia, L. C. Seitz, J. D. Benck, Y. Huo, Y. Chen, J. W. D. Ng, T. Bilir, J. S. Harris and T. F. Jaramillo, Nat. Commun., 2016, 7, 13237 CrossRef CAS PubMed.
- W.-H. Cheng, M. H. Richter, M. M. May, J. Ohlmann, D. Lackner, F. Dimroth, T. Hannappel, H. A. Atwater and H.-J. Lewerenz, ACS Energy Lett., 2018, 3, 1795–1800 CrossRef CAS.
- W. J. Chang, K.-H. Lee, H. Ha, K. Jin, G. Kim, S.-T. Hwang, H.-M. Lee, S.-W. Ahn, W. Yoon, H. Seo, J. S. Hong, Y. K. Go, J.-I. Ha and K. T. Nam, ACS Omega, 2017, 2, 1009–1018 CrossRef CAS PubMed.
- S. A. Bonke, M. Wiechen, D. R. MacFarlane and L. Spiccia, Energy Environ. Sci., 2015, 8, 2791–2796 RSC.
- M. Dumortier, S. Tembhurne and S. Haussener, Energy Environ. Sci., 2015, 8, 3614–3628 RSC.
- J. H. Kim, J.-W. Jang, Y. H. Jo, F. F. Abdi, Y. H. Lee, R. van de Krol and J. S. Lee, Nat. Commun., 2016, 7, 13380 CrossRef CAS PubMed.
- F. F. Abdi, L. Han, A. H. M. Smets, M. Zeman, B. Dam and R. van de Krol, Nat. Commun., 2013, 4, 2195 CrossRef PubMed.
- S. Kosar, Y. Pihosh, R. Bekarevich, K. Mitsuishi, K. Mawatari, Y. Kazoe, T. Kitamori, M. Tosa, A. B. Tarasov, E. A. Goodilin, Y. M. Struk, M. Kondo and I. Turkevych, Appl. Nanosci., 2019, 9, 1017–1024 CrossRef CAS.
- M. Kölbach, I. J. Pereira, K. Harbauer, P. Plate, K. Höflich, S. P. Berglund, D. Friedrich, R. van de Krol and F. F. Abdi, Chem. Mater., 2018, 30, 8322–8331 CrossRef.
- F. F. Abdi and S. P. Berglund, J. Phys. D: Appl. Phys., 2017, 50, 193002 CrossRef.
- S. P. Berglund, F. F. Abdi, P. Bogdanoff, A. Chemseddine, D. Friedrich and R. van de Krol, Chem. Mater., 2016, 28, 4231–4242 CrossRef CAS.
- K. Sivula and R. van de Krol, Nat. Rev. Mater., 2016, 1, 15010 CrossRef CAS.
- D. K. Lee, D. Lee, M. A. Lumley and K.-S. Choi, Chem. Soc. Rev., 2019, 48, 2126–2157 RSC.
- M. Zhang, Y. Ma, D. Friedrich, R. van de Krol, L. H. Wong and F. F. Abdi, J. Mater. Chem. A, 2018, 6, 548–555 RSC.
- A. Vilanova, T. Lopes, C. Spenke, M. Wullenkord and A. Mendes, Energy Storage Materials, 2018, 13, 175–188 CrossRef.
- K. R. Tolod, S. Hernández and N. Russo, Catalysts, 2017, 7, 13 CrossRef.
- I. Y. Ahmet, Y. Ma, J.-W. Jang, T. Henschel, B. Stannowski, T. Lopes, A. Vilanova, A. Mendes, F. F. Abdi and R. van de Krol, Sustainable Energy Fuels, 2019, 3, 2366–2379 RSC.
- B. Turan, J.-P. Becker, F. Urbain, F. Finger, U. Rau and S. Haas, Nat. Commun., 2016, 7, 12681 CrossRef PubMed.
- S. Dilger, M. Trottmann and S. Pokrant, ChemSusChem, 2019, 12, 1931–1938 CrossRef CAS PubMed.
- I. Holmes-Gentle, H. Agarwal, F. Alhersh and K. Hellgardt, Phys. Chem. Chem. Phys., 2018, 20, 12422–12429 RSC.
- M. R. Singh, K. Papadantonakis, C. Xiang and N. S. Lewis, Energy Environ. Sci., 2015, 8, 2760–2767 RSC.
- C. Carver, Z. Ulissi, C. K. Ong, S. Dennison, G. H. Kelsall and K. Hellgardt, Int. J. Hydrogen Energy, 2012, 37, 2911–2923 CrossRef CAS.
- S. Haussener, C. Xiang, J. M. Spurgeon, S. Ardo, N. S. Lewis and A. Z. Weber, Energy Environ. Sci., 2012, 5, 9922–9935 RSC.
- M. A. Modestino, S. M. H. Hashemi and S. Haussener, Energy Environ. Sci., 2016, 9, 1533–1551 RSC.
- D. V. Esposito, Joule, 2017, 1, 651–658 CrossRef CAS.
- I. Holmes-Gentle, F. Hoffmann, C. A. Mesa and K. Hellgardt, Sustainable Energy Fuels, 2017, 1, 1184–1198 RSC.
- C. C. L. McCrory, S. Jung, I. M. Ferrer, S. M. Chatman, J. C. Peters and T. F. Jaramillo, J. Am. Chem. Soc., 2015, 137, 4347–4357 CrossRef CAS PubMed.
- C. C. L. McCrory, S. Jung, J. C. Peters and T. F. Jaramillo, J. Am. Chem. Soc., 2013, 135, 16977–16987 CrossRef CAS PubMed.
- S. Chen and L. W. Wang, Chem. Mater., 2012, 24, 3659–3666 CrossRef CAS.
- G. Lodi, E. Sivieri, A. De Battisti and S. Trasatti, J. Appl. Electrochem., 1978, 8, 135–143 CrossRef CAS.
- S. Trasatti, J. Electroanal. Chem. Interfacial Electrochem., 1972, 39, 163–184 CrossRef CAS.
- M. G. Walter, E. L. Warren, J. R. McKone, S. W. Boettcher, Q. Mi, E. A. Santori and N. S. Lewis, Chem. Rev., 2010, 110, 6446–6473 CrossRef CAS PubMed.
- K. Kinoshita, Electrochemical oxygen technology, John Wiley & Sons, 1992 Search PubMed.
- A. Battistel, C. R. Dennison, A. Lesch and H. H. Girault, J. Phys. Chem. C, 2019, 123, 10849–10856 CrossRef CAS.
- I. A. Rauf, J. Appl. Phys., 1996, 79, 4057–4065 CrossRef CAS.
- I. A. Rauf, J. Mater. Sci. Lett., 1993, 12, 1902–1905 CrossRef CAS.
- M.-Z. Gao, R. Job, D.-S. Xue and W. R. Fahrner, Chin. Phys. Lett., 2008, 25, 1380–1383 CrossRef CAS.
- R. A. Serway and J. W. Jewett, Principles of physics, Saunders College Pub., Fort Worth, TX, 1998 Search PubMed.
- D. J. Griffiths, Introduction to electrodynamics, Prentice Hall, New Jersey, 1999 Search PubMed.
- Y. Pihosh, I. Turkevych, K. Mawatari, J. Uemura, Y. Kazoe, S. Kosar, K. Makita, T. Sugaya, T. Matsui and D. Fujita, Sci. Rep., 2015, 5, 11141 CrossRef PubMed.
- R. Sheng, A. W. Y. Ho-Baillie, S. Huang, M. Keevers, X. Hao, L. Jiang, Y.-B. Cheng and M. A. Green, J. Phys. Chem. Lett., 2015, 6, 3931–3934 CrossRef CAS PubMed.
- S. Braun, R. Nissler, C. Ebert, D. Habermann and G. Hahn, IEEE J. Photovolt., 2014, 4, 148–153 Search PubMed.
- J. Jaus, H. Pantsar, J. Eckert, M. Duell, H. Herfurth and D. Doble, 35th IEEE Photovoltaic Specialists Conference, 2010, pp. 000979–000983 Search PubMed.
- I. Holmes-Gentle, F. Bedoya-Lora, F. Alhersh and K. Hellgardt, J. Phys. Chem. C, 2019, 123, 17–28 CrossRef CAS.
- Q. Xu, T. S. Zhao and C. Zhang, Electrochim. Acta, 2014, 142, 61–67 CrossRef CAS.
- T. Jyothi Latha and S. Jayanti, J. Appl. Electrochem., 2014, 44, 995–1006 CrossRef CAS.
- A. Vilanova, T. Lopes and A. Mendes, J. Power Sources, 2018, 398, 224–232 CrossRef CAS.
- W. M. Haynes, CRC Handbook of Chemistry and Physics, CRC Press, 2011 Search PubMed.
- P. Dias, T. Lopes, L. Andrade and A. Mendes, J. Power Sources, 2014, 272, 567–580 CrossRef CAS.
- S. Haussener, S. Hu, C. Xiang, A. Z. Weber and N. S. Lewis, Energy Environ. Sci., 2013, 6, 3605–3618 RSC.
- X. Yao, D. Wang, X. Zhao, S. Ma, P. S. Bassi, G. Yang, W. Chen, Z. Chen and T. Sritharan, Energy Technol., 2018, 6, 100–109 CrossRef CAS.
- B. Fuladpanjeh-Hojaghan, M. M. Elsutohy, V. Kabanov, B. Heyne, M. Trifkovic and E. P. L. Roberts, Angew. Chem., Int. Ed., 2019, 58, 16815–16819 CrossRef CAS PubMed.
- O. O. Talabi, A. E. Dorfi, G. D. O'Neil and D. V. Esposito, Chem. Commun., 2017, 53, 8006–8009 RSC.
- R. Babu and M. K. Das, Int. J. Hydrogen Energy, 2019, 44, 14467–14480 CrossRef CAS.
Footnote |
| † Electronic supplementary information (ESI) available: ESI Note on governing equations, Table S1 on baseline parameters and Fig. S1–S10. See DOI: 10.1039/d0se00246a |
| This journal is © The Royal Society of Chemistry 2020 |

