 Open Access Article
Fuel cell evaluation of anion exchange membranes based on poly(phenylene oxide) with different cationic group placement†
Annika
Carlson
 *a,
Björn
Eriksson
a,
Joel S.
Olsson
b,
Göran
Lindbergh
 a,
Carina
Lagergren
a,
Patric
Jannasch
a,
Carina
Lagergren
a,
Patric
Jannasch
 b and
Rakel
Wreland Lindström
a
aApplied Electrochemistry, School of Engineering Sciences in Chemistry, Biotechnology and Health, KTH Royal Institute of Technology, Stockholm, Sweden. E-mail: anncarls@kth.se
bPolymer and Materials Chemistry, Department of Chemistry, Lund University, Lund, Sweden
First published on 24th February 2020
Abstract
Four novel poly(phenylene oxide)-based anion exchange membranes were investigated for electrochemical performance, ionic conductivity and water transport properties in an operating anion exchange membrane fuel cell (AEMFC), using Pt/C gas diffusion electrodes with Tokuyama ionomer. The poly(phenylene oxide)-membranes have a 1- or 5-carbon alkyl spacer between the backbone and a trimethylalkylammonium (TMA) or piperidinium (Pip) cationic group, and ion-exchange capacities (IECs) between 1.5 and 1.9 mequiv g−1. The polymer with a 5-carbon alkyl spacer, a TMA cationic group, and a higher IEC showed the highest ion conductivity and performance in the AEMFC. The results also show that introducing a 5-carbon alkyl spacer does not improve performance unless the IEC is increased and that exchanging the TMA with a Pip cationic group results in lower fuel cell performance despite a higher IEC. A discrepancy in ion conductivity between fuel cell and ex situ test was observed for the 5-carbon spacer polymers and is attributed to a higher sensitivity for dehydration. Similar water flux under load, from the anode to the cathode with increased water content at both electrodes, was observed for all membranes and only varied with membrane thickness. The deviation in fuel cell performance observed between the membranes could not be explained by differences in water flux or ionic conduction, suggesting that the electrode–membrane interaction plays a major role. Nevertheless, the study emphasizes that high membrane conductivity (for the λ-range in a fuel cell) and efficient water transport (obtained by lower membrane thickness) promote higher electrochemical performance.
Introduction
A wide variety of cationic polymers for anion exchange membranes (AEMs) have been developed during the last couple of years.1–4 One major motivation is to improve the performance and stability1,5–7 of anion exchange membrane fuel cells (AEMFCs). AEMFCs have the potential to become a low cost alternative to proton exchange membrane fuel cells because they could possibly function well with non-platinum catalysts.8–10 However, due to the alkaline environment, AEMs are susceptible to rapid degradation via, for example, the Hofmann mechanism or nucleophilic attacks from the hydroxide ion, leading to a loss of conductive groups.2,5,11 High stability and performance have been reported for a number of newly developed polymer groups,1 such as, radiation grafted ethylene tetrafluoroethylene,4 poly(aryl piperidinium)12 and poly(phenylene oxide) (PPO).13–15This paper focuses on membranes with PPO as a backbone. This polymer family has been extensively studied for different side-chain configurations, and in some cases as co-polymers or as blend materials.13–22 All ex situ studies show high performances, such as conductivities of 20–90 mS cm−1 in contact with liquid water and stabilities of up to 200 h in aqueous 1 M KOH or NaOH at 80 °C.13,16–22 However, poor stability with hydration cycling, and lowered conductivity for lower relative humidity have also been reported for these types of membranes.16,23,24 In operating AEMFCs, single polarisation curves of PPO-based membranes have shown that these materials can be used in a fuel cell.13,17,18,25–27 However, there are only a few studies where correlations between membrane properties ex situ and in the fuel cell are analysed.16,28 Liu et al.16 used materials with different ammonium cationic groups directly attached to the polymer backbone and varied the lengths of alkyl chains attached to the cationic groups. They placed little focus on explaining cell performance differences, but showed that the stability over time for the membranes in the fuel cell was almost the reverse of that observed in KOH solution. In another study, Park et al.28 studied a nanofiber composite anion exchange membrane based on diamine-crosslinked poly(phenylene oxide) and polyphenylsulfone. The study showed that both ionomer type in the catalyst layer and membrane thickness can influence performance, but the study only presented polarisation curves where both aspects were changed simultaneously. Thus, there is a need for studies focused on relating fuel cell performance to different PPO-based structures and ex situ properties.
One major difference for membranes in an operating AEMFC, compared to KOH solution, is the phase of water. The study of membranes ex situ with regard to both hydration number (λ-value), i.e. H2O molecules per functional group, and water transport properties are therefore gaining more interest.29–31 It has been shown that the λ-value can vary with membrane thickness,30 and that there is a humidification threshold for water channel formation and clustering in the membrane structure.29 A previous study on a PPO-based membrane with a 5-carbon alkyl spacer showed a decrease of λ-value (in humidified gas λgas) from ∼14 to ∼10 for a change in RH from 100 to 90% at 40 °C.5 Both values are significantly lower than those measured for membranes allowed to equilibrate in contact with liquid water (λliq ≈ 20–40).5,14 Furthermore, studies have shown that the ionic conductivity of PPO is closely linked with hydration number.14–16 It can therefore be expected that in an AEMFC, where the membrane will be equilibrated with humidified gas, the membrane will have a lower λ, and subsequently lower ionic conductivity, than if in contact with liquid water.
Achieving an optimal water balance in an operating AEMFC is complicated, as water is a reacting species at the cathode and a product at the anode. Asymmetrically lowering the inlet relative humidity (RH) has been discussed as a key aspect for balancing the water between anode and cathode.3,4,31,32 How relative humidity and high performance relates to water flux is often theorized about. There are several studies using setups that only measure water transport as a function of water gradients across the membrane,33,34 but this does not take into account the effect of applied current. There are two studies that utilize cold traps at anode and cathode outlet to study the overall water transport across the AEMFC during operation.35,36 In the first study35 a Tokuyama A201 membrane was studied at different humidities and current densities, showing an overall water flux from anode to cathode, in the opposite direction of hydroxide ion transport. This flux direction was also measured with in-line humidity sensors in a recent study by our group.37 In the other study36 using cold traps and pore filled membranes, the total water flux was identified both from cathode to anode and in the opposite direction depending on membrane hydrophobicity and thickness. Differences in water transport suggest that it can depend on polymer properties.31 There are no other studies of current-induced water flux for PPO-based membranes.
The PPO polymer structures used in this study have been evaluated ex situ.14,15 These initial studies focused largely on increasing stability and ionic conductivity. Increased phase separation and so, ionic conductivity was achieved by introducing an alkyl spacer between the polymer backbone and the cationic group.14 Increased stability was observed with different types of hetero-cycloaliphatic quaternary ammonium groups attached via 5-carbon spacers.15 The ex situ results suggested that the membranes have promising properties for use in AEMFC: high hydroxide conductivity (up to ∼100 mS cm−1 in contact with liquid water); long-term stability in 1 M NaOH solution (up to 200 h at 80 °C); and high thermal resistance. The purpose of this study is to correlate the PPO polymer structures to properties in an AEMFC such as electrochemical performance, ionic conductivity, diffusion-driven water flux and water flux due to applied current. Furthermore, to investigate how ex situ properties relate to those during AEMFC operation.
Experimental
Membrane preparation
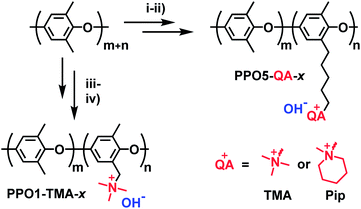
The synthesis of the investigated membranes has been described in detail in previous reports.14,15 In summary the polymers were synthesized via either benzylbromination or bromoalkylation of PPO, followed by Menshutkin quaternization reactions with trimethylamine or 1-methyl piperidine (Fig. 1) resulting in polymers with cationic groups in either benzyl positions (denoted PPO1-TMA-x) or attached via alkyl 5 carbon spacers (denoted PPO5-TMA-x and -Pip-x, respectively). Here, x is the ion-exchange capacity (IEC) in the hydroxide form. After synthesis, solutions of 5 wt% polymer in N-methyl-2-pyrrolidone (NMP) were prepared and filtered onto Petri dishes (Ø = 5 cm) before casting membranes during 48 h at 85 °C. The structure of the polymers selected for this fuel cell study are shown in Fig. 1 and their ex situ measured properties are summarized in Table 1. In general, the backbone is the same for all polymers, but the number of carbons in the cationic side chain, the ion-exchange capacity, and the type of cationic group are varied.| Membranes | Carbon spacer | Cationic group | IEC/mequiv. g−1 | σ ex situ /mS cm−1 | Water uptakea/wt% | λ liq/molH2O/molamine | δ /µm |
|---|---|---|---|---|---|---|---|
| a AEMs in hydroxide form measured at 60 °C after equilibrating in liquid. b The thickness was measured before each test for the received membranes. | |||||||
| PPO1-TMA-1.5 | 1 | TMA | 1.5 | 10 | 26 | 10 | ∼45 ± 5 |
| PPO5-TMA-1.5 | 5 | 1.5 | 84 | 68 | 25 | ∼45 ± 5 | |
| PPO5-TMA-1.9 | 5 | 1.9 | 110 | 73 | 21 | ∼30 ± 5 | |
| PPO5-Pip-1.8 | 5 | Pip | 1.8 | 93 | 75 | 23 | ∼45 ± 5 |
Before fuel cell testing, the membranes (prepared with bromide as counter ion) were ion-exchanged into the hydroxide form. The ion-exchange and fuel cell preparation took place in a CO2 free glovebox by submerging the membrane in 1 M KOH solution during 5 days and changing the solution at least once every 24 h. The membranes were thereafter transferred to Milli-Q water (18.2 MOhm cm) overnight and rinsed twice more directly prior to the fuel cell test to remove any excess of hydroxide ions.
Membrane electrode assembly preparation
The electrode preparation was described previously38 and materials used were Tanaka 36% Pt catalyst on high surface area carbon, AS-4 ionomer solution from Tokuyama Corp. and Sigracet 25BC gas diffusion layer (GDL). The catalyst layer was drop-casted onto the GDL and the same type of electrodes were used as both anode and cathode in all tests. The finished electrodes had a loading of approximately 0.4 mgPt cm−2, 37 wt% ionomer content and a geometric surface area of 0.95 cm2. The ion-exchanged membrane was mounted wet between two of the electrodes, with an applied torque of 4 Nm. A Fuel Cell Technologies Inc. cell housing with custom spiral pattern flow fields was used (flow field shown in Fig. S1†). The ion-exchange, rinsing and mounting of the cell took place in a CO2 free glovebox.Electrochemical characterization
The cell housing was mounted in a testing station described previously37(schematic shown in Fig. S1†) and was then heated under constant argon flow to a cell temperature of 50 °C, a humidifier temperature of 50 °C (100% RH) at both anode and cathode and an inlet and outlet pipe temperature around 60 °C to avoid condensation. Once the system reached the above temperatures, the gases were switched to oxygen and hydrogen at flow rates of 130 mln min−1 controlled by Alicat MC-500SCCM-D-DB15 mass flow controllers. All flow rates are given at 25 °C and 1 atm. Using a Solartron 1287 potentiostat, the cell was activated by potentiostatic hold at 0.5 V for 30 min and then at 0.2 V for 15 min, and this was repeated once. Thereafter, a potentiodynamic sweep from open circuit voltage (OCV) to 0.1 V was performed at a scan rate of 1 mV s−1, followed by two additional potentiostatic holds, at 0.5 V and 0.2 V, and a second potentiodynamic sweep to ensure that the cell performance was stable. Then, the cell resistance at various current densities was measured by galvanostatic electrochemical impedance spectroscopy (EIS) at currents of 16, 50, 100, 200, 300 and 400 mA (17, 53, 105, 211, 316, 421 mA cm−2). Depending on cell performance the highest current may be excluded. The impedance measurements were performed using a Solartron 1255 HF frequency response analyser in galvanostatic mode with an amplitude of 1 mA for the two lowest currents and 10 mA for the remaining currents. The frequency was scanned from 100 kHz to 200 mHz, using 8 steps per decade. The potentiodynamic sweep and EIS were measured both under saturated cell conditions (100% RH) and at 90% RH where all humidity sensors had equilibrated to a steady state. During the humidity change the cell was operated at a constant voltage of 0.7 V.Water flux measurements
An in-house designed test station, described in more detail in a previous study,37 utilizes HYT 939 humidity sensors at inlet and outlet to monitor the relative humidity and temperature of the gas streams before and after the cell house. This allows for the measurement of water flux across membranes both as a function of water partial pressure gradients and as a function of applied current. These measurements are performed after the electrochemical characterization as they may increase MEA degradation due to lowered hydration. First, the water transport with an applied current is measured, using hydrogen and oxygen gas at 90% RH. A current density of increasing magnitude is applied and the water flux measured; currents of 50, 100, 200, 300, 400 mA (53, 105, 211, 316, 421 mA cm−2) are used and the maximum current is decided by the cell performance. Each current is measured for 10 min, with 5 min of OCV between current steps. Second, calibration points for the sensors are obtained by symmetrically lowering the temperature of both humidifiers and measuring the sensor's response. The results of these measurements are then used to calculate the flux of water from the anode to the cathode under applied current. In the final measurement both gas flows are switched to argon, at 130 mln min−1, and the humidifier temperature is changed asymmetrically at the two sides of the MEA. The inlet RH is varied between 70 and 95%.The data from the measurements were further evaluated using a model, presented in our previous work,37 and summarized as eqn (1):
 | (1) |
Analysis of ion-exchange using X-ray fluorescence (XRF)
The membranes were analysed using an Itrax XRF core scanner, both as received and after the ion-exchange described above. The analysis focused only on the bromide content and evaluation of the elemental data was performed by comparing the mean peak values. Prior to the test, the membrane pieces were stored wet and then dried at room temperature 15 h before the measurement. Due to variations in thickness the peak height was correlated to mean membrane thickness, measured using a micrometer, to be able to correctly compare the relative changes of bromide content before and after ion-exchange.Results and discussion
Table 1 lists the different PPO-based AEMs investigated in this study. The PPO1-TMA-1.5 with a 1-carbon spacer was used as a reference as it has been studied previously in fuel cell applications.16 The PPO5-TMA-1.5 was chosen in order to investigate the effect of a 5-carbon alkyl spacer on fuel cell performance. The introduced spacer was shown to increase the ex situ ionic conductivity for the same ion-exchange capacity (IEC) compared to PPO1-TMA-1.5. The effect of IEC was investigated by comparing PPO5-TMA-1.5 and PPO5-TMA-1.9. The latter showed even higher ex situ ionic conductivity compared to PPO5-TMA-1.5. Finally, PPO5-Pip-1.8 was selected as it showed increased stability in KOH solution as a result of the piperidium (Pip) compared to the trimethylalkylammonium (TMA) cationic group.Polarisation curves for MEAs with the same electrodes, but different AEMs, are compared to each other under 90% RH conditions in Fig. 2. The high OCV (above 1.03 V) for all membranes indicates good gas barrier properties. Furthermore, the overall initial performance is similar as previously reported for PPO-based membranes combined with AS-4 as ionomer in the catalyst layer.16 The performance order related to polymer structure is; PPO5-TMA-1.9 > PPO1-TMA-1.5 > PPO5-TMA-1.5 > PPO5-Pip-1.8. It shows that elongation of the carbon spacer does not improve performance unless the IEC is simultaneously increased from 1.5 to 1.9. However, the PPO5-TMA-1.9 membrane used in the best performing cell is, also the thinnest AEM (∼30 µm, Table 1), as a consequence of the limited control of the obtained membrane thickness during solution casting.
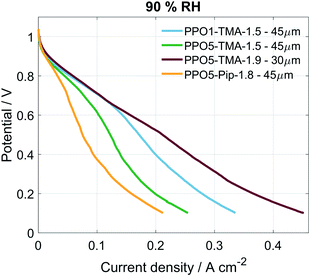 | ||
| Fig. 2 Polarisation curves for the different cells under 90% RH conditions, the curves were obtained at 50 °C with a scan rate of 1 mV s−1, from OCV to 0.1 V and O2/H2 flow of 130 mln min−1. | ||
To rule out that the higher performance is not only a consequence of the thinner membrane, a 55 ± 5 µm membrane of the same polymer was also tested, shown in Fig. S2.† The thicker membrane showed a similarly high cell performance as the thinner PPO5-TMA-1.9 and the PPO1-TMA-1.5 membranes down to 0.6 V (and approximately 200 mA cm−2). The fact that PPO5-Pip-1.8 has the lowest overall performance, even with high IEC, indicates that exchanging the cationic group from TMA to Pip decreases the expected improvement with increased number of conductive groups. This indicates that the performance during fuel cell operation cannot be directly correlated to the ex situ measured ionic conductivity and thickness shown in Table 1 based on which especially the AEMs PPO5-TMA-1.5 and PPO5-Pip-1.8 should perform better.
In order to understand what is causing the difference in performance between the membranes, the cell resistance was measured during AEMFC operation at two humidification levels by electrochemical impedance spectroscopy (EIS). The conductivities, seen in Table 2, were calculated from the high frequency resistances (HFR), at a current of 16 mA (Fig. 7). All membranes show conductivities above 8 mS cm−1, which is in the same order of magnitude as the Tokuyama A201. The similar HFR, especially for PPO1-TMA-1.5, PPO5-TMA-1.5 and PPO5-Pip-1.8, shows that the membrane conductivity cannot entirely explain the differences observed in the polarisation curves. Still, an approximately 60% increase in ionic conductivity is observed when the IEC is increased from 1.5 to 1.9 for PPO5-TMA-x, which can be part of the reason for the higher performance with higher IEC. Furthermore, the measured conductivity for the 55 µm PPO5-TMA-1.9 membrane was 19 ± 2 mS cm−1 (HFR = 0.29 Ω cm2), indicating the specific conductivity is independent of thickness.
| Membranes | HFRsat [Ω cm2] | HFR90 % RH [Ω cm2] | σ sat [mS cm−1] | σ 90 % RH [mS cm−1] |
|---|---|---|---|---|
| Tokuyama | — | 0.18 | — | 16 |
| PPO1-TMA-1.5 | 0.35 | 0.41 | 13 ± 1 | 11 ± 1 |
| PPO5-TMA-1.5 | 0.35 | 0.47 | 13 ± 1 | 10 ± 1 |
| PPO5-TMA-1.9 | 0.14 | 0.17 | 21 ± 3 | 17 ± 3 |
| PPO5-Pip-1.8 | 0.40 | 0.54 | 11 ± 1 | 8 ± 1 |
Surprisingly, all membranes with a 5-carbon alkyl spacer (PPO5) showed an 80% drop in ionic conductivity in the AEMFC at 50 °C compared to ex situ measurements at 60 °C (comparing Tables 1 and 2) and a ∼75% lower ionic conductivity compared to ex situ measurements at 40 °C.14,15 Hence, the lower conductivity in the AEMFC cannot be the solely due to the lower temperature. To exclude that the conductivity drop was due to insufficient ion-exchange and remaining bromide, X-ray fluorescence (XRF) was performed before and after the ion-exchange. These measurements showed that PPO1-TMA-1.5 had approximately 30% left of the initial bromide content, while all the polymers with 5-carbon alkyl spacer had around 4% left. Therefore, remaining bromide cannot explain the lower ionic conductivity in the fuel cell compared to ex situ values. Furthermore, the ionic conductivity drops with 2–4 mS cm−1 when the relative humidity is decreased from saturated to 90% for all membranes. Thus, the difference in conductivity loss with humidification and compared to in liquid could be correlated to the polymers' λliq-values presented in Table 1. PPO1-TMA-1.5 has a lower λliq-value (around 10) and therefore a lower capacity for water uptake, compared to the AEMs with a 5-carbon spacer (λliq ≈ 25). The higher λliq-values should lead to a higher degree of channel formation, clustering and a more open structure when the membrane is fully hydrated. Similar polymers in literature show significantly lower λ-values at 90% RH compared to saturated conditions and compared to when swelled in liquid water.5,31 Furthermore, a large dependence of membrane conductivity on the λ-value has been shown for several types of AEMs.23,31 If the ionic conductivity of the polymers with a 5-carbon spacer studied here is dependent on an open membrane macro structure it could explain the lower conductivity obtained during AEMFC operation and indicates a larger dependence on humidification.
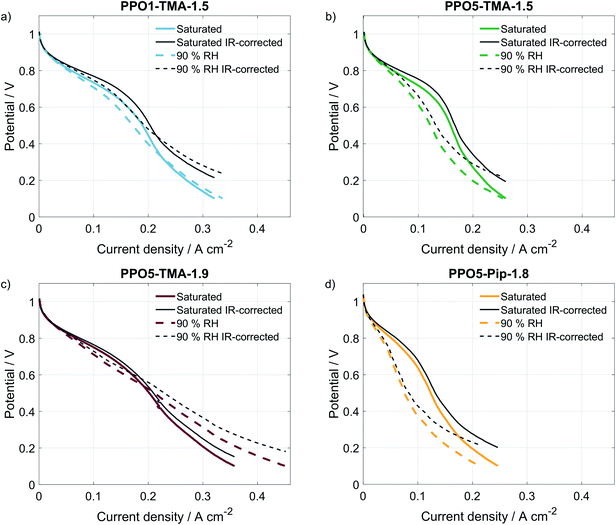
A comparison of the effect of humidification on performance for each type of AEM is shown as polarisation curves in Fig. 3. The PPO1-TMA-1.5 and PPO5-TMA-1.9, only have a small loss of performance with lowered humidification at potentials above 0.6 V (Fig. 3a and c), i.e. in the region where a fuel cell normally operates. At lower potentials, there is even an increase in performance for PPO5-TMA-1.9, at 90% RH. For the other two polymer membranes, PPO5-TMA-1.5 and PPO5-Pip-1.8, the performance decreases significantly with lowered humidity (Fig. 3b and d). Still, at saturated conditions the performance order in-between polymer structures is the same as at 90% RH.
The IR-corrected polarisation curves (plotted using the HFR values from Table 2) are also included in Fig. 3, represented as grey lines. The correction for the IR-drop caused by the membrane resistance does not result in overlapping curves. This shows that a change in the humidity affects the performance in more ways than through increased resistance. The IR-corrected curves for PPO1-TMA-1.5 and PPO5-TMA-1.9 (Fig. 3a and c) under saturated conditions overlap, showing that at saturated conditions the performance difference between these two membranes is the cell resistance. However, at 90% RH the IR-corrected curves for these AEMs only overlap down to approximately 0.6 V, i.e. at the same point where PPO5-TMA-1.9 starts to have a larger increase in current at 90% RH. For PPO5-TMA-1.5 and PPO5-Pip-1.8, the lower performance, compared to PPO5-TMA-1.9 or PPO1-TMA-1.5, cannot be fully explained by cell resistance neither at saturated nor at 90% RH conditions.
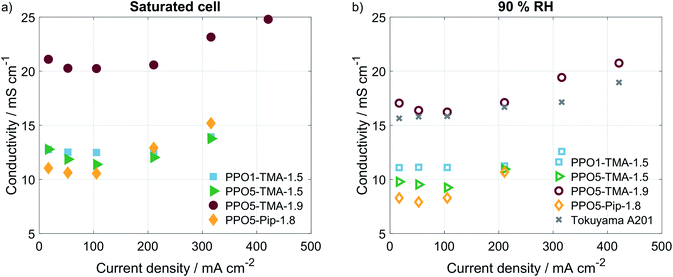
To verify if there were large differences in membrane resistance with current, i.e. higher water production and humidification, the HFR was measured at several current densities using galvanostatic EIS. The corresponding calculated values of ionic conductivity are plotted in Fig. 4. For all polymer structures an increase of the membranes' conductivity is observed for currents above 100 mA, which indicates that increased water production and humidification of the cell results in higher ion conductivity. Still, the increase is quite small and would not change the IR-drop or performance significantly for the current densities obtained. This is in accordance with small differences in performance reported in previous modelling studies of membranes with different levels of IEC and thereby different resistances.39 This further supports the claim that, though the membrane resistance varies, the largest cause of different performances lies somewhere else in the cell.
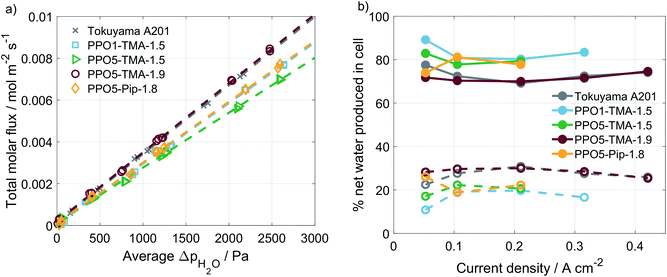
A correlation is often made between performance and water flux for AEMFCs. In order to investigate whether variations in polymer structure affect the water transport properties, experiments were performed in a setup with humidity sensors at the in- and outlets. The water transport is usually divided in the diffusion-driven water flux, arising from differences in water partial pressure on the two sides, and the apparent drag, which is the water transport related to an applied current.33,34 The diffusion-driven water flux was studied in an Ar/Ar cell with varying humidity levels at the two sides of the MEA. An example of this type of measurement is shown in ESI, Fig. S3.† By stepwise setting RH levels and measuring the water flux across the membrane as a function of average differences in water partial pressure, the plot in Fig. 5a is obtained. The diffusion-driven water flux is quite close for all of the PPO membranes studied and similar to the Tokuyama A201 membrane.
The current-induced water flux was measured at varying current densities, an example of the measurement is found in ESI, Fig. S3.† The measurement was repeated for each of the PPO-membranes and the water flux under load is compared as the percentage of produced water leaving the cell at the anode and the cathode side, as shown in Fig. 5b. The percentages are calculated using eqn (2), which shows the example for the cathode side.
 | (2) |
A plug-flow model accounting for the differences in water content in the gases between inlet and outlet37 was used to extract the transport coefficients (K) and the apparent drag coefficients (η), shown in Table 3. The model showed a good fit to the data and assigns specific values to the measurements in Fig. 5. By simulating the increase in water partial pressure along the flow field with increased current density and using coefficients in the model it can be derived that 10–15% of the water flux from anode to cathode is diffusion-driven due to gradients in water partial pressure. The remaining water flux is current-induced, described by the apparent drag. The fact that diffusion-driven water flux between gas phase water states cannot fully explain the water transport has been discussed previously based on ex situ measurements.33,34
| Membrane | K × 106 [mol Pa−1 m−2 s−1] | η |
|---|---|---|
| Tokuyama A201 | 3.36 | −0.58 |
| PPO1-TMA-1.5 | 2.89 | −0.54 |
| PPO5-TMA-1.5 | 2.66 | −0.55 |
| PPO5-TMA-1.9 | 3.40 | −0.60 |
| PPO5-Pip-1.8 | 2.94 | −0.50 |
For all of the cells studied here, a negative apparent drag coefficient is obtained, meaning that the net water flux in the cell goes from anode to cathode, in the opposite direction of the hydroxide ion transport. This indicates little risk of current-induced cathode dry-out, at present conditions, for any of the tested AEMs. Still, flooding is possible at higher current densities and would most likely occur first at the anode, where there is a larger increase in the gas stream water content than at the cathode. A larger flux is observed for the thinner membranes, i.e. Tokuyama and PPO5-TMA-1.9, indicating a dependence of water flux on thickness. In Fig. 6 the percentage of net water produced in the cell leaving through the cathode outlet, at an applied current of 200 mA, is plotted for several membrane thicknesses of the different polymer structures. The dashed line is a linear correlation and the data distribution seems to indicate that the water flux properties are primarily a function of membrane thickness. In comparison the variations in polymer structure and λliq-value seem to be of minor importance for the water transport. A high dependence on membrane thickness has previously been observed in ex situ studies.40 Furthermore, the linear correlation indicates that for membrane thicknesses investigated in this study, i.e. below 100 µm, there is only risk for current-induced flooding at both electrodes.
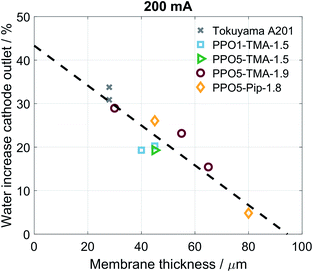 | ||
| Fig. 6 Percentage net water produced in cell at the cathode outlet for several different thicknesses independent of polymer structure. Corresponding to the cathode values from Fig. 5b at 211 mA cm−2 as well as the same point for additional water flux measurements. | ||
One conclusion from Fig. 5 and 6 is that thinner membranes should have more favourable water distribution, which would allow for higher performances. This correlates well with the results regarding the 30 µm PPO5-TMA-1.9 membrane, which has higher water flux and performance compared to the other PPO membranes. However, higher water flux does not seem to impact the performance at current densities below 200 mA cm−2. This is shown by comparing the performance of the 30 µm and 55 µm PPO5-TMA-1.9 cells and also the PPO1-TMA-1.5 cell, see Fig. S2,† with 28%, 24% and 20% of water leaving the cells at the cathode, respectively.
After the water flux measurements, a significant and unrecoverable performance loss was observed for all membranes (Fig. S4†). Analysis by 1H NMR spectroscopy (Fig. S5†), after the tests, revealed no new or altered signals in comparison to the initial materials. The lack of new signals indicates that no loss of functional groups and no crosslinking of the polymer have taken place. Thus, no chemical changes to the polymer structure have occurred. However, no chemical degradation does not exclude membrane macro structure changes, which could potentially lower the performance with time. Still, as no chemical degradation was observed after end of life in comparison to pristine membranes, the possibility that degradation during ion-exchange or activation was the cause of performance differences at beginning of life can be excluded.
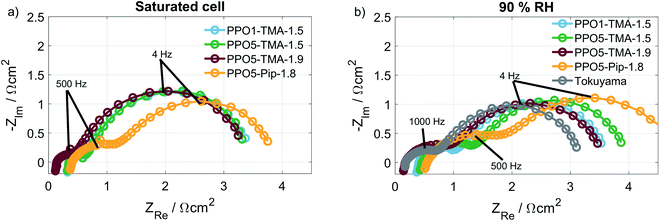
As shown, neither the direct membrane properties studied here (ionic conductivity and water flux), nor polymer degradation can fully explain the cell performance differences observed in the polarisation curves, Fig. 2. Therefore, EIS was used to investigate if there was a difference in the electrode behaviour between the cells. Fig. 7a and b show the Nyquist plots at 16 mA, at saturated and 90% RH conditions, respectively. The HFR-values, listed in Table 2, associated to the membrane resistance have been discussed before. Therefore, focus is now placed on the low frequency resistance (LFR) that correlates to the slope of the polarisation curves and is dependent on electrode processes. All membranes with a TMA cationic group have similar LFR and semi-circular behaviour at saturated conditions. At 90% RH the LFR for the cell with a PPO5-TMA-1.5 membrane shifts to a higher value as a result of an increased radius of the high frequency semicircle (to the left). For the cell with a PPO5-Pip-1.8 membrane the high frequency semicircle is distinctly larger already at saturated conditions and increases at 90% RH, resulting in this cell having a larger LFR for both levels of humidification. In Fig. 3, the PPO5-Pip-1.8 cell also has the steepest gradient of the polarisation curves, regardless of humidity.
At higher current density (210 mA cm−2) the impedance response, shown in Fig. S6,† is less distinct, due to overlapping semicircles, and the variation in potential between samples, at a specific current density, makes the comparison difficult. Nevertheless, the impedance clearly shows that the membrane type affects the semicircle sizes and hence the electrode behaviour, even though the composition of the electrodes is the same for all MEAs. In a previous publication,41 it was suggested that a mismatch in polymer properties between electrodes and membrane may impact the continuity of ion-conduction through the cell, i.e. also in the ionomer. Another study by Liu et al.16 suggests that the water transport on a microscale at the interface between the electrodes and the membrane is affected. A third possibility is that contaminants in the membrane migrate and cause continuous poisoning of the catalyst layer. All three effects may cause uneven current distribution and limitations of the reactions that could possibly explain the increased impedance. This suggests that the electrode and membrane mismatch highly affects the fuel cell performance and is an interesting topic for future studies. Still, this study has experimentally verified two important parameters that result in higher performance in an operating AEMFC: high negative apparent drag under load; and low membrane resistance. Both are dependent on membrane thickness, which has been indicated previously in modelling studies.42,43 Furthermore, it is indicated that membranes with high λliq-values have a higher discrepancy between ex situ and fuel cell measurements.
Conclusions
The membrane's ionic conductivity, and the diffusion-driven as well as current-induced water flux were measured during AEMFC operation and correlated to the fuel cell performance of four different PPO-based membranes. The results show that the introduction of a 5-carbon alkyl spacer between the cationic group and polymer backbone does not improve performance unless the ion-exchange capacity is increased significantly. Introduction of a piperidinium cationic groups results in lower performance regardless of high ion-exchange capacity. This may be related to the high hydration number for the polymers with 5-carbon spacers when in contact with liquid water, which seems to limit their conductivity and performance in the presence of only gas phase water. A dependence on humidification is supported by the maintained conductivity and performance of the membrane with a 1-carbon spacer, which has a lower capacity for water uptake. On a cell perspective it is also shown that a thinner membrane clearly improves the water transport from anode to cathode leading to a more favourable water distribution, which primarily impacts the performance at higher currents. Another aspect that seems to influence the performance is a mismatch between the electrodes and the membrane, but more studies are needed to understand this interaction. Nevertheless, it can still be concluded that membrane properties such as high ionic conductivity (for the λ-range in an operating fuel cell) and a higher water transport from anode to cathode improve the performance. Furthermore, as there was no observable loss of functional groups, even after fuel cell evaluation and humidity variation, the PPO-based polymers studied are good candidates for continued AEMFC development.Conflicts of interest
There are no conflicts to declare.Acknowledgements
This project is financially supported by the Swedish Foundation for Strategic Research, the Swedish Vehicle Research and Innovation program, the Swedish Energy Agency, the Swedish Research Council and the Swedish governmental initiative StandUp for Energy. Many thanks to Dr Hai-Son Dang, responsible for the initial synthesis of the polymer materials, and to Dr Malin Kylander at Stockholm University, for assistance with the XRF measurements.References
- D. R. Dekel, J. Power Sources, 2018, 375, 158–169 CrossRef CAS.
- J. R. Varcoe, P. Atanassov, D. R. Dekel, A. M. Herring, M. A. Hickner, P. A. Kohl, A. R. Kucernak, W. E. Mustain, K. Nijmeijer, K. Scott, T. Xu and L. Zhuang, Energy Environ. Sci., 2014, 7, 3135–3191 RSC.
- T. J. Omasta, L. Wang, X. Peng, C. A. Lewis, J. R. Varcoe and W. E. Mustain, J. Power Sources, 2018, 375, 205–213 CrossRef CAS.
- T. J. Omasta, A. M. Park, J. M. Lamanna, Y. Zhang, X. Peng, L. Wang, D. L. Jacobson, J. R. Varcoe, D. S. Hussey, B. S. Pivovar and W. E. Mustain, Energy Environ. Sci., 2018, 11, 551–558 RSC.
- K. Kreuer and P. Jannasch, J. Power Sources, 2018, 375, 361–366 CrossRef CAS.
- D. R. Dekel, S. Willdorf, U. Ash, M. Amar, S. Pusara, S. Dhara, S. Srebnik and C. E. Diesendruck, J. Power Sources, 2018, 375, 351–360 CrossRef CAS.
- J. Parrondo, Z. Wang, M. S. J. Jung and V. Ramani, Phys. Chem. Chem. Phys., 2016, 18, 19705–19712 RSC.
- E. S. Davydova, S. Mukerjee, F. Jaouen and D. R. Dekel, ACS Catal., 2018, 8, 6665–6690 CrossRef CAS.
- A. Sarapuu, E. Kibena-Põldsepp, M. Borghei and K. Tammeveski, J. Mater. Chem. A, 2017, 776–804 Search PubMed.
- S. Ratso, I. Kruusenberg, M. Käärik, M. Kook, L. Puust, R. Saar, J. Leis and K. Tammeveski, J. Power Sources, 2018, 375, 233–243 CrossRef CAS.
- K. Kreuer, Chem. Mater., 2014, 26, 361–380 CrossRef CAS.
- J. Wang, Y. Zhao, B. P. Setzler, S. Rojas-Carbonell, C. Ben Yehuda, A. Amel, M. Page, L. Wang, K. Hu, L. Shi, S. Gottesfeld, B. Xu and Y. Yan, Nat. Energy, 2019, 4, 392–398 CrossRef CAS.
- C. Yang, L. Liu, X. Han, Z. Huang, J. Dong and N. Li, J. Mater. Chem. A, 2017, 5, 10301–10310 RSC.
- H.-S. Dang and P. Jannasch, Macromolecules, 2015, 48, 5742–5751 CrossRef CAS.
- H. S. Dang and P. Jannasch, J. Mater. Chem. A, 2017, 5, 21965–21978 RSC.
- L. Liu, X. Chu, J. Liao, Y. Huang, Y. Li, Z. Ge, M. A. Hickner and N. Li, Energy Environ. Sci., 2018, 11, 435–446 RSC.
- N. Chen, C. Long, Y. Li, C. Lu and H. Zhu, ACS Appl. Mater. Interfaces, 2018, 10, 15720–15732 CrossRef CAS PubMed.
- N. Chen, D. Wang, C. Long, Y. Li, C. Lu, F. Wang and H. Zhu, Nanoscale, 2018, 10, 18680–18689 RSC.
- H. Lim and T. H. Kim, Macromol. Res., 2017, 25, 1220–1229 CrossRef CAS.
- C. X. Lin, Y. Z. Zhuo, A. N. Lai, Q. G. Zhang, A. M. Zhu, M. L. Ye and Q. L. Liu, J. Membr. Sci., 2016, 513, 206–216 CrossRef CAS.
- K. H. Gopi, S. D. Bhat, A. K. Sahu and P. Sridhar, J. Appl. Polym. Sci., 2016, 133, 1–11 CrossRef.
- L. Zhu, X. Yu and M. A. Hickner, J. Power Sources, 2018, 375, 433–441 CrossRef CAS.
- N. Ziv, A. N. Mondal, T. Weissbach, S. Holdcroft and D. R. Dekel, J. Membr. Sci., 2019, 586, 140–150 CrossRef CAS.
- K. Kreuer and P. Jannasch, J. Power Sources, 2017, 1–6 Search PubMed.
- N. Chen, C. Long, Y. Li, D. Wang, C. Lu, H. Zhu and J. Yu, ACS Appl. Mater. Interfaces, 2018, 10, 18246–18256 CrossRef CAS PubMed.
- J. Xue, L. Liu, J. Liao, Y. Shen and N. Li, J. Membr. Sci., 2017, 535, 322–330 CrossRef CAS.
- H. Zhu, R. Li, F. Wang, N. Chen, Z. Li and Z. Wang, J. Mater. Sci., 2017, 52, 11109–11119 CrossRef CAS.
- A. M. Park, R. J. Wycisk, X. Ren, F. E. Turley and P. N. Pintauro, J. Mater. Chem. A, 2015, 4, 132–141 RSC.
- Q. Duan, S. Ge and C.-Y. Wang, J. Power Sources, 2013, 243, 773–778 CrossRef CAS.
- V. J. Bharath, J. Millichamp, T. P. Neville, T. J. Mason, P. R. Shearing, R. J. C. Brown, G. Manos and D. J. L. Brett, J. Membr. Sci., 2016, 497, 229–238 CrossRef CAS.
- Y. Zheng, U. Ash, R. P. Pandey, A. G. Ozioko, J. Ponce-González, M. Handl, T. Weissbach, J. R. Varcoe, S. Holdcroft, M. W. Liberatore, R. Hiesgen and D. R. Dekel, Macromolecules, 2018, 51, 3264–3278 CrossRef CAS.
- D. R. Dekel, M. Amar, S. Willdorf, M. Kosa, S. Dhara and C. E. Diesendruck, Chem. Mater., 2017, 29, 4425–4431 CrossRef CAS.
- T. A. Zawodzinski, T. E. Springer, F. Uribe and S. Gottesfeld, Solid State Ionics, 1993, 60, 199–211 CrossRef CAS.
- M. Adachi, T. Navessin, Z. Xie, B. Frisken and S. Holdcroft, J. Electrochem. Soc., 2009, 156, B782 CrossRef CAS.
- T. Isomura, K. Fukuta, H. Yanagi, S. Ge and C. Wang, in 219th ECS meeting, 2011, Abstract no. 221 Search PubMed.
- H. Zhang, H. Ohashi, T. Tamaki and T. Yamaguchi, J. Phys. Chem. C, 2013, 117, 16791–16801 CrossRef CAS.
- B. Eriksson, H. Grimler, A. Carlson, H. Ekström, R. Wreland Lindström, G. Lindbergh and C. Lagergren, Int. J. Hydrogen Energy, 2019, 44, 4930–4939 CrossRef CAS.
- A. Carlson, P. Shapturenka, B. Eriksson, G. Lindbergh, C. Lagergren and R. Wreland Lindström, Electrochim. Acta, 2018, 277, 151–160 CrossRef CAS.
- D. R. Dekel, I. G. Rasin, M. Page and S. Brandon, J. Power Sources, 2018, 375, 191–204 CrossRef CAS.
- X. Luo, A. Wright, T. Weissbach and S. Holdcroft, J. Power Sources, 2018, 375, 442–451 CrossRef CAS.
- J. Zhou, J. Guo, D. Chu and R. Chen, J. Power Sources, 2012, 219, 272–279 CrossRef CAS.
- H.-S. Shiau, I. V. Zenyuk and A. Z. Weber, J. Electrochem. Soc., 2017, 164, E3583–E3591 CrossRef CAS.
- S. Peng, J. Gong, X. Xu, P.-C. Sui, S. Lu and Y. Xiang, J. Phys. Chem. C, 2015, 119, 24276–24281 CrossRef CAS.
Footnote |
| † Electronic supplementary information (ESI) available. See DOI: 10.1039/c9se01143a |
| This journal is © The Royal Society of Chemistry 2020 |

