
 Open Access Article
 This Open Access Article is licensed under a
 Creative Commons Attribution 3.0 Unported Licence
Strategies for the deposition of LaFeO3 photocathodes: improving the photocurrent with a polymer template†
Emma
Freeman
 ab,
Santosh
Kumar
ac,
Veronica
Celorrio
d,
Min Su
Park
e,
Jong Hak
Kim
e,
David J.
Fermin
b and
Salvador
Eslava
*ac
ab,
Santosh
Kumar
ac,
Veronica
Celorrio
d,
Min Su
Park
e,
Jong Hak
Kim
e,
David J.
Fermin
b and
Salvador
Eslava
*ac
aDepartment of Chemical Engineering, University of Bath, Bath, BA2 7AY, UK
bSchool of Chemistry, University of Bristol, Cantock's Close, Bristol, BS8 1TS, UK
cDepartment of Chemical Engineering, Imperial College London, SW7 2AZ London, UK. E-mail: s.eslava@imperial.ac.uk
dDiamond Light Source Ltd., Diamond House, Harwell Campus, Didcot, OX11 0DE, UK
eDepartment of Chemical and Biomolecular Engineering, Yonsei University, Seoul 03722, South Korea
First published on 26th November 2019
Abstract
Renewable and sustainable alternatives to fossil fuels are needed to limit the impact of global warming. Using metal oxide semiconductors as photoelectrodes within photoelectrochemical cell devices, in which solar energy can be stored and ultimately used for electricity generation, is one such alternative. LaFeO3 (LFO) has been shown to be an active photocathode in the illumination of visible light but is restricted by a low surface area and relatively low photocurrents achieved. The work herein utilizes a spin coating deposition method with a solution of nitrate precursors combined with a non-ionic polymeric surfactant (Triton X-100). This allowed for the formation of a uniform porous LFO film of high coverage on a fluorine-doped tin oxide-coated substrate by directing the growth and preventing particle aggregation during film fabrication. These porous LFO films achieved an enhanced photocurrent of −161 ± 6 μA cm−2 at +0.43 VRHE, in addition to a remarkably high onset potential of +1.4 VRHE for cathodic photocurrent. It was additionally shown that the attained film quality and activity were superior to those of other film fabrication methods such as doctor blading and spray pyrolysis. With this polymer templating method for LFO films, not only are higher photocurrents achieved but there are also added benefits such as better charge separation, higher efficiencies, higher specific electrochemically active surface area, and improved stability.
Introduction
Due to the ongoing overreliance on the burning of non-renewable fossil fuels coupled with the harmful emission of greenhouse gases, there is a great need to explore clean energy alternatives. Photoelectrochemical (PEC) processes seem to be a promising substitute as they are able to convert solar energy into electricity or solar fuels. One such example of this is PEC solar water splitting, which uses solar energy to split water into its components O2 and H2.1 This hydrogen can then be used within the fuel cells, where electricity can be generated, or simply burnt as fuels, which avoids current sources of H2 production such as methane steam reforming. Hence, this is a promising clean alternative to burning carbon-based fuels for our growing energy demands.2PEC water splitting can be achieved through the use of metal oxide semiconductors that are able to generate photoexcited electron–hole pairs, which was first demonstrated by Fujishima and Honda with TiO2.3 However, metal oxides used for water splitting have been shown to have limitations such as poor light absorption, high electron–hole recombination, and poor carrier collection. For example, TiO2 and SrTiO3 have wide band gaps that provide a suitable band edge position for water electrolysis potentials but are not optimal for visible light absorption.4 Further development is especially needed for finding efficient stable p-type photocathode materials in order to avoid the use of Pt electrodes, which are expensive and do not exhibit any beneficial photo-response.
Oxide semiconductors in particular seem promising for hydrogen generation, especially from an environmental perspective.5 Such examples of current cathodic semiconductors include Cu2O and CuO, which are limited by poor photostability,6–8 but have been studied in great detail.9 Advances have been made for increasing the stability of Cu2O films by incorporating conformal TiO2 protection layers.10,11 However, any failure in such a coating can lead to fast electrode corrosion; thus, dimensionally stable absorbers are more suitable for large scale PEC systems.
Perovskite compounds (ABX3) have become increasingly popular due to their activity for a wide range of photochemical processes such as that in solar cells,12 dye degradation,13 and water splitting.14 The most notable example of this is that of organolead trihalide compounds (e.g., CH3NH3PbI3−xClx), which have shown to be inexpensive and highly efficient in hybrid solid-state solar cells.15 However, they are limited due to issues of stability, especially in the presence of water, and the toxicity of lead compounds.16 Hence, attention can be directed towards perovskite oxides for PEC solar water splitting that are stable in water. Further benefits of oxide-based perovskites include abundance of starting materials and high levels of structural flexibility. Perovskite oxides such as Rh–SrTiO3,17 Rh–BaTiO3,18 and Bi–NaTaO3 (ref. 19) have all demonstrated photocatalytic activity for H2 evolution, yet they require metal doping to achieve visible light absorption due to inherently large band gaps.
Ferrite perovskites look more promising for PEC processes due to smaller band gaps and consequent increased light absorption within the visible light region. BiFeO3 (BFO) has a band gap of 2.3 eV and has shown, on doping with Gd, an increased activity for the photocatalytic degradation of rhodamine B.20 BFO has shown some interesting properties as a solar absorber in solar cells, with a photoconversion efficiency close to 4% in a BFO/ZnO heterojunction photovoltaic device.21 Bare BFO studied as a photocathode produced a photocurrent of −4 μA cm−2 at 0 VNHE with simulated sunlight, which was increased on the addition of Ag to −70 μA cm−2.22 Xu et al. obtained higher photocurrents of up to −60 μA cm−2 with bare BFO using a 150 mW cm−2 visible lamp.23 Studied as a photoanode, it showed an activity of +170 μA cm−2 at +1 VAg/AgCl for water oxidation.24,25 This bi-polar p and n-conductivity is understood to be due to the large Bi3+ ions inducing strain that has a strong impact on the electronic structure.26 Ferrite perovskites that contain smaller A site ions such as La3+ can help to minimize such strain and dictate singular p-type behavior.
LaFeO3 (LFO), with a band gap between 2.1 and 2.6 eV, has shown activity for dye degradation27 and as a p-type photocathode for oxygen and water reduction.28–31 LFO has been successfully doped with metals to achieve increased photocurrent. The photocurrent achieved for undoped LFO was recorded to be −10 μA cm−2 at −0.25 VAgCl under simulated sunlight (100 mW cm−2) and increased to approximately −50 μA cm−2 on doping with 5% Mg, with O2-purged electrolyte.32 Wheeler et al. prepared electrodeposited LFO films and achieved a photocurrent density of −100 μA cm−2 at +0.73 VRHE with O2-saturated electrolyte, under simulated sunlight (100 mW cm−2).33 In a more recent work, the same author demonstrated that with K doping, LFO photocathodes of high porosity were able to achieve −268 μA cm−2 at +0.6 VRHE, when compared with −124 μA cm−2 for pristine LFO in O2 purged electrolyte.34 LFO films prepared by pulsed laser deposition (PLD) exhibited photocurrent values of −65 μA cm−2 at 0 VRHE under simulated sunlight (100 mW cm−2) in oxygen-containing electrolyte solutions.35 LFO films deposited by spray pyrolysis demonstrated a photocurrent density of −160 μA cm−2 at +0.26 VRHE under simulated sunlight (100 mW cm−2) and O2 containing solution.36 To the best of our knowledge, this is the highest recorded activity for a pristine LFO film. Additionally, there is a case where LFO has been reported as an n-type photoanode for water oxidation where, on 10% doping of Cu, a photocurrent density of +0.99 mA cm−2 was observed.37
It appears from previous works that there are some limitations in the use of LFO electrodes for PEC applications that limit the advancement of this material towards commercial PEC devices. There is a reported restriction in the mobility of photogenerated charge carriers and a low overpotential for oxygen evolution reaction, which suggests that this reaction is in competition with hole collection at the back contact, thus reducing the photocurrent conversion efficiency for H2 generation.31 Recent work has been done in avoiding this detrimental hole transfer to the electrolyte in LFO films by incorporating a TiO2 blocking layer.38 It is also important to consider the role that the thickness of LFO films have on PEC properties. For instance, it has been shown that with increasing film thickness, a shift from oxidative to reductive behavior is observed due to differing band offsets.39 Another limitation of LFO photocathodes is the apparent sensitivity to particle sintering during the high temperature required for calcination (>500 °C), resulting in reduced active surface areas, which in turn can have a detrimental effect on the photoactivity.40 This has been alleviated somewhat in particles for dye degradation with templating on reduced graphene oxide (rGO)41 and montmorillonite42 but similar approaches remain unexplored for film preparation. In any case, improvements in film quality are needed to allow for higher surface area LFO to enhance the photocatalytic activity, with additional considerations in relation to the prevalence of competitive PEC processes.
The incorporation of polymer templating has been previously used to increase the quality of some films by directing particle growth and reducing particle sintering upon film fabrication. This is achieved through selective binding of metal oxide precursors and formation of nano-size micelle structures. It has been demonstrated to be a valuable technique with metal oxides such as TiO2 (ref. 43) and Fe2O3.44 A graft copolymer poly(vinyl chloride)-graft-poly(oxyethylene methacrylate) (PVC-g-POEM) has been dispersed with metal oxide precursors to act as a template on calcination upon a glass substrate.45 After high temperature calcination, the polymer is removed, resulting in a highly porous uniform metal oxide structure. It has also been previously used to template SnO2 (ref. 46) and MgTiO3 (ref. 47) films. A further example of polymer templating is the use of a non-ionic polymeric surfactant Triton X-100 that has been used in LFO and YFeO3 film preparation.32,48
After surveying previous works, it has been demonstrated that LFO is active for water reduction reaction under illumination of visible light but currently exhibits very low photocurrents in a majority of cases. This appears in part due to low surface area and poor electronic properties, with limited studies investigating the PEC properties of these perovskite films. More specifically, the quality and appearance of films is rarely, if ever, discussed. Hence, we suggest that further study into the activity of LFO films for PEC water reduction is needed with a greater focus on film preparation methods and how this affects the microstructure. With the application of a variety of different film preparation techniques, it can be established as to what role this plays on film quality and ultimate PEC activity.
In this paper, we present a film deposition method involving the use of a polymer template (Triton X-100) with LFO precursors, deposited through spin coating that demonstrates photocurrent responses as high as −161 ± 6 μA cm−2 at +0.43 VRHE, in addition to a high onset potential of +1.4 VRHE for this cathodic photocurrent. On comparing this to other preparative techniques such as doctor blading and spray pyrolysis, there is a drastic increase in the film quality and coverage. Doctor blading and spray pyrolysis of LFO, despite being optimized, resulted in limited photocurrent, thus highlighting the benefits of using a polymer template together with a spin-coating process to ensure higher quality films with enhanced photocurrent. It was also found that on polymer templating, there was a faster rate of charge extraction and higher incident photon-to-current efficiency (IPCE), which contributed to the increased photocurrents observed.
Experimental
Sol–gel synthesis of LaFeO3 powders
3 g La(NO3)3·6H2O and 2.8 g Fe(NO3)3·9H2O were added to 5.3 g citric acid (1![[thin space (1/6-em)]](https://www.rsc.org/images/entities/char_2009.gif) :1:4) in 100 mL distilled H2O. This was then stirred for 48 h. The solution was then placed at 100 °C in an oven overnight to dry. The dried powder was then ground and pre-calcined at 500 °C for 2 h, and then calcined at 600 °C for 4 h.
:1:4) in 100 mL distilled H2O. This was then stirred for 48 h. The solution was then placed at 100 °C in an oven overnight to dry. The dried powder was then ground and pre-calcined at 500 °C for 2 h, and then calcined at 600 °C for 4 h.
Milling and exfoliation of LaFeO3 powders
The prepared LaFeO3 powders were first placed in a sealed 100 mL glass sample bottle containing approximately 10 g of 2 mm alumina beads. This was then placed on a rolling mill for 24 h. The ground LaFeO3 was then exfoliated by sonicating with dimethylformamide (DMF) at a concentration of 1.46 g L−1 for 72 h and subsequently left to settle for 48 h.Film fabrication using doctor blading (LFO-A)
0.16 g of the LFO powder sample was added to 0.45 g of 10% ethyl cellulose in ethanol, 0.65 g terpineol, and 0.8 mL ethanol. This was stirred and sonicated for a total of 3 times. These were then gently heated on a hotplate to half the original volume (16.8 wt% suspension). These pastes were then coated onto fluorine-doped tin oxide coated aluminoborosilicate (FTO–ABS) glass (Solaronix, CH) via a doctor blading method. These films were then annealed at an optimized temperature of 700 °C for 2 h. The deposition was carried out twice for an optimized photocurrent. These films were named LFO-A.Film fabrication using spray pyrolysis (LFO-B and LFO-C)
The supernatant obtained after exfoliation and sedimentation of the milled LaFeO3 powder was transferred into a small glass container attached to a Clarke airbrush gun. This solution was then sprayed onto an FTO–ABS glass slide at an approximate distance of 10 cm, situated on a hotplate set to 200 °C to evaporate the DMF. This was done using several up and down motions moving from left to right along the glass up to 10 times. The resulting films were then annealed at 600 °C for 2 h. The deposition was carried out twice for an optimized photocurrent. These films were named LFO-B.Alternatively, 2.8 g La(NO3)3·6H2O and 3 g Fe(NO3)3·9H2O were added to 5.3 g citric acid (1:1:4) in 100 mL distilled H2O. This was then stirred for 48 h. The solution was then sprayed onto an FTO–ABS glass using several up and down motions moving from left to right along the glass up to 10 times. The resulting films were then annealed at 600 °C for 2 h. The deposition was carried out twice for an optimized photocurrent. These films were named LFO-C.
Film fabrication using spin coating with Triton X-100 (LFO-D)
A solution was prepared of 1 mL Triton X-100 polymer and 1 mL tetrahydrofuran (THF). Another solution was prepared using 0.2 g La(NO3)3·6H2O, 0.19 g Fe(NO3)3·9H2O, and 0.35 g citric acid in 0.5 mL deionized water. These solutions were then stirred overnight, combined, and stirred further for 24 h. FTO–ABS glass was attached using double sided tape onto a spinning disk controlled using a small motor. 0.1 mL of the polymer/nitrate solution was then dropped onto the glass substrate, evenly covering the slide. The motor was then set to 4000 rpm for 30 s to produce a thin film. This was then left to air dry. The film was then annealed at 500 °C for 20 min to remove the polymer and then heated to an optimized 600 °C for 2 h to form the perovskite film (3.8 °C min−1). The deposition and calcination were carried out three times for an optimized photocurrent. These films were named LFO-D.PEC measurements
PEC measurements were carried out in a three-electrode PEC quartz cell with a working electrode, a Pt counter electrode, an Ag/AgCl reference electrode, and a 0.1 M Na2SO4 electrolyte of pH 12. A 300 W Xe lamp equipped with an AM1.5G solar simulator filter (LOT Quantum Design) was used with a 6 mm-diameter masked area. The intensity was measured to be 100 mW cm−2, as determined by the distance to the working electrode (these irradiation conditions are herein referred to as “1 sun”). An external potential (provided by Ivium CompactStat) was linearly swept from +0.2 to −1.12 VAg/AgCl at a rate of 20 mV s−1 under chopped illumination. The standard deviations of the photocurrents (represented with ±) were calculated out of more than 5 samples with mean values stated.Electrochemical impedance spectroscopic (EIS) measurements for RC limited current calculations were carried out in 0.1 M NaSO4 with a DC of −0.3 VAgCl and AC potential frequency range of 105–0.1 Hz with an amplitude of 5 mV under dark conditions. Experimental transient photocurrents were obtained under chopped illumination (1 sun) at −0.3 VAgCl with a data collection interval of 0.01 s. These were then compared with the RC limited photocurrent calculated from the general expression.49
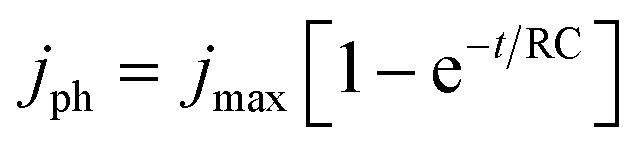 | (1) |
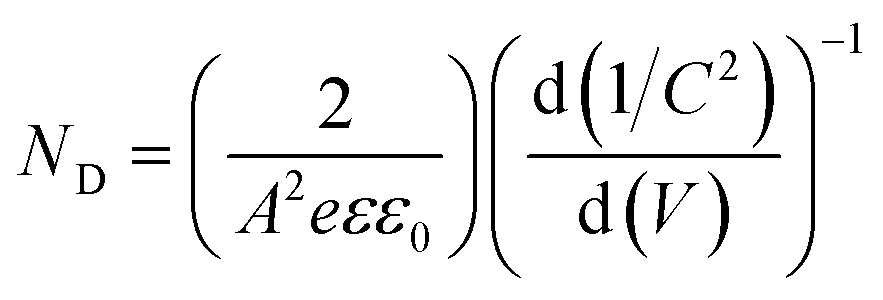
Electrochemically active surface area (ECSA) measurements were carried out by conducting cyclic voltammetry (CV) between +0.2 to −0.3 VAgCl at varying scan rates between 10 and 250 mV s−1. The difference in the anodic and cathodic current densities recorded at −0.03 VAgCl was plotted against the scan rate. The double layer capacitance (Cdl) can be calculated by dividing the gradient by two, where Cdl is directly proportional to the ECSA:
 | (2) |
EIS measurements were carried out at different potentials under dark conditions to obtain Mott–Schottky plots. These were carried out at fixed frequencies of 10, 100, and 1000 Hz using the following equation:
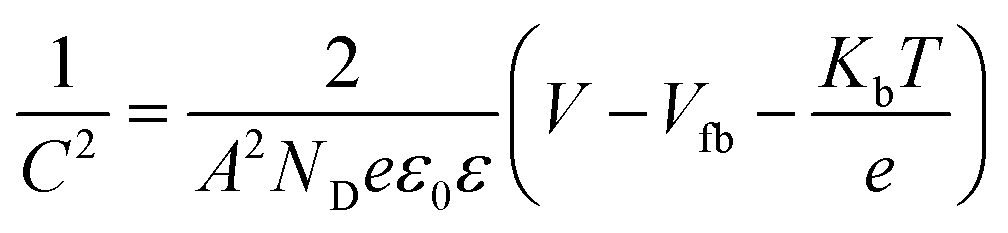 | (3) |
 | (4) |
H2 generation measurements
H2 generation measurements were carried out in a gas-tight single PEC cell with a Pt counter electrode and an Ag/AgCl reference electrode. The cell was purged with N2 for 30 min to expel atmospheric oxygen. The working electrode (LFO) was illuminated with simulated solar light at 1 sun (100 mW cm−2) for 6 h at a potential of −0.48 VAgCl. The gases accumulated in the headspace were measured using gas chromatography and a closed circuit, where the gases were re-circulated with a peristaltic pump.Physical characterization
UV-Vis spectroscopy was conducted using a Cary Series UV-Vis spectrometer evaluating the F(R) functional for wavelengths between 200 and 800 nm. High-resolution transmission electron spectroscopy (HR-TEM) micrographs were acquired using a JEM-2100Plus microscope with 200 kV maximum operating voltage. Field-emission scanning electron microscopy (FE-SEM) micrographs were obtained using a JEOL 6301F, with an acceleration voltage of 5 keV. X-ray diffraction (XRD) patterns were obtained from a STOE STADI P double setup, equipped with Mythen detectors, using pure Cu-Kα1 radiation (λ = 1.540562 Å) with a range of 2θ from 20 to 80°. X-ray photoelectron spectra (XPS) were taken on a Kratos Axis Ultra DLD system using monochromatic Al Kα X-ray source operating at 150 W (10 mA × 15 kV). Gas chromatographic (GC) measurements were conducted on a Shimadzu Nexis GC-2030.Results and discussion
LaFeO3 (LFO) was first synthesized through sol–gel synthesis with citric acid as the chelating agent. La(NO3)3·6H2O, Fe(NO3)3·9H2O, and citric acid (1:1:4) were combined in deionized water, stirred, and dried overnight. It was then calcined at 500 °C for 2 h to remove any organic material and then at 600 °C for 4 h. HR-TEM micrographs were obtained and demonstrated aggregated particles of 30 nm size (Fig. S1 ESI†). UV-Vis spectroscopy was also conducted to determine the band gap of the synthesized LFO by creating a Tauc plot from the Kubelka–Munk function (Fig. S2†). A band gap of 1.9–2.1 eV was found, assuming direct optical transitions, which is within previously published values20,21 and encompasses the visible-light region of the solar spectrum. LFO thin-film electrodes were then fabricated by dispersing these powders in a solution of ethyl cellulose, terpineol, and ethanol. This was then deposited onto FTO–ABS glass through doctor blading (LFO-A). The application of 2 layers was found to be optimal to achieve the highest photocurrent. Powder XRD confirmed crystalline LFO with high phase purity present on the glass substrate, with all diffraction peaks consistent with this perovskite structure (Fig. 1).
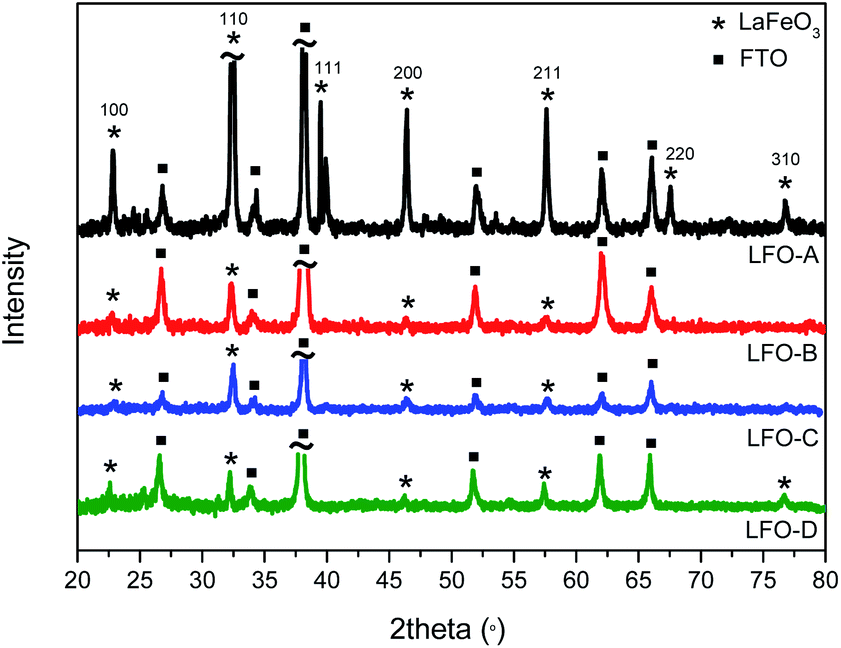 | ||
| Fig. 1 X-ray diffraction pattern of LFO films (LFO-A, B, C, and D). | ||
FE-SEM micrographs of these LFO-A films were obtained, which showed a distinct lack of coverage between the LFO particles and the conductive FTO through the presence of micrometer-sized particles and large areas of exposed FTO (Fig. 2a). It appears that doctor blading of the LFO powders has failed to produce a desired uniform and well-covered film despite two coatings. Vast improvements in the contact and coverage of the LFO particles to the FTO–ABS substrate are required to achieve a higher quality film. Hence, a reduction in the particle size of the powders and increase in surface coverage and light absorption are needed.
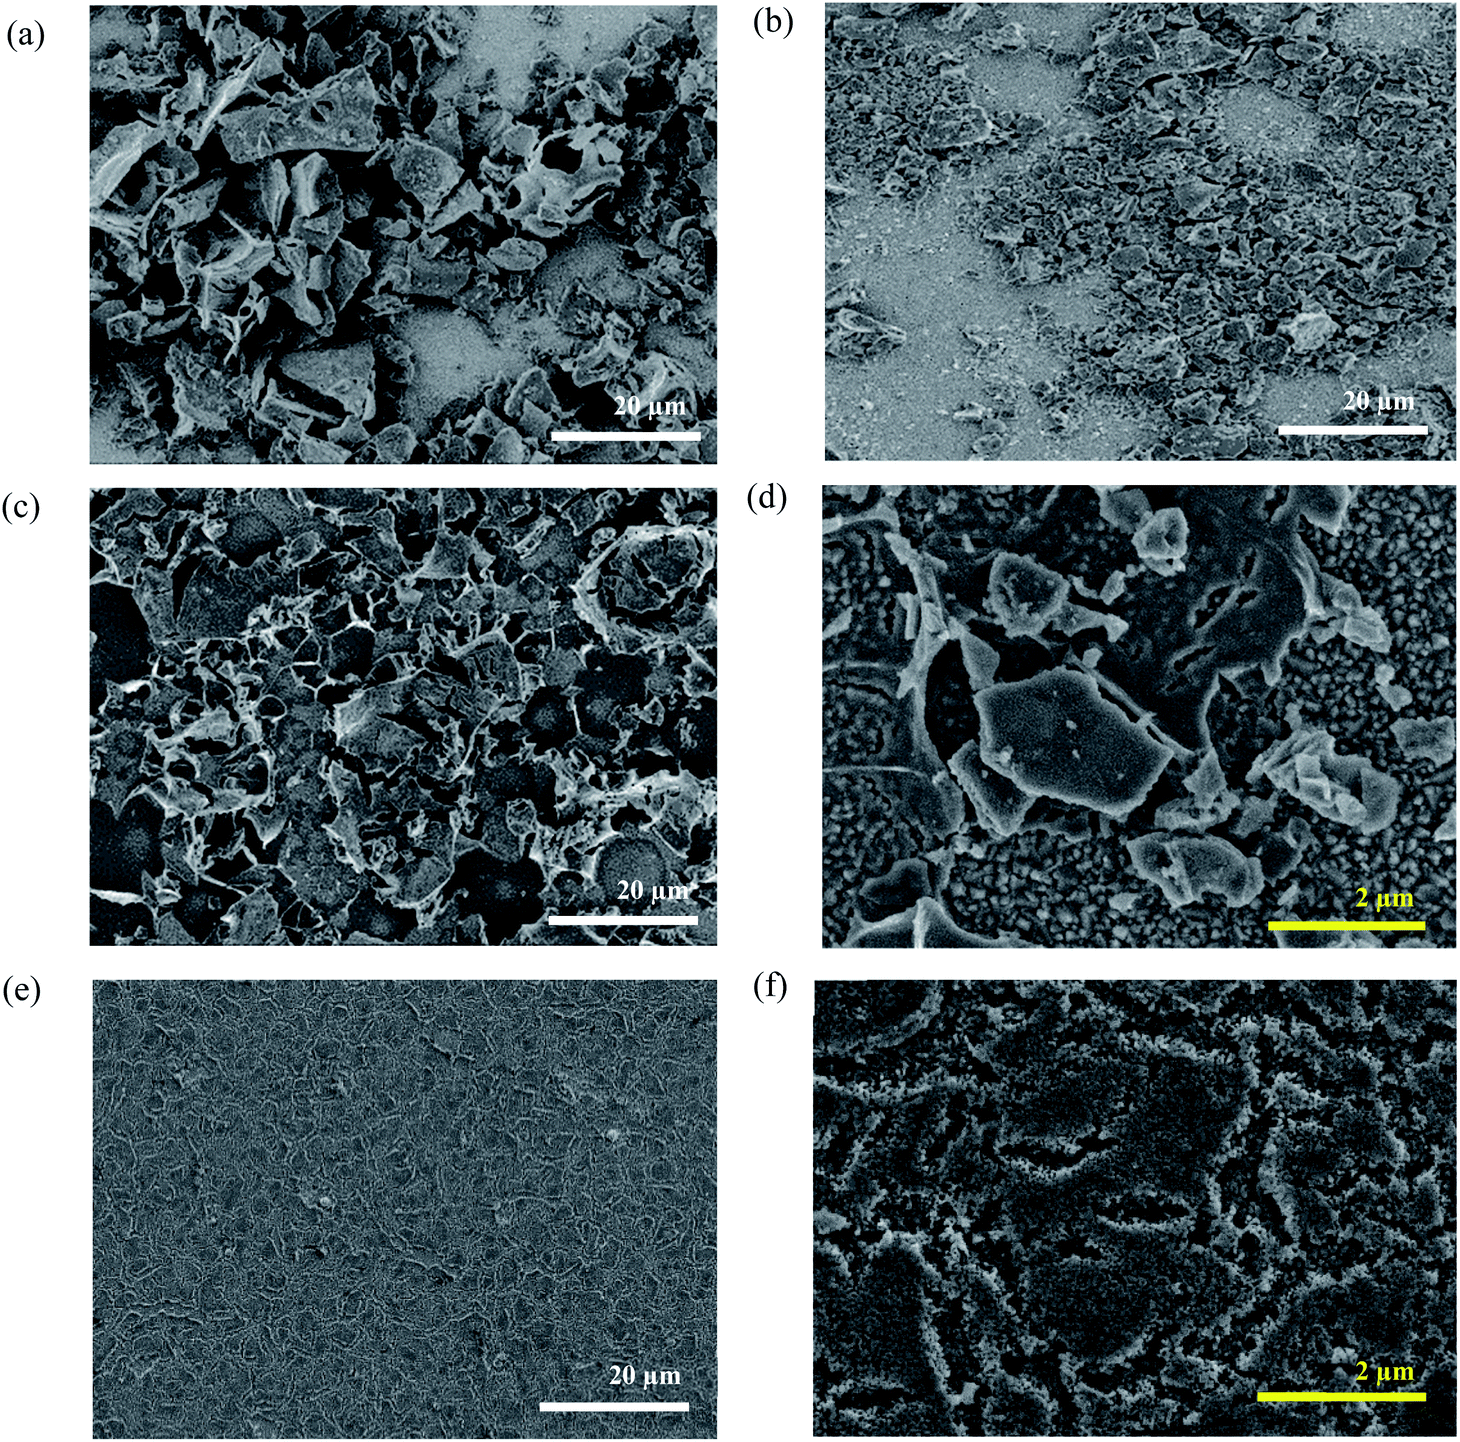 | ||
| Fig. 2 (a) FE-SEM micrographs of LFO films on FTO–ABS glass prepared through a doctor blading method LFO-A, (b) exfoliation and spray pyrolysis method LFO-B, (c and d) deposition of precursors using spray pyrolysis LFO-C, (e and f) spin coating with a polymer template (Triton X-100) LFO-D. | ||
Ball milling of the LFO powders with subsequent exfoliation through sonication in DMF was completed in order to shrink the particle size. The suspensions were then left to precipitate for 24 h, with the supernatant then being deposited using spray pyrolysis onto the FTO–ABS glass substrate (LFO-B) with 2 layers applied to reach an optimum photocurrent. This exfoliation and spray pyrolysis led to a grain size reduction from 20 μm to less than 5 μm, although significant portions of the FTO substrate remain uncovered (Fig. 2b). By reducing the particle sizes from approximately 10–20 μm to less than 5 μm, it enabled a higher surface area of the particles to be in contact with the FTO. However, despite the reduction in particle size, it was still noted that there was a continued low contact between the particles and the FTO in the LFO-B prepared films, in part due to incomplete coverage on the substrate. XRD confirms the presence of LFO (Fig. 1). Alternate fabrication methods can be employed to attempt to increase this contact and coverage further in order to create a more optimized LFO film.
It has been previously shown that metal oxide films can be prepared through the calcination of precursor solutions upon the desired substrate,51 forming the nanoparticles directly on the FTO. This can assist in enhancing contact between the metal oxide particles and the conductive back contact of the substrate. This process also reduces the heating steps and hence minimizes opportunities for particle sintering. Therefore, in order to improve surface coverage, LFO films were also prepared through deposition of a solution of iron and lanthanum nitrates with citric acid in water onto FTO–ABS glass, using spray pyrolysis and then subsequently annealed at 600 °C to form LFO (LFO-C). XRD spectra confirm the formation of LFO directly onto the substrate (Fig. 1). The band gap of this film was calculated with IPCE measurements and was calculated to be 2.6–2.8 eV, assuming direct optical transitions (Fig. S3a and c†).
As seen from Fig. 2c, LFO-C offers some improvement in coverage compared with LFO-A (Fig. 2a) and LFO-B (Fig. 2b); however, at a higher magnification, there was a high proportion of FTO that is still uncovered (Fig. 2d). Additionally, there appeared to be a distinct irregularity in the film with some visible cracking on calcination. On burning off the organic elements within the precursor compounds, it resulted in this cracked appearance and prevented the formation of a single uniform thin film. However, due to the formation of LFO directly onto the FTO, it can be postulated that a better contact was established that potentially promoted enhanced charge transport.
As shown above, both doctor blading and spray pyrolysis methods failed to produce a desired high-quality film. It appears that the lack of direction for particle growth results in poor coverage and uniformity. The improvements in film quality can be achieved by incorporating polymer templating. Herein, solutions of iron and lanthanum nitrate precursors with citric acid were mixed with a non-ionic polymeric surfactant Triton X-100 in THF and stirred for 24 h so as to maximize favorable interactions between the polymer and the precursors. This polymer/precursor solution was then deposited onto FTO–ABS through spin coating, annealed at 500 °C for 20 min to burn off the polymer template and then for a further 2 h at 600 °C to form LFO. This was done for a total of three consecutive layers (LFO-D) to gain an optimal photocurrent. XRD confirmed the formation of LFO directly upon the substrate (Fig. 1). The Scherrer equation was used to calculate the coherent crystal domain size from the XRD spectra. This was determined to be 34 nm for LFO-D, which is smaller in size compared with LFO-A film, which has a domain size of 44 nm. LFO-B and LFO-C with a domain size of 35 and 30 nm, respectively, also showed smaller values compared with method LFO-A.
The FE-SEM micrographs obtained showed an outstanding improvement in film quality using polymer templating (Fig. 2e and f). In comparison to films LFO-A, B, and C (Fig. 2a–c), LFO-D shows a vast enhancement in uniformity with a marked avoidance of large sintered particles. This comparison highlights the superior advantages of using polymer templating with LFO nitrate precursors in terms of film quality. When considering LFO-C prepared films, large cracked particles were formed on the substrate; however, on addition of this polymer template, the formation of a single uniform porous layer was observed. Cross-sectional FE-SEM was also carried out to determine the film thickness on the application of 3 layers, which was 407 (±10) nm (Fig. S4†). IPCE measurements determined a band gap in the range of 2.4–2.9 eV, assuming direct optical transitions (Fig. S3b and d†).
Further characterization was completed on all the prepared LFO films using X-ray photoelectron spectroscopy (XPS). Fig. S5† displays the XPS spectra of all the LFO-A, B, C, and D films including that of La 3d, Fe 2p, and O 1s. Fig. S5a and b† show the binding energies corresponding to La 3d5/2 (834 eV), La 3d3/2 (851 eV), Fe 2p3/2 (710 eV), and Fe 2p1/2 (724 eV). Fig. S5c† corresponds to crystal lattice oxygen (OL) and hydroxyl oxygen (OH). The OL signal at 529 eV can be attributed to La–O and Fe–O contributions from the LFO crystal lattice. The second signal at 531 eV can be associated with hydroxyl groups arising from chemisorbed water. Table S1† shows La:Fe atomic ratios determined through CasaXPS fitting software that show ratios close to the desired 1:1 ratio for these LFO films.
PEC responses were then recorded for all the prepared LFO films within a three-electrode system in 0.1 M Na2SO4 electrolyte at pH 12 (adjusted with NaOH). Basic electrolyte was found to be optimal for a maximized photocurrent (Fig. S6†), while the use of acid electrolytes caused visible corrosion of LFO films, thus resulting in losses of activity. All the measurements were performed under a chopped simulated sunlight of 1 sun. LFO-A prepared through doctor blading of LFO powders was first tested. Fig. 3a shows that a very low photocurrent of −3 ± 1 μA cm−2 at 0 VRHE was achieved with two layers of LFO deposited (lower with one or three layers, not shown). This can be explained due to the heavy sintering of particles that allows for increased scattering and a reduced active surface area. Additionally, a large proportion of the glass substrate was not covered, despite two repeated deposited layers, which failed to utilize the total potential substrate area for active particles to absorb light and catalyze the water reduction (Fig. 2a). The deposition of more than two layers did not improve the photocurrents, so there are limitations associated with the large particles formed.
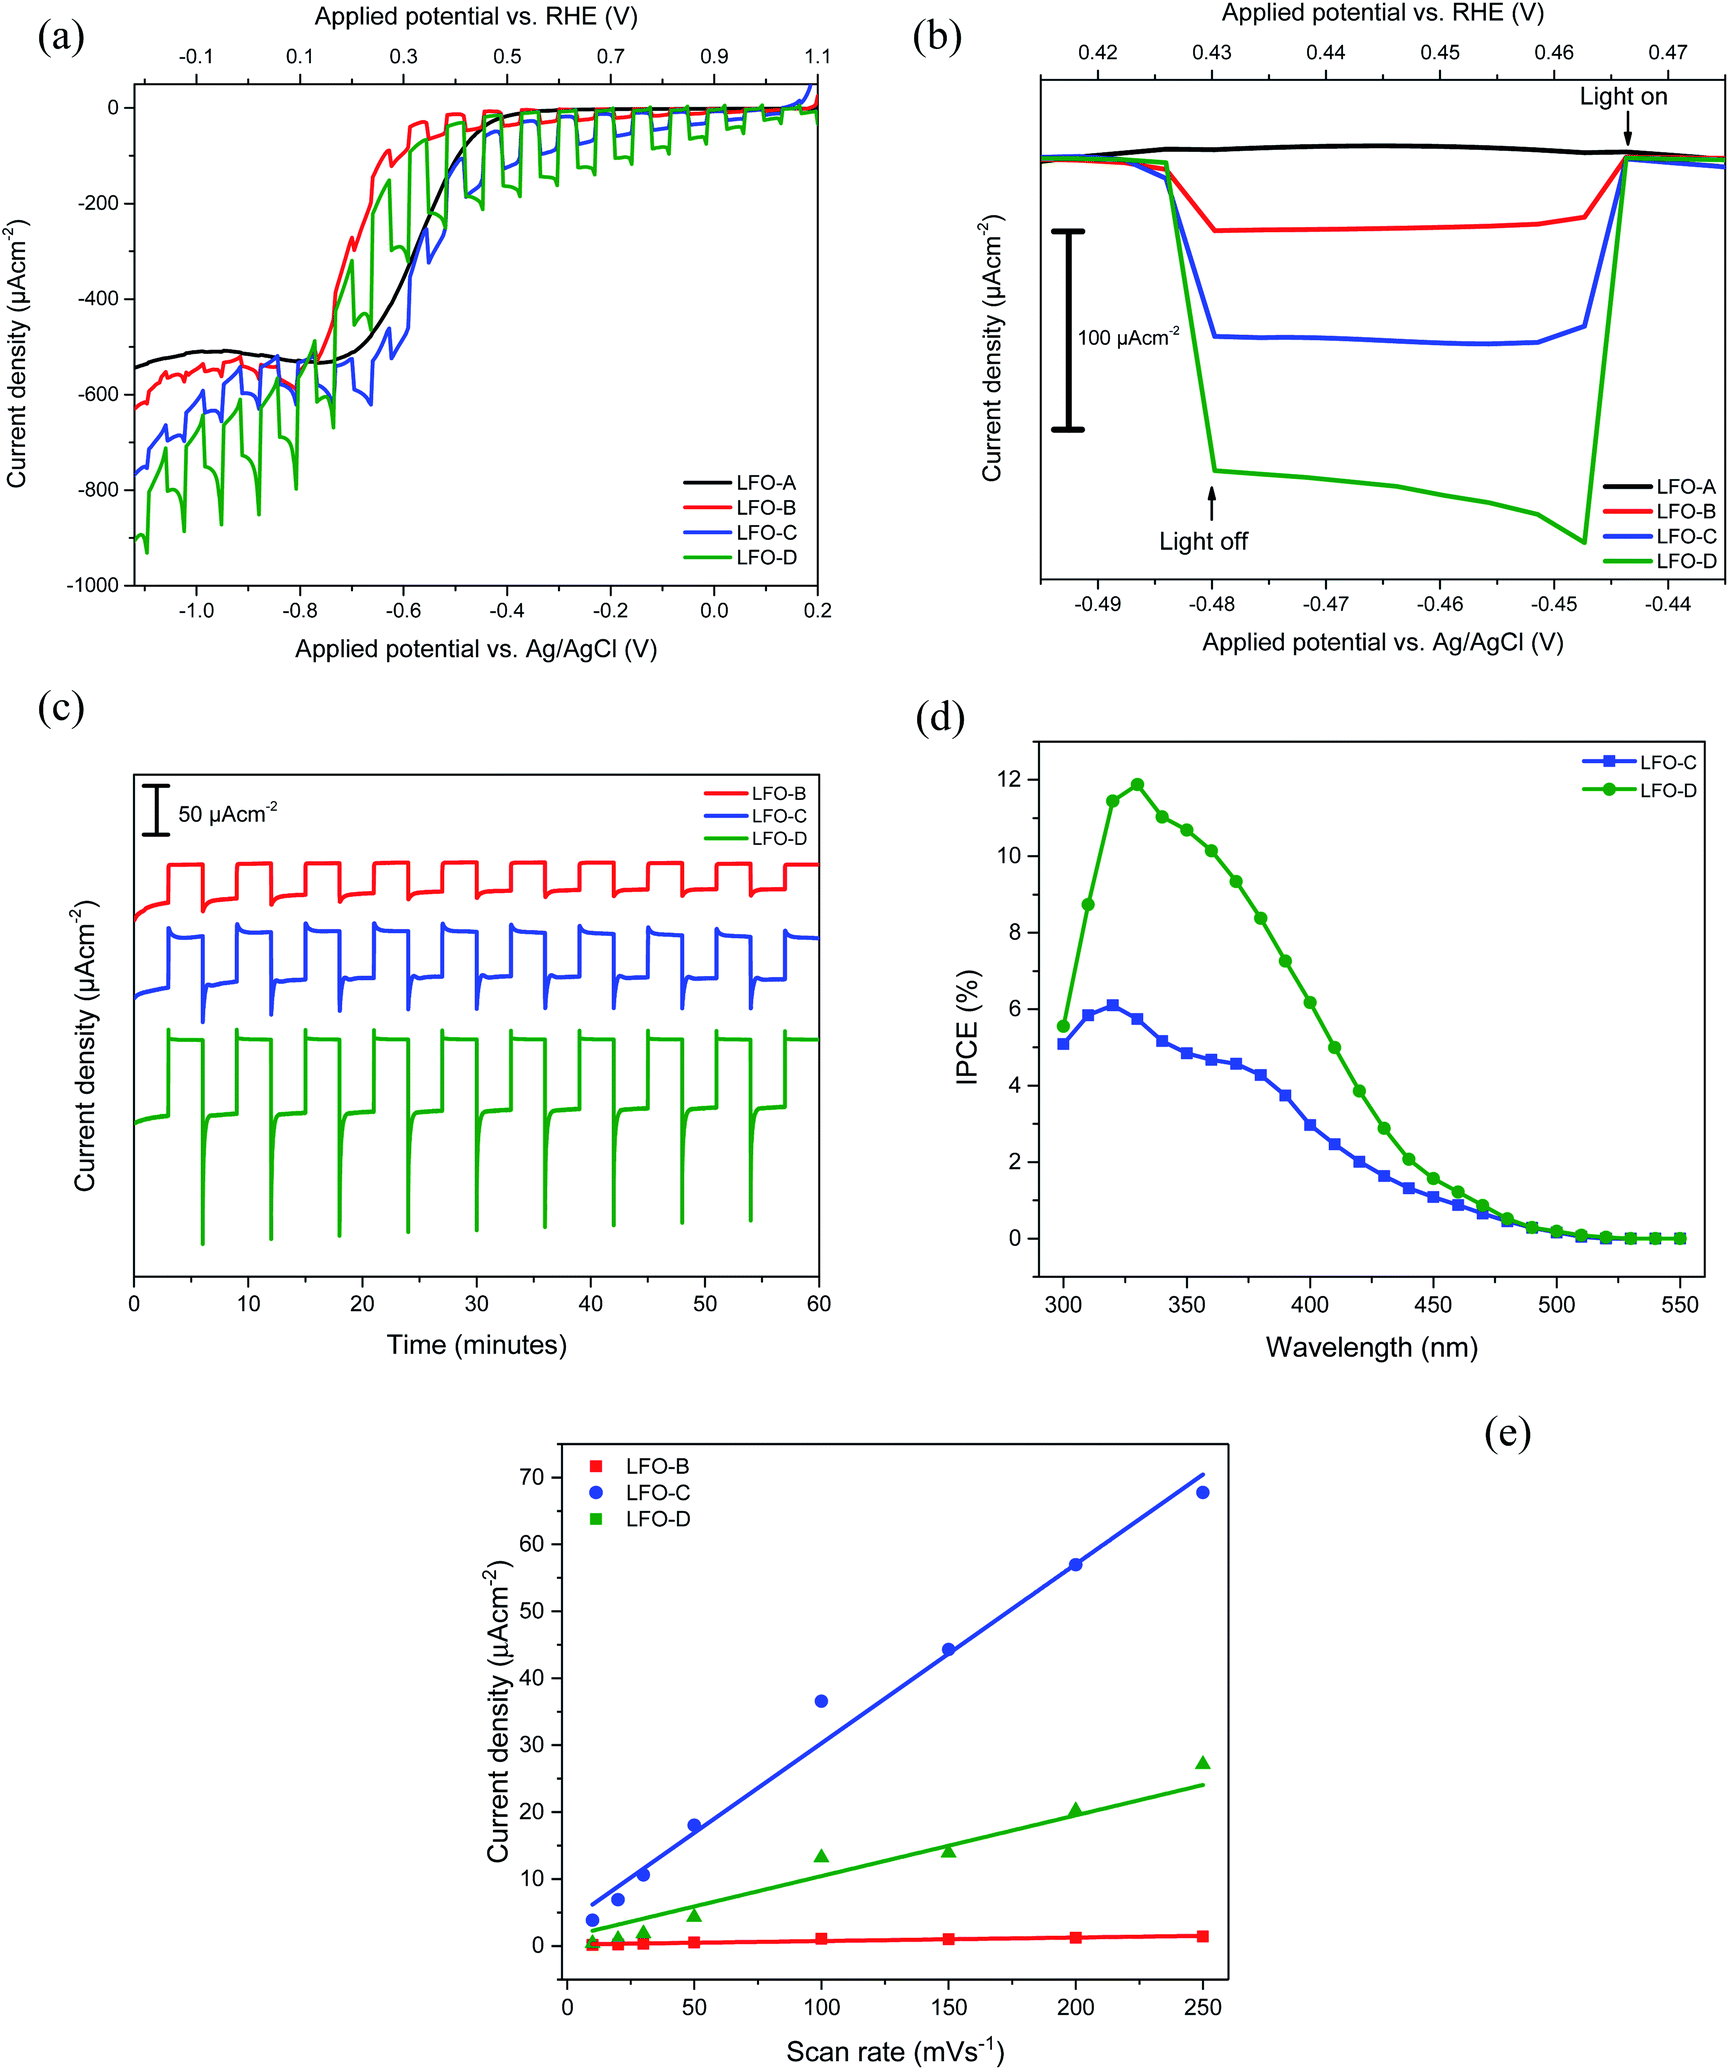 | ||
| Fig. 3 (a) Current–potential curves for LFO-A, B, C, and D under chopped simulated sunlight (AM1.5G, 100 mW cm−2) in pH 12 0.1 M Na2SO4. Linear sweep from 0.2 to −1.12 V at 20 mV s−1 and (b) normalized current–potential measurements from (a) at point of interest (+0.42 to +0.47 VRHE). (c) PEC stability measurements of films LFO-B, LFO-C, and LFO-D, held at +0.43 VRHE for 1 h. (d) IPCE measurements at +0.61 VRHE for LFO-C and LFO-D. (e) Current density vs. scan rate plots for films LFO-B, LFO-C, and LFO-D. | ||
The LFO-B films that were deposited through spray pyrolysis after milling and exfoliation of LFO powders displayed a superior photocurrent density of −37 ± 5 μA cm−2 at +0.43 VRHE for an optimal amount of two layers (Fig. 3b). No activity was recorded at this potential for the LFO-A prepared films. This superior activity can be attributed to the smaller particle sizes that allow for increased catalytic surface area to be in contact with the electrolyte (Fig. 2b). This would allow for greater charge transfer, resulting in a higher photocurrent. A stability study was also conducted under chopped simulated sunlight for 1 h at a constant potential of +0.43 VRHE. After a period of stabilization (15 min), there was a decrease in the photocurrent by 24% (Fig. 3c).
The LFO-C films prepared through spray pyrolysis of nitrates achieved a photocurrent density of −112 ± 10 μA cm−2 at +0.43 VRHE (Fig. 3b) with an 11% reduction in the photocurrent after 15 min of stabilization during 1 h chopped simulated sunlight at +0.43 VRHE (Fig. 3c). This photocurrent was achieved for an optimal amount of two deposited layers and decreased with three layers (Fig. S7a†). This is a large improvement in the photocurrent compared with LFO-A and LFO-B prepared films, with additional increased stability over 1 h. This can be attributed to better contact between the LFO and the FTO, resulting from the LFO being formed directly onto the substrate. Both cases detail the deposition of exfoliated powders (LFO-B) and the use of nitrate precursors (LFO-C) mentioned thus far are vast improvements on many literature photocurrent values for bare LFO films (around 10 μA cm−2).32,52
Finally, the LFO-D films incorporating polymer templating were tested for their photocurrent and photovoltage response. A superior photocurrent density of −161 ± 6 μA cm−2 was observed at +0.43 VRHE for three applied layers (Fig. 3a). One, two, and four applied layers gave lower photocurrent values of −73 ± 11, −144 ± 16, and −111 ± 9 μA cm−2 at +0.43 VRHE, respectively (Fig. S7b†). This photocurrent density achieved is a vast improvement on many comparable values in the literature (−10 μA cm−2 at −0.25 VAgCl under simulated sunlight at 1 sun)32 and close to the highest previously achieved photocurrent with simulated sunlight for pure LFO films (−160 μA cm−2 at 0.26 VRHE).36 This increase in the activity can be attributed to the improved coverage and quality of the film, allowing for better light exposure and greater extent of the LFO particles in contact with the electrolyte and the FTO surface, thus improving charge transfer. This enhanced photocurrent was accompanied by an increase in stability, with just 9% reduction in the photocurrent after a 15 min stabilization period during 1 h of chopped simulated sunlight at +0.43 VRHE (Fig. 3c). There is potential for increase in the stability to be made as part of future work, for example, with the incorporation of protection layers. A high onset potential of +1.4 VRHE for cathodic photocurrent can be noted for all these LFO films (Fig. S8†), much higher than the +0.5 VRHE typically obtained for Cu2O photocathodes.10 This indicates that the LFO films offer advantageous photovoltage over other typically studied photocathodes and suitable conduction band edge position for PEC water or oxygen reduction (the conduction band minimum has been previously estimated to be −0.5 VRHE).33 IPCE measurements were also carried out, which display efficiencies of up to 6% for LFO-C and 12% for LFO-D at +0.61 VRHE (Fig. 3d), thus highlighting the increase in efficiency of the LFO sample prepared with a polymer template. The integrated photocurrent density from these IPCE spectra using the solar spectrum (AM1.5G)53 was calculated to be −108 μA cm−2 for LFO-C and −168 μA cm−2 for LFO-D, which are slightly higher than the measured photocurrents of −71 μA cm−2 and −137 μA cm−2 for LFO-C and LFO-D at +0.61 VRHE, respectively, in Fig. 3a. Inaccuracies can arise due to differences between the solar spectrum used for the IPCE integration and the simulated sunlight obtained with a Xe lamp source and filter.54 It should also be noted that for LFO films, there is a photocurrent loss mechanism in the form of hole transfer to the electrolyte, where water oxidation can occur, resulting in major carrier losses and low efficiency.31 However, recent efforts have been made to reduce this effect for LFO films by incorporating a thin TiO2 hole blocking layer.38
PEC measurements of all the LFO samples exhibit a large dark current at potentials below +0.4 VRHE. This can be attributed to oxygen reduction on the areas of exposed FTO48 and on LFO.33 To demonstrate this, LSV was performed from +1 to −0.2 VRHE with chopped simulated sunlight for LFO-D with 0.1 M Na2SO4 at pH 12. The electrolyte was then purged with N2 for 4 h to minimize the presence of oxygen during measurement. A reduction in both the dark current and the sharp cathodic spikes were observed in this N2 purged system, along with a reduction in the photocurrent by 63%, thus confirming the effect of oxygen present (Fig. S9†). This demonstrates that oxygen acts as a sacrificial electron acceptor, thus resulting in an enhanced photocurrent.33,55 Such oxygen reduction activity has potential applications in fuel-free PEC cells that complete water oxidation and oxygen reduction to generate electricity.56
Electrochemically active surface area (ECSA) measurements were also carried out for LFO-B, LFO-C, and LFO-D to determine whether changes in the surface area occurred between the films. This was calculated by capacitive currents employing cyclic voltammetry at different scan rates (Fig. S10†). The gradient from current (at +0.88 VRHE) vs. scan rate plots is directly proportional to the ECSA (Fig. 3e). Analyzing Fig. 3e, the ECSA values obtained for LFO-B, -C, and -D were 0.003, 0.161, and 0.066 mF, respectively. Dividing these values by the actual weight of LFO on the photoelectrodes exposed to electrolyte, the specific ECSA found was 20, 153, and 440 mF g−1 for LFO-B, LFO-C, and LFO-D, respectively. The highest specific ECSA of LFO-D agrees with the polymer templating approach that leaves a very porous structure in the final LFO material upon its sacrificial use, as observed by FE-SEM in Fig. 2f.
To further understand the increased photocurrent and efficiencies seen on polymer templating, EIS measurements were carried out at +0.61 VRHE for the films LFO-B, LFO-C, and LFO-D in the dark, from which the RC time constant can be calculated using the resistance at high frequency and the capacitance at low frequency (Fig. 4a). RC values were determined to be 0.0021, 0.0178, and 0.00177 s for LFO-B, LFO-C, and LFO-D, respectively. This was then used to calculate the RC limited transients using eqn (1) (Experimental section), which can then be compared with the experimental transients to determine rise time. Slower rise times elude to an increased density of trap states, which slow down carrier collection and increase the probability of recombination.49 It was found that LFO-B has the slowest calculated rise time of 0.68 s compared with LFO-C and LFO-D with rise times of 0.35 and 0.13, respectively (Fig. 4b–d). LFO-C and LFO-D have faster rise times, suggesting faster charge extraction, thus resulting in higher photocurrents. This is in good agreement with IPCE measurements, showing that LFO-D has higher conversion efficiencies due to the better charge mobility.
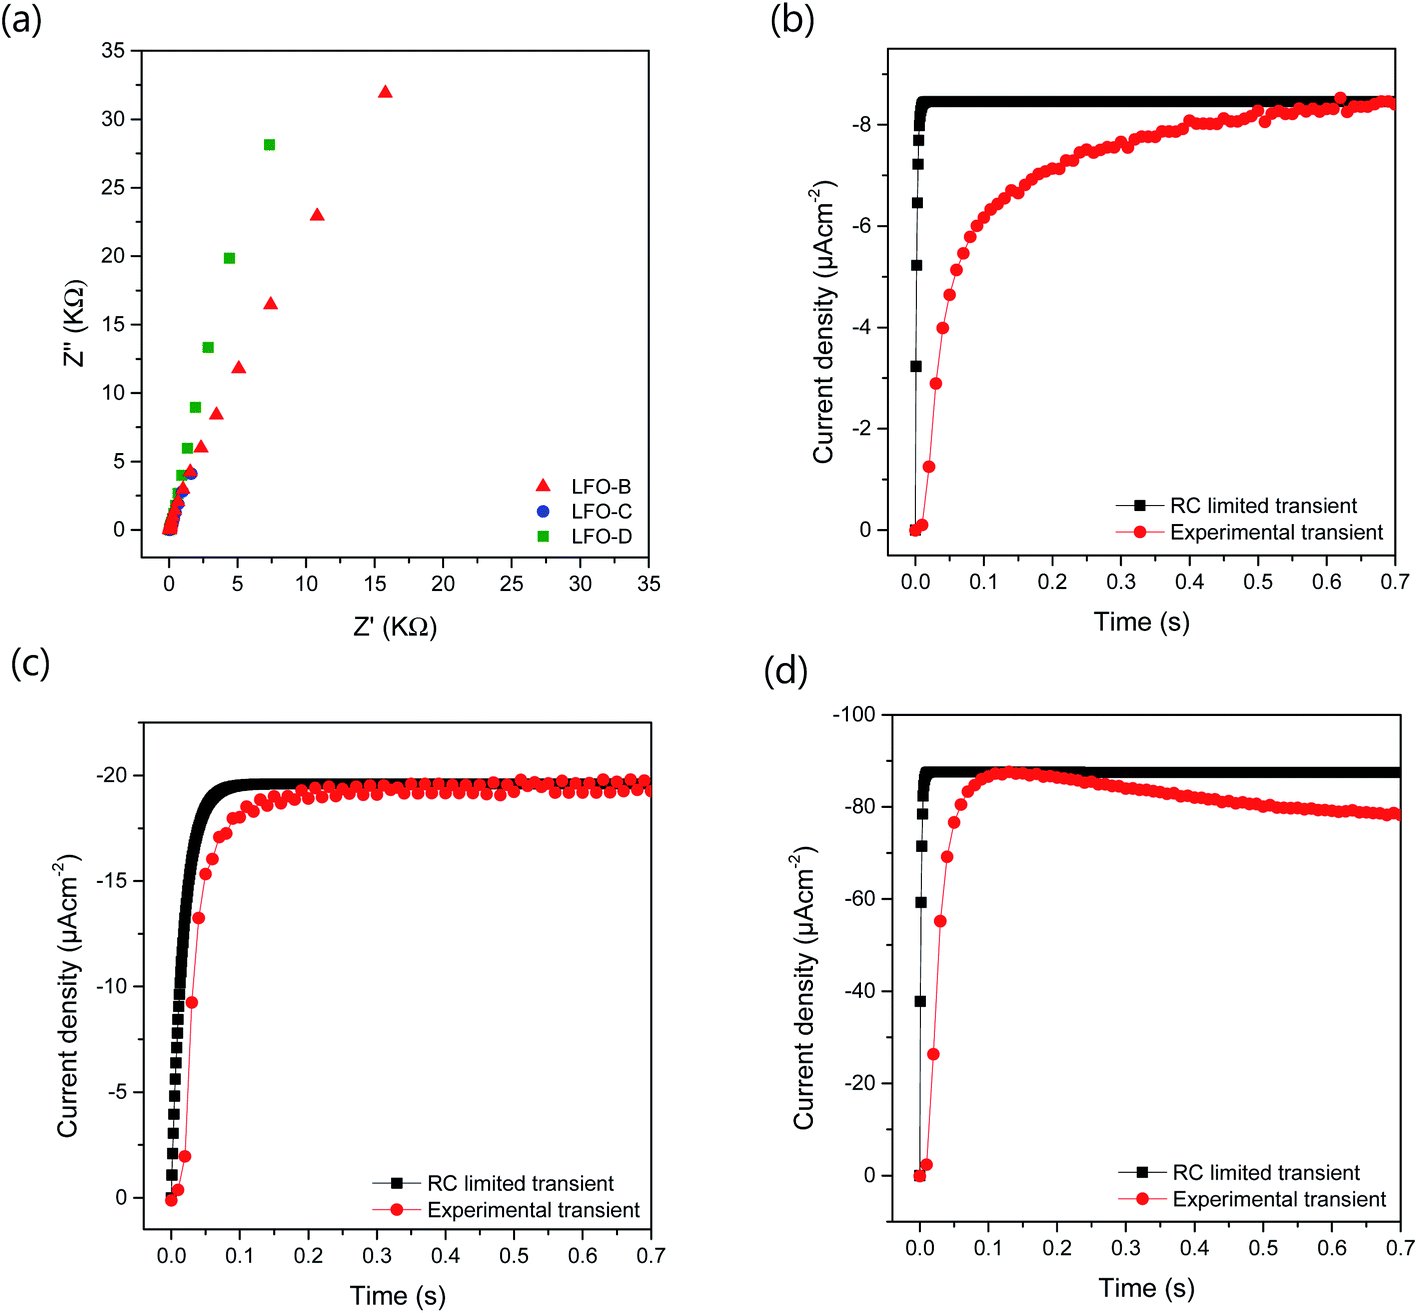 | ||
| Fig. 4 (a) EIS measurements used for RC calculations in 0.1 M NaSO4 with a DC of +0.61 VRHE and AC potential frequency range of 105–0.1 Hz with an amplitude of 5 mV under dark conditions. Experimental transient photocurrent plots from chronoamperometry measurements at +0.61 VRHE under chopped simulated sunlight with calculated RC limited transients for (b) LFO-B, (c) LFO-C, and (d) LFO-D. | ||
These EIS measurements were also used to create Mott–Schottky plots to be able to determine flat band potential (Vfb) and carrier density (ND) of these LFO films (Fig. S11a†). It was found that the Vfb for LFO-B, -C, and -D were +1.40, +1.55, and +1.36 VRHE, respectively, measured at 10 Hz. Together with the determined band gap of 2.4–2.9 eV, this shows that the LFO band alignments are suitable for water reduction and hence, it confirms the ability of these LFO films to generate hydrogen from water. Additionally, the carrier (hole) density was determined to be in the range of 1016 to 1017 cm−3 for LFO-B, -C, and -D. However, caution is needed when determining effective carrier density due to the large and uncertain permittivity of ferrites, and difficulties associated with porous electrodes.57 Actually, it was found that there was a strong frequency dependence for these LFO films in terms of Vfb and capacitance, thus displaying its deviation from an ideal capacitor (Fig. S11a and b†). Hence, equivalent circuits were not fitted.
Finally, these polymer-templated films (LFO-D) were tested for their ability to produce hydrogen from solar PEC water reduction. This was conducted using a single gas-tight cell with a Pt counter electrode and an Ag/AgCl reference electrode. The cell was first purged with N2 to ensure that pre-reaction oxygen from air was not in the cell. The working LFO electrode was subjected to constant illumination under simulated sunlight (1 sun) for 6 h with an applied potential of +0.43 VRHE, in which there is minimal dark current. During this time, a build-up of H2 was achieved within the headspace of the cell. The current was continuously collected and the light was chopped at intervals to confirm the practically null dark current (Fig. S12†). The gases within the headspace were analyzed using gas chromatography at 2, 4, and 6 h. Although pre-reaction oxygen from air was purged, oxygen evolved in the Pt counter electrode during the reaction also accumulated in the cell and its reduction could compete with proton reduction to H2. The amount of H2 measured was found to be ∼0, 0.08, and 0.09 μmol for 2, 4, and 6 h, respectively (0.05 μmol cm−2 h−1 measured over 6 h). A higher hydrogen evolution will require improved selectivity for hydrogen evolution reaction (HER), compared with oxygen reduction reaction (ORR), which could be attempted by adding HER co-catalysts and/or using an optimized H-shape PEC cell with separate oxygen evolution.
Conclusions
LaFeO3 photocathodes were prepared through a variety of fabrication methods on FTO–ABS glass and were tested for their photocatalytic activity in a photoelectrochemical cell. LaFeO3 was first synthesized through a sol–gel method and thin films were prepared through a doctor blading method for an optimal amount of two layers. This gave low activity (−3 ± 1 μA cm−2 at 0 VRHE) due to poor quality of the resulting films having large particles of reduced surface area and coverage. Ball milling and exfoliation of the powders, followed by spray pyrolysis were found to decrease the particle size, and improve the coverage and uniformity of the films, and with this, an increased photocurrent density of −37 ± 5 μA cm−2 at +0.43 VRHE for an optimal amount of two layers was observed. A further increase to −112 ± 10 μA cm−2 at +0.43 VRHE was demonstrated by directly depositing nitrates of LaFeO3 metals through spray pyrolysis, followed by calcination for an optimal amount of two layers. This allowed for better contact between the particles and the conductive substrate with minor improvements in film coverage. Ultimately, it was found that the most dramatic increase in the photoelectrochemical activity can be achieved by spin coating of metal oxide precursors combined with a non-ionic surfactant Triton X-100 template. This allows for high quality films with improved coverage, light exposure, and increased contact between the active LaFeO3 particles and the FTO for an optimal amount of three layers. Additionally, electrochemical impedance spectroscopic measurements showed that these templated films displayed faster rates of charge extraction. A photocurrent density of −161 ± 6 μA cm−2 at +0.43 VRHE was achieved for these templated LaFeO3 films in O2 containing electrolyte and an onset potential of +1.4 VRHE for this cathodic photocurrent. Photoinduced water reduction to H2 was confirmed, as well as oxygen reduction. This work demonstrates the importance of surface structure and morphology of thin film LaFeO3 electrodes, and their potential in photoelectrochemical applications such as water reduction. Future work will be directed to the addition of co-catalysts, metal dopants, and passivation layers so as to further enhance the activity of LaFeO3 for photoelectrochemical applications.Data access statement
All data created during this research are openly available from the University of Bath data archive at DOI: 10.15125/bath-00526.Conflicts of interest
The authors have no conflicts of interest to declare.Acknowledgements
The authors would like to thank EPSRC funding projects EP/P008097/1 and the EPSRC Centre for Doctoral Training in Catalysis EP/L016443/1. V. C. and D. J. F. kindly thank the UK Catalysis Hub for resources and support provided via the membership of the UK Catalysis Hub Consortium and funded by the EPSRC (EP/K014706/1 and EP/K014714/1). XPS data collection was performed at the EPSRC National Facility for XPS (‘HarwellXPS’), operated by Cardiff University and UCL, under contract No. PR16195. HR-TEM and FE-SEM micrographs were carried in the Department of Physics at the University of Bath by Ursula Potter and Philip Fletcher.References
- M. R. Pai, A. M. Banerjee, A. K. Tripathi and S. R. Bharadwaj, Fundamentals and Applications of the Photocatalytic Water Splitting Reaction, Elsevier Inc., 2012 Search PubMed.
- M. Winter and R. J. Brodd, Chem. Rev., 2004, 104, 4245–4269 CrossRef CAS.
- A. Fujishima and K. Honda, Nature, 1972, 238, 37–38 CrossRef CAS PubMed.
- Y. Yang, S. Niu, D. Han, T. Liu, G. Wang and Y. Li, Adv. Energy Mater., 2017, 1700555, 1–26 Search PubMed.
- K. Rajeshwar, J. Appl. Electrochem., 2007, 37, 765–787 CrossRef CAS.
- A. Paracchino, V. Laporte, K. Sivula, M. Grätzel and E. Thimsen, Nat. Mater., 2011, 10, 456–461 CrossRef CAS PubMed.
- W. Niu, T. Moehl, W. Cui, R. Wick-Joliat, L. Zhu and S. D. Tilley, Adv. Energy Mater., 2018, 8, 1–8 Search PubMed.
- S. Masudy-Panah, R. Siavash Moakhar, C. Sheng Chua, H. Ru Tan, T. It Wong, D. Chi and G. Kumar Dalapati, ACS Appl. Mater. Interfaces, 2016, 8, 1206–1213 CrossRef CAS PubMed.
- K. Rajeshwar, M. K. Hossain, R. T. Macaluso, C. Janáky, A. Varga and P. J. Kulesza, J. Electrochem. Soc., 2018, 165, H3192–H3206 CrossRef CAS.
- J. Luo, L. Steier, M. K. Son, M. Schreier, M. T. Mayer and M. Grätzel, Nano Lett., 2016, 16, 1848–1857 CrossRef CAS PubMed.
- C. G. Morales-Guio, S. D. Tilley, H. Vrubel, M. Grätzel and X. Hu, Nat. Commun., 2014, 5, 1–7 Search PubMed.
- D. Zhou, T. Zhou, Y. Tian, X. Zhu and Y. Tu, J. Nanomater., 2017, 2018, 1–15 Search PubMed.
- W. Wang, M. O. Tade and Z. Shao, Chem. Soc. Rev., 2015, 44, 5371–5408 RSC.
- J. Shi and L. Guo, Prog. Nat. Sci.: Mater. Int., 2012, 22, 592–615 CrossRef.
- G. E. Eperon, V. M. Burlakov, P. Docampo, A. Goriely and H. J. Snaith, Adv. Funct. Mater., 2014, 24, 151–157 CrossRef CAS.
- P. P. Boix, S. Agarwala, T. M. Koh, N. Mathews and S. G. Mhaisalkar, J. Phys. Chem. Lett., 2015, 6, 898–907 CrossRef CAS PubMed.
- K. Iwashina and A. Kudo, J. Am. Chem. Soc., 2011, 133, 13272–13275 CrossRef CAS PubMed.
- K. Maeda, ACS Appl. Mater. Interfaces, 2014, 6, 2167–2173 CrossRef CAS.
- P. Kanhere, J. Zheng and Z. Chen, Int. J. Hydrogen Energy, 2012, 37, 4889–4896 CrossRef CAS.
- S. Mohan, B. Subramanian, I. Bhaumik, P. K. Gupta and S. N. Jaisankar, RSC Adv., 2014, 4, 16871–16878 RSC.
- D. Tiwari, D. J. Fermin, T. K. Chaudhuri and A. Ray, J. Phys. Chem. C, 2015, 119, 5872–5877 CrossRef CAS.
- P. Yilmaz, D. Yeo, H. Chang, L. Loh and S. Dunn, Nanotechnology, 2016, 27, 345402 CrossRef CAS PubMed.
- H.-M. Xu, H. Wang, J. Shi, Y. Lin and C. Nan, Nanomaterials, 2016, 6, 215 CrossRef PubMed.
- S. J. A. Moniz, C. S. Blackman, P. Southern, P. M. Weaver, J. Tang and C. J. Carmalt, Nanoscale, 2015, 7, 16343–16353 RSC.
- S. J. A. Moniz, R. Quesada-Cabrera, C. S. Blackman, J. Tang, P. Southern, P. M. Weaver and C. J. Carmalt, J. Mater. Chem. A, 2014, 2, 2922–2927 RSC.
- C. Ederer and N. A. Spaldin, Phys. Rev. B: Condens. Matter Mater. Phys., 2005, 71, 224103 CrossRef.
- S. Thirumalairajan, K. Girija, V. Ganesh, D. Mangalaraj, C. Viswanathan and N. Ponpandian, Cryst. Growth Des., 2013, 13, 291–302 CrossRef CAS.
- S. N. Tijare, M. V. Joshi, P. S. Padole, P. a. Mangrulkar, S. S. Rayalu and N. K. Labhsetwar, Int. J. Hydrogen Energy, 2012, 37, 10451–10456 CrossRef CAS.
- Y. Soltanabadi, M. Jourshabani and Z. Shariatinia, Sep. Purif. Technol., 2018, 202, 227–241 CrossRef CAS.
- A. G. Margellou, I. T. Papadas, D. E. Petrakis and G. S. Armatas, Mater. Res. Bull., 2016, 83, 491–501 CrossRef CAS.
- V. Celorrio, K. Bradley, O. J. Weber, S. R. Hall and D. J. Fermín, ChemElectroChem, 2014, 1, 1667–1671 CrossRef CAS.
- M. I. Díez-García and R. Gómez, ChemSusChem, 2017, 10, 2457–2463 CrossRef PubMed.
- G. P. Wheeler and K. S. Choi, ACS Energy Lett., 2017, 2, 2378–2382 CrossRef CAS.
- G. P. Wheeler, V. U. Baltazar, T. J. Smart, A. Radmilovic, Y. Ping and K.-S. Choi, Chem. Mater., 2019, 31, 5890–5899 CrossRef CAS.
- Q. Yu, X. Meng, T. Wang, P. Li, L. Liu, K. Chang, G. Liu and J. Ye, Chem. Commun., 2015, 51, 3630–3633 RSC.
- G. S. Pawar and A. A. Tahir, Sci. Rep., 2018, 8, 1–9 CrossRef CAS PubMed.
- Q. Peng, B. Shan, Y. Wen and R. Chen, Int. J. Hydrogen Energy, 2015, 40, 15423–15431 CrossRef CAS.
- X. Sun, D. Tiwari and D. J. Fermin, J. Electrochem. Soc., 2019, 166, H764–H768 CrossRef CAS.
- K. J. May, D. P. Fenning, T. Ming, W. T. Hong, D. Lee, K. a. Stoerzinger, M. D. Biegalski, A. M. Kolpak and Y. Shao-Horn, J. Phys. Chem. Lett., 2015, 6, 977–985 CrossRef CAS PubMed.
- K. M. Parida, K. H. Reddy, S. Martha, D. P. Das and N. Biswal, Int. J. Hydrogen Energy, 2010, 35, 12161–12168 CrossRef CAS.
- X. Ren, H. Yang, S. Gen, J. Zhou, T. Yang, X. Zhang, Z. Cheng and S. Sun, Nanoscale, 2015, 8, 752–756 RSC.
- K. Peng, L. Fu, H. Yang and J. Ouyang, Sci. Rep., 2016, 6, 19723 CrossRef CAS PubMed.
- H. Fei, Y. Yang, D. L. Rogow, X. Fan and S. R. J. Oliver, ACS Appl. Mater. Interfaces, 2010, 2, 974–979 CrossRef CAS PubMed.
- A. M. El Sayed and W. M. Morsi, J. Mater. Sci., 2014, 49, 5378–5387 CrossRef CAS.
- D. J. Kim, J. K. Kim, J. H. Lee, H. H. Cho, Y.-S. Bae and J. H. Kim, J. Mater. Chem. A, 2016, 4, 12497–12503 RSC.
- J. T. Park, S. H. Ahn, D. K. Roh, C. S. Lee and J. H. Kim, ChemSusChem, 2014, 7, 2037–2047 CrossRef CAS PubMed.
- D. K. Roh, S. J. Kim, H. Jeon and J. H. Kim, ACS Appl. Mater. Interfaces, 2013, 5, 6615–6621 CrossRef CAS PubMed.
- M. I. Díez-García, V. Celorrio, L. Calvillo, D. Tiwari, R. Gómez and D. J. Fermín, Electrochim. Acta, 2017, 246, 365–371 CrossRef.
- Q. Zhang, V. Celorrio, K. Bradley, F. Eisner, D. Cherns, W. Yan and D. J. Fermín, J. Phys. Chem. C, 2014, 118, 18207–18213 CrossRef CAS.
- B. K. Kang, G. S. Han, J. H. Baek, D. G. Lee, Y. H. Song, S. Bin Kwon, I. S. Cho, H. S. Jung and D. H. Yoon, Adv. Mater. Interfaces, 2017, 4, 1–8 Search PubMed.
- C. Glynn and C. O'Dwyer, Adv. Mater. Interfaces, 2017, 4, 1600610 CrossRef.
- J. Yang, R. Hu, W. Meng and Y. Du, Chem. Commun., 2016, 52, 2620–2623 RSC.
- NREL, Reference Solar Spectral Irradiance: ASTM G-173, https://rredc.nrel.gov/solar//spectra/am1.5/ASTMG173/ASTMG173.html Search PubMed.
- Y. Li, N. Guijarro, X. Zhang, M. S. Prévot, X. A. Jeanbourquin, K. Sivula, H. Chen and Y. Li, ACS Appl. Mater. Interfaces, 2015, 7, 16999–17007 CrossRef CAS PubMed.
- M. S. Prévot, N. Guijarro and K. Sivula, ChemSusChem, 2015, 8, 1359–1367 CrossRef PubMed.
- B. Zhang, L. He, T. Yao, W. Fan, X. Zhang, S. Wen, J. Shi and C. Li, ChemSusChem, 2019, 12, 1026–1032 CrossRef CAS PubMed.
- A. Hankin, F. E. Bedoya-Lora, J. C. Alexander, A. Regoutz and G. H. Kelsall, J. Mater. Chem. A, 2019, 7, 26162–26176 RSC.
Footnote |
| † Electronic supplementary information (ESI) available. See DOI: 10.1039/c9se01103j |
| This journal is © The Royal Society of Chemistry 2020 |