 Open Access Article
Life cycle assessment of plasma-assisted ethylene production from rich-in-methane gas streams†
Evangelos
Delikonstantis
a,
Elorri
Igos
b,
Michael
Augustinus
 a,
Enrico
Benetto
*b and
Georgios D.
Stefanidis
 *ac
*ac
aProcess Engineering for Sustainable Systems (ProcESS), Department of Chemical Engineering KU Leuven, Celestijnenlaan 200F, 3001 Leuven, Belgium. E-mail: georgios.stefanidis@kuleuven.be
bLuxembourg Institute of Science and Technology (LIST), 5, Avenue des Hauts-Fourneaux, Esch-sur-Alzette, L-4362, Luxembourg. E-mail: enrico.benetto@list.lu
cSchool of Chemical Engineering, National Technical University of Athens, Iroon Polytechniou 9, Athens, 15780, Greece
First published on 8th January 2020
Abstract
Herein, the sustainability of plasma-assisted processes for ethylene production from rich-in-methane gas streams namely, natural and shale gas, is investigated by performing life cycle assessment (LCA). Two plasma-assisted process alternatives, a direct gas conversion to ethylene (one-step) and a stepwise gas conversion to acetylene followed by acetylene-to-ethylene hydrogenation (two-step), both previously demonstrated in the lab and modeled on a large scale, are evaluated using the SimaPro® software and ecoinvent database. Different scenarios regarding purge stream utilization and electricity sources are considered for both process alternatives. On the basis of LCA results, it is highly probable (confidence interval 93.5%) that the two-step process results in a lower carbon footprint than the one-step process. The two-step process, powered by electricity generated by wind turbines and utilizing the purge stream as the byproduct (instead of flaring it), produces the lowest carbon footprint among all studied scenarios. When natural gas is utilized as the feedstock, the two-step plasma-assisted ethylene production process is more environmentally sustainable than other peer processes (i.e. thermally driven and bio-based). When shale gas is used, greenhouse gas emissions decrease compared to natural gas, resulting in a comparable carbon footprint to the conventional (naphtha cracking) process. Further, aside from ethylene production onshore, plasma reactors can also be employed for ethylene production offshore, thereby valorizing currently wasted rich-in-methane gas streams and thus reducing global greenhouse gas emissions.
1. Introduction
To prevent an upcoming threat of climate change caused by a global temperature rise higher than 2 °C in this century,1 efforts to limit greenhouse gas (GHG) emissions and majorly CO2 are necessitated.2 Given that about a quarter of the global CO2 emissions result from industrial activities,3 decarbonization of the chemical industry will play a key role in global CO2 mitigation. Considering that ethylene is the second most used and thus, high-volume produced commodity chemical after ammonia,4 significant CO2 emissions result from ethylene production, accounting for ∼10% of the total chemical industry CO2 emissions. Consequently, decarbonization of the ethylene industry would vastly impact the chemical industry carbon footprint, ideally contributing to 2.5% lower CO2 emissions worldwide.Apart from using the latest state-of-the-art process equipment and applying process optimization and heat integration principles, through which considerable energy demand reduction is achieved,5 and thereby lower CO2 emissions, carbon capture utilization and storage (CCUS) technologies integrated within ethylene production processes have also been explored to reduce the carbon footprint of the ethylene industry. Utilization of CO2 captured from ethylene plants for enhanced oil recovery is the most appealing scenario.6,7 However, the high operating cost is the most important technology implementation barrier. Only upon applying a CO2 emission penalty of ∼85 $ per ton, a break-even point is reached8 and economic viability is possible.
An alternative practice to reduce CO2 emissions associated with ethylene production is the replacement of naphtha, an oil-based derivative, with “cleaner” feedstocks. Sugars and starchy biomass can be used for ethylene production in a two-step process: bioethanol is initially formed through sugar fermentation and subsequently dehydrated to ethylene.9 Although the environmental impact of bio-based processes is low10 upon carbon sequestration consideration (due to biomass use), complexity, economic viability under specific circumstances and mainly the arable land occupation for the feedstock growth over nutrition purposes inhibit the implementation of bio-based processes. Instead of sugars and starches, lignocellulosic biomass from agricultural and forest residuals can be used to produce ethylene through a complicated process, comprising multiple process steps: biomass gasification to syngas, syngas conversion to methanol and methanol conversion to olefins, including ethylene. A recent study on life cycle assessment (LCA) of ethylene production via wood gasification11 reports that the carbon footprint of ethylene can be as low as ∼0.35 kg CO2-eq. per kgethylene, without specifying whether CO2 sequestration (by the feedstock) is considered, though. Nevertheless, the economic viability and demonstration of this process on a large scale are still questionable.
Shale gas to ethylene may be the most favorable route for ethylene production at present due to the proven technical and economic feasibility on a large scale. As compared to naphtha, it is also considered cleaner12 due to the lower amount of impurities and much higher concentration of lighter hydrocarbons, resulting in a lower amount of CO2 formation per unit of energy released. In addition, advanced process design and integration13,14 of the ethylene production process with other processes, either to boost the energy utilization efficiency or coproduce other valuable products, can further improve the overall process performance. Although producing ethylene from shale gas is proven to be economically more attractive than producing it from naphtha15 or biomass,16 the environmental burden is higher. As claimed by Ghanta et al.,17 the main causative factor for greenhouse gas emissions is the burning of fossil-based fuel to meet the energy requirement for the shale gas cracking in high-temperature pyrolytic furnaces.
Electrification of the ethylene industry using green electricity as the main source of energy instead of heat released by fossil-based fuel combustion may be a determining step toward reducing the ethylene industry carbon footprint. Replacing the conventional thermally driven pyrolytic furnaces, to avoid fuel combustion for heat generation, with electricity-driven plasma reactors running on low-carbon electricity for electron-impact reaction activation is already ongoing. Electrified reactor systems for rich-in-methane stream conversion to ethylene in a plasma environment, powered by nanosecond pulsed discharges, have already been demonstrated and optimized.18–20 The feasibility of such electrified processes on a large scale has also been evaluated in our previous work,21 concluding that plasma-assisted ethylene production processes are possible from the technical point of view, but not economically viable at present. Nevertheless, plasma-assisted processes are still in the foreground since breakeven electricity prices are fairly close to the current electricity market prices and a low carbon footprint is expected upon integration with renewable electricity-based technologies. Whilst breakeven electricity prices have been estimated, the claim of lower carbon footprint is still debatable since no relevant studies are available in the literature.
It is the purpose of the current work to estimate the carbon footprint and evaluate the sustainability of plasma-assisted processes for ethylene production from rich-in-methane gas steams. The carbon footprint of the one- and two-step plasma-assisted processes for ethylene production, previously modeled and optimized,21 is based on an LCA approach and estimated using the SimaPro® software. On the basis of the mass and energy balances obtained in our previous work,21 the amount of kg CO2 eq. per kgethylene is calculated for both process alternatives, considering two cases: (i) the purge stream cannot be valorized, and thus it is flared and (ii) part of the purge stream is flared to satisfy the process heat duty (when necessary) and the rest is provided to a side process. For each case, scenarios on different electricity origin namely, electricity sourced by the grid, photovoltaic panels (PV) and wind turbines (WT) are explored. Finally, a comparison among all the peer ethylene production processes with respect to carbon footprint is presented and the potential of plasma-assisted reactors as a technology to prevent further environmental burden is discussed.
2. Materials and methods
2.1 Goal and scope definition
The aim of this study is to evaluate the environmental sustainability of plasma-assisted ethylene production processes by first estimating the carbon footprint of such electrified processes and, further benchmarking it against the carbon footprint of other peer ethylene processes namely, conventional naphtha cracking, thermally driven gas cracking and the bio-based route starting from corn grain.2.2 Plasma-assisted processes for ethylene production
2.3 System boundaries
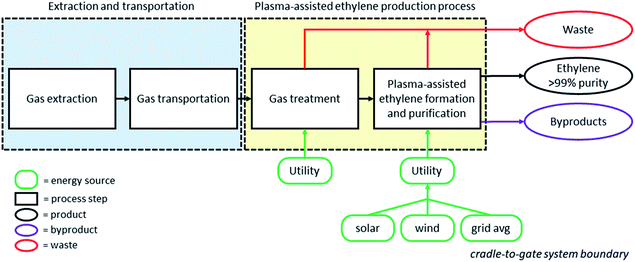
Since a comparison among peer processes for ethylene production from different feedstocks is aimed, a cradle-to-gate LCA is performed. Therefore, aside from the actual process (plasma-assisted ethylene formation), the upstream gas treatment process needed prior to the plasma-assisted reaction is also considered. The environmental impact of other steps of the gas value chain, such as gas extraction and transportation, is calculated using inventory data retrieved from the ecoinvent database (and literature data used for the case of shale gas). Further byproduct processing that may be required (i.e. purification) is out of the system boundaries. A schematic representation of the system boundaries is depicted in Fig. 1. Electricity is the major utility demanded for the production of ethylene in plasma-assisted processes since (i) the plasma reactor solely runs on electricity; (ii) the process hot duty (when required) is satisfied by the heat released by the purge stream flaring and (iii) the cold duty is satisfied by cooling systems that mainly utilize electricity; rich-in-methane gas is used as the coolant through compression and expansion while a negligible amount of cooling water is also utilized in the cooling cycles. Waste streams namely sodium-based salts, carbon and wastewater flow out of the process. Moreover, byproducts which have a market value, such as high-purity hydrogen and ethane, are also co-produced with ethylene. The purge stream is potentially a valuable byproduct due to its heating value. When possible, the purge stream is provided as a fuel stream to other processes, otherwise it is flared. Considering all byproducts and the different scenarios regarding purge stream utilization, the total amount of CO2 eq. calculated for the plasma-assisted processes is accordingly allocated to the final product (ethylene), either based on mass (ethylene mass over the total mass of all products formed in the process) or on economic shares (ethylene sales revenue over the total revenue generated by both ethylene and byproduct sales).2.4 Functional unit
In both one- and two-step plasma assisted processes, as well as in the processes considered for the benchmarking, ethylene is formed as the main product. Therefore, the production of one kilogram of ethylene (kgethylene) with purity higher than 99% is set as the functional unit. Material and energy flows are expressed according to this reference flow (kgi kgethylene−1 and kW h kgethylene−1, respectively) and, subsequently, carbon footprint is calculated on the same basis (kg CO2-eq. per kgethylene).2.5 Information sources
The specific inventory data for the one- and two-step processes (e.g. yield, utility consumption, and waste generation) are obtained from our previous work,21 in which both processes were modeled and optimized. The material and energy (M&E) flows are based on mass and energy balances obtained from that work and reported in the respective ESI.† In order to model the background processes (e.g. electricity and chemical supply chains), the ecoinvent database v3.2 is used.22 Datasets for some inputs are nevertheless missing. First, the production of the palladium-based catalyst is based on ref. 23, after considering the Pd presence instead of Ni, and ref. 24. In order to model the GHG emissions of shale gas extraction and transportation, the carbon footprint result from ref. 25 is used. No detailed inventory data could be retrieved for this process. Further, in order to compare the studied ethylene production process with other relevant processes, results from ref. 15 are used for naphtha and shale gas thermal cracking, and from ref. 9 for the bio-based route. Finally, electricity carbon footprint for the US market is considered in all scenarios.It is worth noting that the process simulation and, subsequently, the mass and energy balances, which the current work is based on, are linear extrapolation of the results obtained at the lab scale. Considering that (a) industrial plasma reactors comprising a bundle of smaller co-axial plasma reactors (numbering up) of comparable capacity to those used in our experiments have been launched, and (b) the numbering up approach is considered as the most promising one for the technology studied in this paper, the calculated carbon footprint is minorly affected by the plasma reactor upscaling.
2.6 Material and energy flow streams and allocation
Two different cases are considered for the plasma-assisted ethylene production process: (i) the purge stream cannot be valorized and thus flared, resulting in additional CO2 emissions; (ii) the purge stream is partially flared to satisfy the process heat requirements while the rest is valorized in a side process (additional byproduct considered in the allocation of burdens). In the respective case of the two-step process, no purge stream flaring is necessary, since the heat required to run the process is fully supplied by other process streams through heat integration. The M&E flows used for the carbon footprint calculations for each case are presented below.| Classification | Material input | Total purge flaring | Partial purge flaring | ||
|---|---|---|---|---|---|
| Before mass allocation | After mass allocation | Before mass allocation | After mass allocation | ||
| kg kgethylene−1 | kg kgethylene−1 | kg kgethylene−1 | kg kgethylene−1 | ||
| a Flow expressed in m3 kgethylene−1. b Heat released by purge flaring. c Heat requirements of the one-step process. | |||||
| Raw material | Natural gas | 2.9 (3.7)a | 1.7 (2.2)a | 2.9 (3.7)a | 1.5 (1.9)a |
| Water consumption | Water | 22 | 13 | 22 | 12 |
| Chemicals | NaOH | 0.29 | 0.18 | 0.29 | 0.16 |
| Water consumption | Water from NaOH solution | 1.0 | 0.59 | 1.0 | 0.52 |
| Chemicals | TEG absorbent | 3.2 × 10⁻⁶ | 1.9 × 10⁻⁶ | 3.2 × 10⁻⁶ | 1.7 × 10⁻⁶ |
| Material output | kg kgethylene−1 | kg kgethylene−1 | kg kgethylene−1 | kg kgethylene−1 | |
|---|---|---|---|---|---|
| Waste | Water | 25 (0.025)a | 15 (0.018)a | 25 (0.025)a | 13 (0.016)a |
| Waste | Carbon | 0.59 | 0.35 | 0.59 | 0.31 |
| Waste | Sodium-based salts | 0.40 | 0.24 | 0.40 | 0.21 |
| Emission (to air) | CO2 | 0.73 | 0.41 | 0.14 | 0.052 |
| Emission (to air) | Steam | 1.0 | 0.59 | 0.20 | 0.10 |
| kW h kgethylene−1 | kW h kgethylene−1 | kW h kgethylene−1 | kW h kgethylene−1 | ||
|---|---|---|---|---|---|
| Utility | Electricity input | 28 | 17 | 28 | 14 |
| Products | kg kgethylene−1 | kg kgethylene−1 | |||
|---|---|---|---|---|---|
| Pure H2 | 0.3 | 0.3 | |||
CH4 + H2 (32.5![[thin space (1/6-em)]](https://www.rsc.org/images/entities/char_2009.gif) : :![[thin space (1/6-em)]](https://www.rsc.org/images/entities/char_2009.gif) 67.5 v/v) 67.5 v/v) |
— | 0.2 | |||
| C2H6 (96% purity) | 0.3 | 0.3 | |||
| C2H6 (84% purity) | 0.1 | 0.1 | |||
| C2H4 (>99% purity) | 1.0 | 1.0 | |||
| Mass allocation factor | 0.59 | 0.52 |
The purge stream mainly comprises hydrogen and light hydrocarbons. Therefore, CO2 and water are mainly formed after purge stream flaring. The top-product of the stripper used for triethylene glycol (TEG) reclamation in the upstream gas processing section is also flared (although it is negligible). The amounts of CO2, water and heat released from the purge stream flaring are calculated based on the respective combustion reactions shown in the ESI (Tables S1 and S2† for the cases of total and partial purge stream flaring, respectively). It is noted that purge stream flaring results in a carbon footprint increase because of two reasons; first, additional CO2 is emitted due to the purge stream flaring; second, a higher mass allocation factor is obtained, as the unflared purge stream forms an additional byproduct, leading to kg CO2-eq. per kgethylene increase. When economic allocation is applied, the purge stream flaring might be preferred if the amount of energy released from its combustion is more expensive than the stream itself.
| Classification | Material input | Total purge flaring | No purge flaring | ||
|---|---|---|---|---|---|
| Before mass allocation | After mass allocation | Before mass allocation | After mass allocation | ||
| kg kgethylene−1 | kg kgethylene−1 | kg kgethylene−1 | kg kgethylene−1 | ||
| a Flow expressed in m3 kgethylene−1. b Heat released by purge flaring. c Heat requirement of the two-step process. | |||||
| Raw material | Natural gas | 2.2 (2.8)a | 1.4 (1.8)a | 2.2 (2.8)a | 1.2 (1.5)a |
| Water consumption | Water | 91 | 59 | 91 | 50 |
| Chemicals | NaOH | 0.24 | 0.13 | 0.24 | 0.11 |
| Water consumption | Water from NaOH solution | 0.85 | 0.58 | 0.85 | 0.50 |
| Chemicals | TEG absorbent | 2.4 × 10⁻⁶ | 1.5 × 10⁻⁶ | 2.4 × 10⁻⁶ | 1.3 × 10⁻⁶ |
| kW h kgethylene−1 | kW h kgethylene−1 | kW h kgethylene−1 | kW h kgethylene−1 | ||
|---|---|---|---|---|---|
| Utility | Electricity | 23 | 15 | 23 | 13 |
| Products | kg kgethylene−1 | kg kgethylene−1 | |||
|---|---|---|---|---|---|
| Pure H2 | 0.1 | 0.1 | |||
CH4+H2 (32.5![[thin space (1/6-em)]](https://www.rsc.org/images/entities/char_2009.gif) : :![[thin space (1/6-em)]](https://www.rsc.org/images/entities/char_2009.gif) 67.5 v/v) 67.5 v/v) |
— | 0.3 | |||
| C2H6 (96% purity) | 0.3 | 0.3 | |||
| C2H6 (84% purity) | 0.1 | 0.1 | |||
| C2H4 (>99% purity) | 1.0 | 1.0 | |||
| Mass allocation factor | 0.65 | 0.55 |
Since the two-step process19 achieves higher ethylene yield per pass than the one-step18 process (25.7% versus 19.5%), a lower amount of gas needs to be dehydrated, as confirmed by Tables 2 and 1 (2.8 m3 kgethylene−1versus 3.7 m3 kgethylene−1). The amount of off-gases released in the TEG stripper in the two-step process is lower compared to the one-step process; it is therefore neglected, as shown in the ESI (Table S3†). It is noted that there is no need for external heat supply in the two-step process, as shown in Table 2. The heat required for the raw gas dehydration and, ethylene reclamation and purification is provided by the process itself, through proper process stream matching as imposed by pinch analysis.
Next to M&E flows, catalyst preparation and regeneration also contribute to the process carbon footprint. Therefore, it is taken into account for the two-step process LCA. The respective data required for the carbon footprint calculation are presented in Table 3.
| Classification | Material input | Before mass allocation | After mass allocation | ||
|---|---|---|---|---|---|
| Total purge flaring | No purge flaring | ||||
| kg kgcatalyst−1 | kg kgethylene−1 | kg kgethylene−1 | kg kgethylene−1 | ||
| a Flow expressed in m3 kgethylene−1. | |||||
| Raw material | Palladium | 0.025 | 1.7 × 10⁻⁶ | 1.1 × 10⁻⁶ | 9.6 × 10⁻⁷ |
| Chemicals | Hydrochloric acid | 0.017 | 1.2 × 10⁻⁶ | 7.5 × 10⁻⁷ | 6.4 × 10⁻⁷ |
| Chemicals | Deionized water | 1283 (1.3)a | 0.074 (7.5 × 10⁻⁵)a | 0.048 (4.9 × 10⁻⁵)a | 0.041 (4.1 × 10⁻⁵)a |
| Chemicals | Hydrogen liquid | 13 | 7.3 × 10⁻⁴ | 4.8 × 10⁻⁴ | 4.0 × 10⁻⁴ |
| Raw material | Aluminium oxide | 0.70 | 4.1 × 10⁻⁵ | 2.6 × 10⁻⁵ | 2.2 × 10⁻⁵ |
| Energy input | kW h kgcatalyst−1 | ||||
|---|---|---|---|---|---|
| Utility | Electricity | 1580 | 0.092 | 0.060 | 0.050 |
| Catalyst demand |
|---|
| 100 mlmethane min−1 gcatalyst−1 |
| 6 Lmethane h−1 gcat−1 |
| 0.27 molmethane h−1 gcat−1 |
| 0.023 molethylene h−1 gcat−1 |
| 17246 kgethylene kgcatalyst (3 years catalyst lifetime is considered) |
| 5.8 10−5 kgcatalyst kgethylene |
2.7 Calculation approach
A two-step calculation approach is employed to determine the carbon footprint of the plasma-assisted ethylene production processes. First, the baseline carbon footprint of the processes is calculated considering the average values of the process parameters (see Tables 1 and 2). Then, uncertainty analysis is performed in order to estimate the variation range of LCA results. This is done by Monte Carlo random sampling. First, the method defines probability distributions for the input parameters. For several hundred iterations, inputs are randomly sampled on their distributions to calculate model outputs. A sample of results is obtained, from which several statistics can be derived (average, median, confidence intervals, etc.).In this study, all the process parameters (gas demand, energy use, purge stream generation, etc.) depend on the ethylene yield. In order to obtain consistent results, it is necessary to express these parameters as a function of ethylene yield and determine a probability distribution only for ethylene yield. The formulae to express gas demand, production distribution (affecting the mass allocation factor), purge stream and energy costs as a function of ethylene yield were obtained from our previous work21 and are presented in Table 4. The yield is assumed to follow a normal distribution, with a 95% confidence interval set at ±23.4% of the average value. It is noted that the highest ethylene yield achieved in the experiments is ∼30% higher than the average ethylene yield value. Monte Carlo sampling is then applied for 14000 iterations (high number to have more representative results).
| Parameter | One-step | Two-step |
|---|---|---|
| Gas demand | y = 189x2 − 58x + 8 | y = −183x2 + 32x + 2 |
| Ethane | y = −23x2 + 10x − 1 | y = −11x2 + 9x − 0,8 |
| Carbon | y = 34x2 − 11x + 1 | y = −2x2 + 0,7x + 0,06 |
| Hydrogen | y = 17x2 − 6x + 1 | y = −2x2 + 0,8x + 0,07 |
| Purge stream | y = 22x2 − 7x + 1 | y = −4x2 + 1x + 0,2 |
| Energy cost | y = −648x2 + 286x + 1 | y = −6344x2 + 2149x − 160 |
| x = ethylene yield | ||
3. Results and discussion
In this section, the LCA results obtained from the SimaPro® software are presented and discussed. As previously mentioned, two cases are investigated for each plasma-assisted process: (a) total and partial (20%) purge flaring for the one-step process, and (b) total and absence of flaring for the two-step process. For each case, three scenarios on the electricity source namely, electricity (mix) provided by the grid, photovoltaics and wind turbines are simulated. The plasma-assisted process carbon footprint is calculated for the six scenarios and presented in Table 5.| Scenario | Process alternative | Process features | MAFa | EAFb | Difference (%) |
|---|---|---|---|---|---|
| a MAF = mass allocation factor. b EAF = economic allocation factor. | |||||
| Sc. 1 | One-step | Total purge stream flaring and grid electricity | 0.59 | 0.83 | 40 |
| Sc. 2 | One-step | Total purge stream flaring and PV electricity | 0.59 | 0.83 | 40 |
| Sc. 3 | One-step | Total purge stream flaring and WT electricity | 0.59 | 0.83 | 40 |
| Sc. 4 | One-step | Partial purge stream flaring and grid electricity | 0.52 | 0.80 | 55 |
| Sc. 5 | One-step | Partial purge stream flaring and PV electricity | 0.52 | 0.80 | 55 |
| Sc. 6 | One-step | Partial purge stream flaring and WT electricity | 0.52 | 0.80 | 55 |
| Sc.1 | Two-step | Total purge stream flaring and grid electricity | 0.65 | 0.86 | 33 |
| Sc.2 | Two-step | Total purge stream flaring and PV electricity | 0.65 | 0.86 | 33 |
| Sc.3 | Two-step | Total purge stream flaring and WT electricity | 0.65 | 0.86 | 33 |
| Sc. 4 | Two-step | No purge stream flaring and grid electricity | 0.55 | 0.82 | 49 |
| Sc. 5 | Two-step | No purge stream flaring and PV electricity | 0.55 | 0.82 | 49 |
| Sc. 6 | Two-step | No purge stream flaring and WT electricity | 0.55 | 0.82 | 49 |
3.1 One-step plasma-assisted process
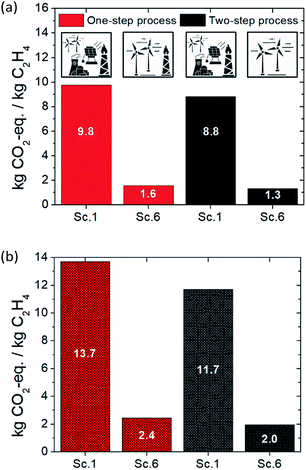
The carbon footprint, expressed in kg CO2-eq. per kgethylene, of the one-step plasma-assisted ethylene production from natural gas process is presented in Fig. 2a. When the purge stream is totally flared, an additional amount of 0.4 CO2 per kgethylene is released, and thus, a higher carbon footprint than in the case of partial flaring is obtained for the same electricity source. In the case of total purge stream flaring and grid electricity utilization, the highest CO2-eq. amount is emitted, yielding 9.8 CO2-eq. per kgethylene (worst-case scenario). However, the carbon footprint driver is the source of electricity used to power the plasma-assisted process. Significant reduction in CO2-eq. emitted is obtained when electricity is provided by renewable electricity-based technologies namely, PV and WT. Approximately four times lower CO2-eq. emissions are achieved when “green” electricity is harvested and utilized. Between PV- and WT-generated electricity, lower CO2-eq. emissions are generated in the second case. In the case of partial purge stream flaring and WT-generated electricity utilization, the lowest possible carbon footprint is reached, accounting for 1.6 CO2-eq. per kgethylene.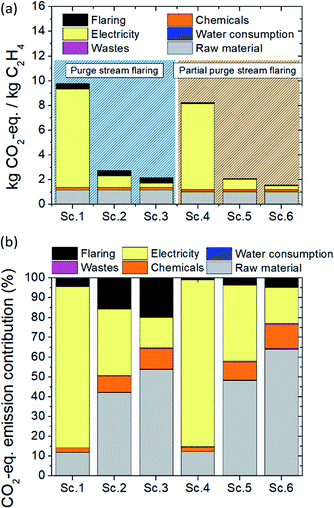 | ||
| Fig. 2 LCA of the one-step ethylene production process: (a) carbon footprint of the process for six possible scenarios (Table 5) and (b) percentile CO2-eq. emission distribution over the material and energy flows. | ||
The distribution of CO2-eq. emissions associated with ethylene production in the one-step plasma-assisted process over the M&E flows is shown in Fig. 2b. Electricity consumption contributes the highest (∼80%) to carbon footprint when electricity is provided by the grid, irrespective of whether the purge stream is valorized or flared. Given that grid electricity is generated by a mix of renewable and fossil-based technologies, high CO2-eq. emissions are associated with the relatively high electricity demand for the plasma-assisted process operation. However, switching from grid electricity to PV-generated electricity, the energy consumption effect on the overall process carbon footprint gets less pronounced, whereas the raw material (natural gas) becomes the most impacting factor (34% versus 42% and 38% versus 48% for total and partial purge stream flaring, respectively). In the case of plasma-assisted process integration with WT, CO2-eq. emissions due to electricity consumption account only for 15% and 18% in the event of total and partial purge stream flaring, respectively. Although the same downward trend in electricity consumption contribution to overall process carbon footprint is observed in both the cases of total and partial purge stream flaring, in the former case, the contribution of electricity is slightly lower due to the higher amount of CO2 sourced by the purge stream flaring (0.4 versus 0.07 CO2 per kgethylene for the total and partial purge stream flaring, respectively).
3.2 Two-step plasma-assisted process
The carbon footprint of the two-step plasma-assisted ethylene production from natural gas process is presented in Fig. 3a. As observed in the one-step process, by switching from grid electricity utilization to PV- and WT-generated electricity, a significantly lower process carbon footprint is achieved, while electricity consumption is not the environmental burden driver as in the former case (grid electricity utilization). In the case of total purge stream flaring, slightly lower CO2 is emitted as compared to the one-step process. The reasoning lies in the higher yield achieved per pass, which results in a lower volumetric flow recycle stream and, subsequently, lower volumetric flow purge stream. Moreover, the two-step process always results in a lower carbon footprint than the one-step process; the reason is twofold: (i) higher ethylene yield and lower carbon formation are achieved, leading to lower specific natural gas demand (2.8 versus 3.7 m3 kgethylene−1) and (ii) operating at ambient pressure leads to lower energy cost (23 versus 28 kW h kgethylene−1). Unlike the one-step process, a palladium-based catalyst is utilized to boost ethylene selectivity in the two-step process which is also accounted for in the carbon footprint calculation process. The very low catalyst demand, however, which is attributed to the long lifetime and high activity of the catalyst, leads to trivial CO2-eq. emissions (0.05 kg CO2-eq. per kgethylene). In the case of purge stream valorization (absence of flaring) and WT-generated electricity utilization, the lowest possible carbon footprint is reached, yielding 1.3 CO2-eq. per kgethylene (best-case scenario).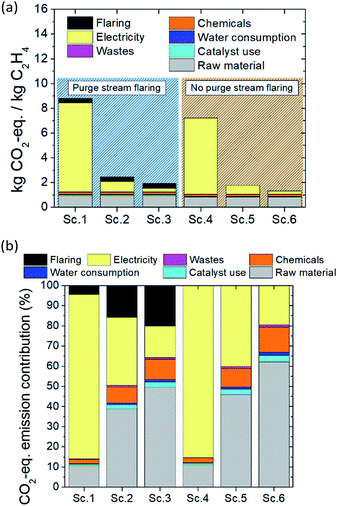 | ||
| Fig. 3 LCA of the two-step ethylene production process: (a) carbon footprint of the process for six possible scenarios (Table 5) and (b) percentile CO2-eq. emission distribution over the material and energy flows. | ||
Similar to the one-step process, electricity consumption is the most contributing factor when the plasma reactor is powered by grid-sourced electricity. When the electricity is harvested by either PV or WT, electricity consumption contribution to carbon footprint substantially drops and raw material (natural gas) consumption drives the environmental burden. Emissions associated with catalyst preparation and regeneration are rather limited while emissions due to chemical use and waste effluents can be neglected. All the above-stated conclusions are drawn from Fig. 3b.
3.3 Two-step vs. one-step process
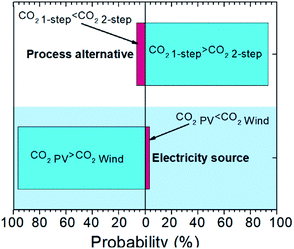
A comparison between the one- and two-step plasma-assisted ethylene production from natural gas, on the basis of LCA results, is presented in Fig. 4. Scenario 1, which fairly represents the current situation (electricity is mainly sourced by the grid) and scenario 6, which reflects a future perspective of electricity supply (according to which electricity will be harvested from renewable electricity-based technologies, mainly wind turbines, due to their incessant market share growth26) are considered for the comparison. As shown in Fig. 4a, integration of plasma-assisted processes with renewable electricity-based technologies is the only way towards achieving sustainable electrified processes. Otherwise, the relatively high electricity consumption will not allow for low carbon footprints when electricity is provided by the grid. Fossil fuel flaring avoidance can further facilitate CO2 emission mitigation, but it does not substantially affect the overall carbon footprint of the electrified processes. This is further evidenced by Fig. 4b. The purge stream flaring does not result in a lower carbon footprint when economic allocation is considered since the economic benefit out of energy trading generated by the flaring is not significant. The byproduct market prices considered for the economic allocation factor calculation are presented in the ESI (Table S4†).Overall, the two-step plasma-assisted process is concluded to be more sustainable than the one-step process (1.3 versus 1.6 CO2-eq. per kgethylene). But since the calculated CO2-eq. emissions were based on average process parameters and impact factor values and, considering that the difference between the calculated emissions is rather small, uncertainty analysis is performed to determine the confidence interval of the above calculated carbon footprints. According to the uncertainty analysis presented in Fig. 5, it is highly probable (confidence interval 93.5%) that the carbon footprint of the two-step process is lower than that of the one-step process when the same scenario is considered. Uncertainty analysis is also employed to determine the confidence interval between the two-step carbon footprint calculated for PV- and WT-generated electricity. Given the 96.7% confidence interval calculated for the carbon footprint of the two electricity sources (Fig. 5), a clear preference for WT-generated electricity is statistically proven. Further, the carbon footprint deviation of scenario 6 for the two-step process, which is henceforth considered for the benchmarking against other peer processes, is determined on the basis of the carbon footprint distribution arising from the uncertainty analysis and found to be ±0.4 CO2-eq. per kgethylene.
3.4 Natural gas versus shale gas feedstock
Since shale gas inventory data are not currently available in the ecoinvent database, a thorough LCA of plasma-assisted ethylene production from shale gas is not easy. However, an attempt to estimate Marcellus shale gas GHG emission factors is introduced by Laurenzi & Jersey,25 in which a value of 8.8 kg CO2-eq. per GJ, on a higher heating value (HHV) basis and including transportation to the shale gas processing unit, is reported. Assuming shale gas calorific value equal to methane for the sake of calculation (∼40 MJ m−3 as measured through experimental measurements27) and considering the reported Marcellus shale gas GHG emission factor, LCA of plasma-assisted ethylene production from shale gas is attempted. It is concluded that ∼20% lower overall carbon footprint may be achieved (∼0.6 versus ∼0.8 kg CO2-eq. per kgethylene for shale and natural gas, respectively), as presented in Fig. 6. Due to the lack of Marcellus shale gas detailed data, uncertainty analysis is not feasible.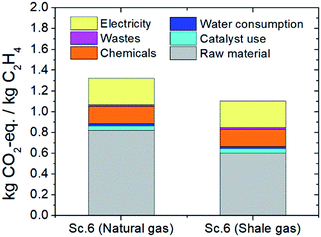 | ||
| Fig. 6 Carbon footprint of the two-step process when natural and Marcellus shale gas are utilized as feedstocks; the purge stream is valorized and electricity is harvested by wind turbines. | ||
3.5 Carbon footprint comparison of peer ethylene processes
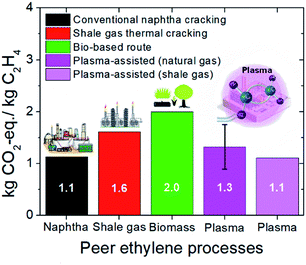
The overall carbon footprint of the (natural or shale) gas-to-ethylene plasma-assisted process, when the purge stream is valorized and WT-generated electricity is utilized (scenario 6), is compared to the carbon footprint of the conventional ethylene production process (naphtha cracking)17 as well as other emerging processes namely, ethylene from wet shale gas15 and biomass16 (before CO2 sequestration by the feedstock). The respective comparison is depicted in Fig. 7.Thermally driven shale gas cracking to ethylene and the bio-based ethylene process result in the highest GHG emissions among the other processes, yielding 1.6 and 2.0 kg CO2-eq. per kgethylene, respectively. As far as the bio-based process environmental burden is concerned, a significant amount of CO2-eq. is ascribed to the high volume of chemicals used for biomass to ethanol conversion (especially when stover is utilized as the feedstock) in the first step of the process.16 Besides, energy demand for biomass treatment and process operation (especially when grains are utilized as the feedstock) is also an important contributor to the impact.16 Regarding the ethylene formation from wet shale gas, about half of the emissions result from the ethylene formation process section while the rest are attributed to shale gas acquisition and processing.15 Gas flaring to satisfy the furnace energy requirements for ethylene formation majorly contributes to GHG emissions, whereas gas losses occurring during wet shale gas transportation from the extraction point to the processing station are the main source of GHG emissions attributed to gas acquisition.
In the plasma-assisted ethylene production process, fossil fuel flaring is prevented since electricity is utilized to initiate the reforming reactions instead of heat. Although much lower GHG emissions than the thermally driven process would be expected due to flaring elimination, the relatively high electricity consumption for electron impact reaction activation results in slightly lower GHG emissions. Eventually, the replacement of heat by electricity as the primary energy source prevents fossil fuel flaring at the expense of relatively high electricity consumption. Nevertheless, up to 30% reduction in GHG emissions can be achieved by electrifying gas-to-ethylene (plasma) processes with electricity harvested by wind turbines. By utilizing shale gas as the feedstock instead of natural gas, further reduction in the carbon footprint is possible and comparable GHG emissions to the conventional (naphtha cracking) process may even be achieved (1.1 versus 1.13 kg CO2-eq. per kgethylene, respectively).
Plasma-assisted reactors able to valorize rich-in-methane gas streams may be a complementary technology for ethylene formation next to the conventional process, as concluded by Yao et al.28 However, plasma can also be considered as a technology with the potential to limit environmental pollution. In this context, plasma reactors can be installed at places, for instance offshore, where gas streams are not currently valorized due to the lack of infrastructure; rather, they are flared, emitting significant amounts of GHG emissions. Gas flaring has lately been considered an important environmental issue.29,30 Preventing gas flaring by promoting its valorization is an attractive approach towards lower GHG emissions.31 Specific plasma reactor features, which conventional thermal cracking technology lacks, such as modularity, fast start-up and shut down periods, low volumetric footprint and easy integration with renewable electricity-based technologies further enhance the potential of this technology in such applications. Next to that, the environmental and economic impacts are also encouraging as presented in Fig. 8.
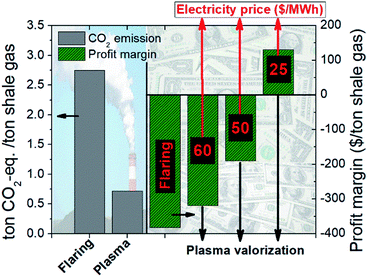
Comparison of the case of gas flaring (current case) to the case of gas valorization to ethylene in a two-step plasma assisted process, operating according to scenario 6, shows that the gain in the second case is twofold: (i) ∼74% reduction in GHG emissions (2.8 ton CO2 per ton gas versus 0.7 kg CO2-eq. per ton gas; the GHG emissions in the case of valorization arise from electricity use) and (ii) ∼17% higher profit margin. It is worth mentioning that profit margin is still negative given the current electricity price. However, a foreseen electricity price drop below 35 $ per MW h may even turn the economic profitability into positive, unlike the case of flaring which will always be an economic loss aside from the environmental burden.
4. Conclusions
Life cycle assessment (LCA) is applied to evaluate the sustainability of two plasma-assisted processes suitable for rich-in-methane gas stream conversion to ethylene (one-step process: direct gas conversion to ethylene at elevated pressures, and two-step process: gas conversion to acetylene followed by catalytic acetylene hydrogenation to ethylene at atmospheric pressure). The carbon footprint of both plasma-assisted process alternatives is determined for different scenarios regarding purge stream valorization and electricity sources. Based on LCA results and uncertainty analysis, it is highly probable (confidence interval 93.5%) that the carbon footprint of the two-step process is lower than that of the one-step process for any of the six scenarios. When electricity is sourced by photovoltaics and wind turbines instead of the grid, almost four times lower carbon footprint is achieved, due to the elimination of fossil fuel flaring for electricity generation. Further, the uncertainty analysis shows a statistically significant advantage for plasma-assisted processes coupled with wind turbines over photovoltaics towards lower GHG emissions. Eventually, when the purge stream is valorized rather than flared and electricity generated by wind turbines is utilized, the two-step plasma-assisted (natural or shale) gas-to-ethylene production process produces up to 30% lower carbon footprint than the thermally driven and bio-based ethylene production processes. The lowest carbon footprint is obtained when shale gas is used as the feedstock; in this case, comparable GHG emissions to the conventional (naphtha cracking) process may be achieved, although this is not statistically proven yet. Finally, plasma technology has an economic and environmental potential for valorization of (currently flared) rich-in-methane gas streams, allowing for exploitation of a valuable raw material and mitigation of global greenhouse gas emissions.Conflicts of interest
There are no conflicts to declare.Acknowledgements
Funding: this work has received funding from the European Union's Horizon 2020 Research and Innovation Programme through the project “Adaptable Reactors for Resource and Energy Efficient Methane Valorization” (ADREM) [No. 680777].References
- United Nations, Kyoto Protocol to the United Nations Framework-Convention on Climate Change, 2015 Search PubMed.
- Y. Gao, X. Gao and X. Zhang, Engineering, 2017, 3, 272–278 CrossRef.
- A. de Pee, D. Pinner, O. Roelofsen, K. Somers, E. Speelman and M. Witteveen, Decarbonization of industrial sectors: the next frontier, McKinsey & Company: Amsterdam, The Netherlands, 2018 Search PubMed.
- Z. J. Schiffer and K. Manthiram, Joule, 2017, 1, 10–14 CrossRef.
- IPCC, 2014: Climate Change 2014: Mitigation of Climate Change. Contribution of Working Group III to the Fifth Assessment Report of the Intergovernmental Panel on Climate Change, ed. O. Edenhofer, R. Pichs-Madruga, Y. Sokona, E. Farahani, S. Kadner, K. Seyboth, A. Adler, I. Baum, S. Brunner, P. Eickemeier, B. Kriemann, J. Savolainen, S. Schlömer, C. von Stechow, T. Zwickel and J. C. Minx, Cambridge University Press, Cambridge, United Kingdom and New York, NY, USA, 2014 Search PubMed.
- J. M. Bielicki, R. S. Middleton, J. S. Levine and P. Stauffer, Energy Procedia, 2014, 63, 7215–7224 CrossRef CAS.
- R. S. Middleton, J. S. Levine, J. M. Bielicki, H. S. Viswanathan, W. J. Carey and P. H. Stauffer, Greenhouse Gases: Sci. Technol., 2015, 5, 241–253 CrossRef CAS.
- M. C. Weikl and G. Schmidt, AIChE J., 2010, 12c Search PubMed.
- Irena/Iea-Etsap, IEA-ETSAP IRENA© Technol. Br. I13 – January 2013, 2013, 1–20.
- J. Hong, Y. Zhang, X. Xu and X. Li, Biomass Bioenergy, 2014, 67, 304–311 CrossRef CAS.
- C. Liptow, A. M. Tillman and M. Janssen, Int. J. Life Cycle Assess., 2015, 20, 632–644 CrossRef CAS.
- J. J. Siirola, AIChE J., 2014, 60, 810–819 CrossRef CAS.
- M. Yang and F. You, Chemical Engineering Transactions, 2017, 61, 1561–1566 Search PubMed.
- C. He and F. You, Ind. Eng. Chem. Res., 2014, 53, 11442–11459 CrossRef CAS.
- M. Yang and F. You, Ind. Eng. Chem. Res., 2017, 56, 4038–4051 CrossRef CAS.
- M. Yang, X. Tian and F. You, Ind. Eng. Chem. Res., 2018, 57, 5980–5998 CrossRef CAS.
- M. Ghanta, D. Fahey and B. Subramaniam, Appl. Petrochem. Res., 2013, 4, 167–179 CrossRef.
- M. Scapinello, E. Delikonstantis and G. D. Stefanidis, Fuel, 2018, 222, 705–710 CrossRef CAS.
- E. Delikonstantis, M. Scapinello and G. D. Stefanidis, Fuel Process. Technol., 2018, 176, 33–42 CrossRef CAS.
- M. Scapinello, E. Delikonstantis and G. D. Stefanidis, Chem. Eng. J., 2019, 360, 64–74 CrossRef CAS.
- E. Delikonstantis, M. Scapinello and G. Stefanidis, Processes, 2019, 7, 68 CrossRef CAS.
- G. Wernet, C. Bauer, B. Steubing, J. Reinhard, E. Moreno-Ruiz and B. Weidema, Int. J. Life Cycle Assess., 2016, 21, 1218–1230 CrossRef.
- B. Agarski, V. Nikolić, Ž. Kamberović, Z. Anđić, B. Kosec and I. Budak, J. Clean. Prod., 2017, 162, 7–15 CrossRef CAS.
- O. G. Griffiths, R. E. Owen, J. P. O'Byrne, D. Mattia, M. D. Jones and M. C. McManus, RSC Adv., 2013, 3, 12244–12254 RSC.
- I. J. Laurenzi and G. R. Jersey, Environ. Sci. Technol., 2013, 47, 4896–4903 CrossRef CAS PubMed.
- G. J. Van Rooij, H. N. Akse, W. A. Bongers and M. C. M. Van De Sanden, Plasma Phys. Control. Fusion, 2018, 60, 014019 CrossRef.
- P. Schley, M. Beck, M. Uhrig, S. M. Sarge, J. Rauch, F. Haloua, J. R. Filtz, B. Hay, M. Yakoubi, J. Escande, A. Benito and P. L. Cremonesi, Int. J. Thermophys., 2010, 31, 665–679 CrossRef CAS.
- Y. Yao, D. J. Graziano, M. Riddle, J. Cresko and E. Masanet, Ind. Eng. Chem. Res., 2016, 55, 3493–3505 CrossRef CAS.
- O. C. D. Anejionu, J. D. Whyatt, G. A. Blackburn and C. S. Price, Atmos. Environ., 2015, 118, 184–193 CrossRef CAS.
- O. G. Fawole, X. M. Cai and A. R. Mackenzie, Environ. Pollut., 2016, 216, 182–197 CrossRef CAS PubMed.
- C. D. Elvidge, M. D. Bazilian, M. Zhizhin, T. Ghosh, K. Baugh and F. C. Hsu, Energy Strategy Review, 2018, 20, 156–162 CrossRef.
Footnote |
| † Electronic supplementary information (ESI) available. See DOI: 10.1039/c9se00736a |
| This journal is © The Royal Society of Chemistry 2020 |

