
Production of formate by CO2 electrochemical reduction and its application in energy storage†
Hang
Xiang
 a,
Hamish Andrew
Miller
b,
Marco
Bellini
b,
Henriette
Christensen
a,
Keith
Scott
a,
Shahid
Rasul
ac and
Eileen H.
Yu
*a
a,
Hamish Andrew
Miller
b,
Marco
Bellini
b,
Henriette
Christensen
a,
Keith
Scott
a,
Shahid
Rasul
ac and
Eileen H.
Yu
*a
aSchool of Engineering, Newcastle University, Newcastle Upon Tyne, UK. E-mail: eileen.yu@ncl.ac.uk
bIstituto di Chimica dei Composti Organometallici (CNR-ICCOM), Via Madonna del Piano 10,50019 Sesto Fiorentino, Firenze, Italy
cFaculty of Engineering and Environment, Northumbria University, Newcastle Upon Tyne, UK
First published on 9th December 2019
Abstract
Production of liquid fuels by electrochemical CO2 reduction (eCO2R) is an attractive option for energy storage in the form of renewable energy. This study focuses on efficient formate production using an eCO2R system and its application in generating power using a direct formate fuel cell (DFFC). A carbon black supported SnO2 catalyst was used for the eCO2R in a gas diffusion reactor using a 1.0 M KOH electrolyte. An average faradaic efficiency of 80% for formate production was achieved over a wide electrode potential range (−0.63 to −1.43 V vs. RHE). Since the overall current density varied linearly with the overpotential, the rate of formate production could be easily controlled by varying the applied potential. At a current density of 251 mA cm−2 (−1.43 V), a high formate production rate was achieved at 3 mg min−1 cmWE−2 resulting in 0.5 M formate being produced within 1 hour. This formate solution was directly used as the fuel for a DFFC, without pre-treatment. The fuel cell consisted of a Pd–CeO2/C anode and FeCo/C cathode and produced a peak power density of 92 mW cm−2. A closed loop of “electricity–formate–electricity” has been realized in this study, signifying the promising future of sustainable CO2 conversion to liquid fuels for CO2 fixation as well as for energy storage.
Introduction
Electrochemical CO2 reduction (eCO2R) in aqueous media has aroused attention in the CO2 utilization field. Converting CO2 and water with renewable electricity to produce carbonaceous chemicals and fuels provides a new means for achieving a low-carbon economy. The carbonaceous products from eCO2R can be wide-ranging, both gases, such as CO, CH4, and C2H4, which can be formed at current efficiencies greater than 70%,1–3 and liquid products, such as formate, methanol and ethanol,4 produced with faradaic efficiencies greater than 90%,5,6 40%,7 and 40%,8 respectively. Liquid products have advantages in terms of transportation, storage, and handling. In terms of electric energy generation, formate is superior to alcohols as it is non-flammable and non-toxic. The thermodynamic cell voltage of a formate fuel cell is 1.48 V,9 which is higher than that of methanol (1.21 V), ethanol (1.14 V) and hydrogen (1.23 V).Vo et al.10 demonstrated the concept of electricity storage and release using formate produced by CO2 electro-reduction and investigated the possibility of this closed-loop energy conversion for the first time. However, electric energy generation from formate produced from CO2 has not been realized due to low concentration of the products. In a normal direct formate fuel cell (DFFC), a high concentration of formate (≥1 M) is used.11 Table S1† summarizes related studies12–27 of selective formate production by eCO2R published in the past 5 years, with their corresponding formate yields and its concentration in the residual electrolyte – which were rarely mentioned in the original publications. The formate concentrations are characteristically below 0.1 M after 1 hour of electrolysis, far less than the level required for energy generation and storage. The reasons for the low formate concentration could be poor CO2 mass transfer efficiency in an aqueous medium and low current density by using an electrolyte with low alkalinity. Lee et al.28 developed a catholyte-free electrolyzer using a vapor stream on the cathode, with a 25 cm2 electrode area. A formate concentration of 0.9 M was produced at 70 °C but it decreased to 0.5 M at 30 °C. However, supplying a vapour stream would increase the energy and cost of such a process.
In this study, we developed a cost-effective and high-efficiency gas diffusion system to achieve controllable formate production by eCO2R in an aqueous medium. 0.5 M formate could be produced directly in alkaline media within 1 hour under ambient conditions. This formate product was then directly utilized as the fuel for a DFFC without pre-treatment.
Experimental section
SnO2/C-GDE cathode fabrication
An SnO2/C catalyst was prepared by physically mixing SnO2 (nanopowder, ≤ 100 nm, Sigma-Aldrich) and carbon black (Vulcan XC 72R, Cabot) particles in the desired mass ratios of 0.5, 1, and 3.5. Individual SnO2 and C were also used for comparison. To apply the catalyst on a tailored gas diffusion electrode (GDE), the catalyst ink was prepared by dispersing 15 mg catalyst powder in 200 μL isopropanol (>99.8%, VWR Chemicals) and 33 μL Nafion binder (10 wt% in total catalyst) (Nafion suspension, 5 wt%, Sigma-Aldrich). The ink was sonicated for 10 hours before coating onto a 2 cm2 surface of a gas diffusion layer (GDL) (H2315 I2 C6, Freudenberg) using an air brush (Evolution AL plus, Harder & Steenbeck) and drying at 45 °C for several minutes. Painting and drying were repeated until the desired total catalyst loading of ∼4 mg cm−2 was achieved.Catalyst characterization
X-ray diffraction (XRD) was used to evaluate the crystal structure of the catalyst (Philips X-ray diffractometer PW 1730 equipped with a Cu X-ray tube (Cu-Kα; λ = 0.154 nm)) operated at 40 kV and 40 mA. A scanning electron microscope (SEM, Hitachi SU-70) equipped with an energy dispersive X-ray detector (EDX, Bruker Quantax 400) was used to analyse the catalyst surface morphology and composition.The eCO2R system and electrochemical analysis
A GDE reactor fabricated using 3D printing was used to carry out the mass transfer enhanced eCO2R, as illustrated in a previous study.29 Fig. S1† shows the 3D drawing of the reactor set-up. The prepared SnO2/C was applied to the cathode with a geometric surface area 2 cm2 and the anode was a coiled platinum wire. The RE-61AP reference electrode (0.117 V vs. SHE, ALS CO., Ltd) was used for the alkaline solution. The applied potentials (vs. RE-61AP) in the three-electrode system were all converted to the reversible hydrogen electrode (RHE) according to eqn (1).| E (vs. RHE) = E (vs. RE-61AP) + 0.117 V + 0.0591 V × pH | (1) |
All the electrochemical reactions and measurements were carried out at ambient temperature and pressure using a potentiostat (Metrohm Autolab PGSTAT128N). The flow rate of CO2 (BOC 99.99%) was maintained at 15.8 ml min−1 using a flow meter (Cole-Parmer TMR1-010462). 1 M KOH (Emsure®, 85%) and 5 M KOH solutions were used as the catholyte and anolyte, respectively, separated by a cation exchange membrane (CEM) (F-950, Fumapem). In the catholyte flow mode, a peristaltic pump (120U/DM2, Watson Marlow) was used to supply fresh catholyte at a flow rate of 1.0 ml min−1 to maintain the local pH and to remove liquid products to attain reaction equilibrium. In the catholyte fixed mode, 13 ml catholyte was maintained without circulating and flowing.
Cyclic voltammetry (CV) was carried out in triplicate between −1.46 to 0.84 V (vs. RHE) with a scan rate of 10 mV s−1 to initially explore the cathode electrochemical behaviour. eCO2R was measured chronoamperometrically (CA) by recording the current at a particular applied potential over reaction time. The current density (j) was calculated based on the geometric surface area of 2 cm2 of the working electrode.
Product analysis of eCO2R
A gas chromatograph (Shimadzu Tracera GC-2010) equipped with a Barrier Ionization Discharge (BID) detector was used to analyze gas and alcoholic liquid products. A ShinCarbon ST micropacked column 80/100 (Restek) was used to quantitatively analyze permanent gases and light hydrocarbons, while a Zebron ZB-WAXplus capillary column (Phenomenex) was used for alcoholic liquids. An ion chromatograph (Eco IC, Metrohm) equipped with a “METROHM 6.1005.200” column was used for quantifying volatile fatty acids (VFA) including formic acid. Inductively coupled plasma optical emission spectrometry (ICP-OES) for the determination of inorganic anion concentration was carried out on a PerkinElmer Optima 8000 ICP-OES instrument. The faradaic efficiency (FE) and half-cell energy efficiency (EE) for each product were calculated as reported by Zhu et al.30Analysis of the direct formate fuel cell (DFFC)
The fuel cell was based on a membrane electrode assembly (MEA) as previously reported, using nickel foam supported Pd/C–CeO2 as the anode, a Tokuyama A201 anion exchange membrane, and carbon cloth coated with FeCo/C as the cathode.31 A model fuel consisting of 0.5 M HCOOK (Merck, Germany) in a 1.0 M KOH (Merck, Germany) solution was used as the control for comparison. The fuel solution was supplied to the anodic chamber at a flow rate of 1 ml min−1 and a temperature of either 25 °C or 60 °C, while the oxygen flow on the cathodic side was held at 0.1 L min−1. Fuel cell polarization curves were obtained at a scan rate of 10 mV s−1 from the open circuit voltage (OCV) to a 0.5 V cell voltage and monitored using an ARBIN BT-2000 5A 4 channel instrument (Arbin Instruments, College Station, TX, USA). Galvanostatic experiments were undertaken at a constant current density of 25 mA cm−2 while circulating 25 ml of the fuel solution. The cell potential was monitored, and the tests were stopped when the potential reached 0 V. The delivered energy for a single cell load, the faradaic efficiency for fuel utilization and energy efficiency for the complete oxidation of formate to carbonate were calculated according to a related study.32Results and discussion
Catalyst characterization
SEM was employed to characterize the morphology of the SnO2/C catalyst with a mass ratio of SnO2/C = 3.5. The fresh SnO2/C catalyst (Fig. 1a) shows a uniform mixture of SnO2 (∼100 nm irregular particles) and Vulcan XC-72 carbon black (∼50 nm spherical particles) and can clearly be distinguished from carbon black (Fig. S2†). Clusters (>300 nm) of irregular SnO2 particles are also present. The catalyst morphology changed after eCO2R as shown in Fig. 1b, with the size of Sn-based crystal now 200–500 nm. However, the shape and size of carbon particles remained unchanged. | ||
| Fig. 1 SEM images of the SnO2/C(3.5) catalyst (a) before eCO2R and (b) after 6 hours' eCO2R at −1.43 V. | ||
The XRD spectra in Fig. 2 show the crystal structure of the SnO2/C(3.5) catalyst before and after eCO2R, respectively, and that their compositions change from polycrystalline SnO2 to polycrystalline Sn due to electrochemical reduction. This was confirmed by the CV measurements displayed in Fig. S3† showing that the reduction potential for SnO2 to Sn was less negative than that for eCO2R.19
 | ||
| Fig. 2 XRD spectra of the SnO2/C(3.5) catalyst before eCO2R (blue) and after 6 hours' eCO2R at −1.43 V (orange). | ||
eCO2R activities
 | ||
| Fig. 3 Current densities of eCO2R catalysed by SnO2/C mixtures and individual SnO2 and C at a wide range of applied potentials. | ||
As shown in Fig. 3, carbon black and SnO2 both show catalytic activity for eCO2R, producing H2, CO, and formate as the major products. It is interesting to see that carbon black itself was active for eCO2R with 50% FE for the C1 product (40% formate and 10% CO) at a low overpotential of −0.63 V, but the FE for C1 decreased at higher overpotentials. At the same applied potential, SnO2 achieved much higher current densities and formate FE than carbon alone suggesting that SnO2 possesses higher activity and faster kinetics. SnO2 showed a similar trend to carbon in terms of the FE for C1 products, decreasing as the overpotential increases. The SnO2/C composites show an enhancement in both formate FE and current density compared to carbon alone at any applied potential. However, in contrast to SnO2 alone, the SnO2/C composites generally need a high overpotential (i.e., an applied potential more negative than −0.87 V) to achieve higher formate FEs. Only SnO2/C(3.5) shows a higher formate FE and current density than SnO2 alone at any potential.
Sn and SnO2 are known for their catalytic activity for formate production by eCO2R,22,23,27 which is also reflected in the results of this study. However, the formate FE showed a decreasing trend with the increasing overpotential when using SnO2 alone, whereas it was maintained or even increased with the increasing overpotential when using SnO2/C composites. One reason could be that the improved electrical conductivity of carbon facilitated the electron/charge transfer of the catalyst. For the catalytically optimum SnO2/C(3.5), the molar ratio of SnO2![[thin space (1/6-em)]](https://www.rsc.org/images/entities/char_2009.gif) :C on the reaction interface should be 1:3.6 (mol mol−1). The carbon composition could provide efficient bridges for charge transfer between SnO2 particles.
:C on the reaction interface should be 1:3.6 (mol mol−1). The carbon composition could provide efficient bridges for charge transfer between SnO2 particles.
Another function of the carbon support could be adapting the SnO2 catalyst pore structure to build a more effective reaction interface. Generally, inside the catalyst layer of a GDE, there are three pore conditions: flooded pores, wetted pores, and dry pores as illustrated by Weng et al.33 and reproduced in Fig. S5.† The dry pores are gas transport channels, but they are inactive for eCO2R due to the lack of an aqueous electrolyte and ion transfer. The flooded pores completely eliminate gas channels so they possess high mass-transport resistance for the gaseous CO2 reactant. Thus, an ideal gas–liquid–solid three-phase interface that maximizes gas, liquid, and charge transfer was assumed to be facilitated by partially wetted pores.
Measuring the double-layer capacitances of the porous electrode in aqueous solution is normally used to evaluate the electrode–electrolyte phase boundary and to investigate the pore conditions.34,35 The double-layer capacitances of 5 electrodes were measured in HClO4 solution by a reported method;36 smooth stainless-steel (SS) foil was also tested as a reference with the relative area of the electrode/electrolyte interface being 1, as presented in Fig. S6† and Table 1.
| Sample | SS foil | C | SnO2/C (0.5) | SnO2/C (1.0) | SnO2/C (3.5) | SnO2 |
|---|---|---|---|---|---|---|
| Molar ratio of SnO2/C (mol/mol) | — | — | 0.04 | 0.08 | 0.28 | — |
| Double-layer capacitance (mF) | 0.008 | 0.164 | 0.864 | 4.568 | 7.747 | 5.711 |
| Relative area of the electrode/electrolyte interface | 1 | 20.7 | 109.3 | 578.2 | 980.6 | 722.9 |
As shown in Table 1, the capacitance of carbon alone is 0.164 mF, nearly as small as that of the smooth SS foil (0.008 mF), although Vulcan carbon black is well-known for its large specific surface area > 200 m2 g−1.37,38 This indicates that hydrophobic carbon alone results in a mostly “dry pores” situation. Ahn et al.39 measured the contact angle of Nafion-bonded Vulcan XC72 to water to be ca. 150°, implying strong hydrophobicity. SnO2 alone shows a much larger double-layer capacitance of 5.711 mF, indicating good electrolyte intrusion and a large active area at the electrode/electrolyte interface, whereas the contact angle of bare SnO2 to water was 98°,40 making it relatively more hydrophilic than carbon. When mixing SnO2 and carbon in different ratios, the electrode capacitances were different. For SnO2/C(0.5) with the smallest SnO2/C molar ratio of 0.04 (mol/mol), the electrode/electrolyte interface area increased about 5-fold compared to that of carbon alone, showing the effect of the more hydrophilic SnO2 in the SnO2/C composite. With the increasing SnO2 molar ratio, the electrolyte intrusion in the porous electrode increased. SnO2/C(3.5) exhibited the largest electrode/electrolyte interface area, more than that of SnO2 alone, and also shows optimum eCO2R performance as shown in Fig. 3. This is probably because SnO2/C(3.5) mostly contains partially wetted pores that favor eCO2R. Moreover, since the size of Sn-based grains grew during eCO2R as indicated in the SEM result (Fig. 1), an appropriate amount of carbon with the morphology unaffected by electrolysis should be beneficial to maintain the pore structure in SnO2/C composites.
Since the overall current density almost linearly increased with the overpotential and the formate FE was maintained in the selected potential range by using SnO2/C composites (especially the SnO2/C(3.5)), the partial current density of formate production approximately followed a linear relationship with the applied potential as indicated in Fig. S4,† which means that formate production could be feasibly controlled by the energy input.
 | ||
| Fig. 4 (a) The yield of formate and overall CO2 conversion rate of eCO2R catalysed by SnO2/C(3.5) at specific applied potentials. (b) A comparison with related studies published in recent 5 years in terms of formate yield per millilitre of CO2 feedstock on every 1 cm2 working electrode (WE). The triangular symbols represent GDE-based results, while the round symbols represent the studies without using a GDE. | ||
To produce formate with higher concentration, a batch reactor with a static catholyte was used. Fig. 5 shows the average FE and energy efficiency (EE) of formate production using the optimum SnO2/C ratio (3.5) and operating the cell for one hour at various specific potentials. The formate FE at any potential is maintained around 73% which is lower than the results (∼80%) obtained in catholyte flow mode in Fig. 3, most probably due to the accumulated formate products affecting the reaction equilibrium and hindering the forward reaction. With the increasing overpotential, formate concentration in 1 hour electrolysis increased with decreasing EE. A concentration of 0.5 M formate could be produced at −1.43 V within 1 hour electrolysis with about 30% energy efficiency. The EE could be increased to higher than 50% when applying a lower overpotential of −0.63 V to produce a 0.5 M formate solution, but a much longer electrolysis time (9 h) would be needed as suggested in Fig. S7.†
 | ||
| Fig. 5 Formate concentration, average faradaic efficiency (FE) and energy efficiency (EE) with 1 hour electrolysis at specific applied potentials of −0.63 to −1.43 V. | ||
Performance of a direct formate fuel cell (DFFC) using formate from eCO2R
The 0.5 M formate solution produced by eCO2R, denoted as “renewable fuel”, was then filtered using a PTFE membrane with a 0.2 μm pore size and directly utilized as the fuel for a DFFC. A model fuel of 0.5 M HCOOK dissolved in 1 M KOH prepared using commercial reagents was also tested in the DFFC for comparison. Table 2 summarizes the cation and anion concentrations of the fuel determined by IC and ICP measurement.| Ion concentration (mol L−1) | |||||
|---|---|---|---|---|---|
| COOH− | K+ | CO32−/HCO3− | Sn4+/Sn2+ | pH | |
| Model fuel | 0.50 | 1.50 | — | — | 13.8 |
| Renewable fuel | 0.50 | 2.82 | 0.62 | 1.66 × 10⁻⁵ | >14 |
The potentiodynamic (VI curves) results of these two fuels at 25 °C and 60 °C are given in Fig. 6a. Power densities were calculated based on the VI curves and plotted in Fig. 6b. Galvanostatic experiments for both fuels were carried out at 25 mA cm−2 by circulating 25 ml fuel (60 °C), with the results shown in Fig. 6c. Fig. 6d shows the discharge energy, by integrating the galvanostatic curves over time until the cell voltage reaches 0 V. The parameters of DFFC performance by using these two fuels are summarized in Table 3.
 | ||
| Fig. 6 The performances of the DFFC using the model fuel and renewable fuel: (a) polarization curves at 25 °C and 60 °C, (b) power density curves at 25 °C and 60 °C, (c) galvanostatic curves at 25 mA cm−2 (60 °C) by circulating 25 ml fuel, and (d) discharge energy curves at 25 mA cm−2 (60 °C) by circulating 25 ml fuel. | ||
| Model fuel | Renewable fuel | |
|---|---|---|
| OCV (V) | 0.98 | 0.99 |
| Cell resistance (mΩ) | 72 | 84 |
| Peak power density (mW cm−2) | 118 | 92 |
| Discharge current density (mA cm−2) | 25 | 25 |
| Discharge energy (kJ) | 1.15 (25 ml) | 0.95 (25 ml) |
| Faradaic efficiency (%) | 69 | 84 |
As shown in Table 3, the OCV of the DFFC using the renewable fuel reached almost 1 V and was relatively close to the theoretical potential 1.356 V of the formate fuel cell operated at 60 °C with a formate concentration of 0.5 M and pH = 14. This theoretical potential was calculated using the Gibbs–Helmholtz equation and Nernst equation as shown in Table S3.† The renewable fuel achieved a peak power density, discharge energy, and energy efficiency of 92 mW cm−2, 0.95 kJ, and 30%, respectively. The energy efficiency of the cell is highly dependent on the current density discharge value. Discharging the cell at a very low current density will keep the cell potential high and the energy efficiency will be higher, but with a low power density. It is more practical to run the cell at a more useful and realistic current density, i.e., 25 mA cm−2 as chosen here, which can be applied to charge a mobile phone battery41 within a reasonable amount of time.
The model fuel shows a slightly higher peak power density, discharge energy, and energy efficiency than the renewable fuel. From the composition analysis in Table 2, it can be seen that even though the formate concentrations in both fuels are the same, the renewable fuel from CO2 reduction contained a high concentration of carbonate (0.62 M) and a small quantity of Sn (∼2 ppm) due to the reaction with dissolved CO2 and etching of the Sn catalyst during eCO2R. The existence of carbonate ions can shift the equilibrium of the DFFC anodic reaction (eqn (2)) and hinder the forward reaction to some extent. From the view of catalysis, the adsorption of COOHads is the rate determining step (RDS) for electrooxidation of formate over Pd (eqn (3)).42 Carbonate/bicarbonate groups are competitive adsorbates against COOHads, the chemisorption of which on the Pd surface was reported to be potential-independent,43 and can be strengthened by high coverage of carbonate/bicarbonate ions. Thus, the lower cell voltage when using the renewable fuel should most probably be caused by the large concentration of CO32−/HCO3−.
| COOH− + 3OH− → CO32− + 2H2O + 2e− | (2) |
 | (3) |
However, the faradaic efficiency of the renewable fuel reached 84% which is 15% higher than that of the model fuel. This is probably attributed to the higher alkalinity of the renewable fuel, as the formate fuel with higher alkalinity enabled higher faradaic efficiency of the DFFC.31,32 Although it was not possible to measure the pH value of the renewable fuel as it was beyond 14, the concentration of hydroxyl ions could be roughly calculated as presented in Table 4. The calculated concentration of OH− is 1.22 M, showing higher alkalinity than that of the model fuel.
| Reactions | Calculation | C OH − (M) | |
|---|---|---|---|
|
a
C: molar concentration (M or mol L−1), t: time (s), n: molar mass (mol), F: faradaic constant (96485 C mol−1), Q: quantity of electric charge (C), V: volume (L), I: current (A).
|
|||
| Original OH− | — | — | 1.0 |
| Produced OH− | CO2 + 2H2O + 2e− → HCOOH + 2OH− (4) |
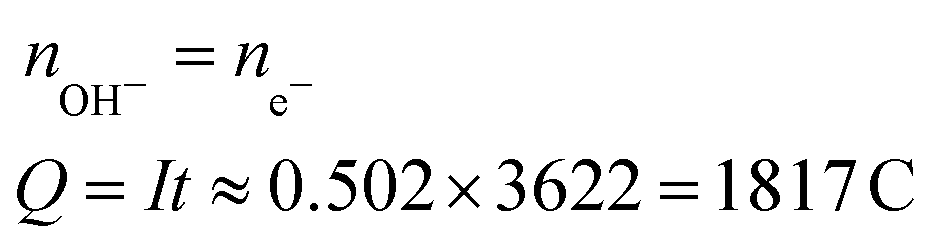
|
1.46 |
| CO2 + H2O + 2e− → CO↑ + 2OH− (5) |

|
||
| 2H2O + 2e− → H2↑ + 2OH− (6) |

|
||
| Consumed OH− | CO2 + 2OH− → CO32− + H2O (7) |
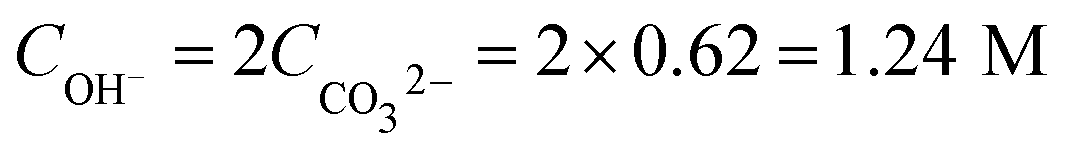
|
−1.24 |
| Net. | 1.22 | ||
When circulating 25 ml renewable fuel to achieve a more adequate fuel utilization, the overall chemical to electrical energy efficiency of the single cell reached 30%, which is comparable to those using higher concentrations of the formate fuel (CCOOH− ≥ 1 M) in stronger alkaline media (COH− ≥ 2 M).31,32 Using the DFFC, a closed loop of “electricity–formate–electricity” has been achieved. With a high overpotential of −1.27 V, the overall EE was 30% leading to an efficiency of 9% for “electricity–formate–electricity”. However, it proves the concept of converting CO2 to fuels as energy storage materials for renewable energy. Further overall efficiency can be improved by using lower overpotentials (shown in Fig. 5) and enhancing the anodic oxygen evolution reaction (OER), which is currently not optimised.
Conclusion
This work utilized a carbon black supported SnO2 catalyst to efficiently convert CO2 to formate in a gas diffusion cell with an alkaline catholyte (1 M KOH) at high current densities. An optimum SnO2/C mass ratio was obtained suggesting that the interaction of SnO2 and carbon at this ratio built an appropriate three-phase reaction interface with efficient charge and mass transfer leading to higher selectivity of formate production. The faradaic efficiency of formate under the optimized conditions could be maintained at around 80% in the potential range of −0.63 to −1.43 V (vs. RHE) and with overall current densities from 30–250 mA cm−2. This enabled controllable formate production by tuning the applied potential; the yield of formate reached as high as 3 mg min−1 cmWE−2 when applying −1.43 V cathodic potential. 0.5 M formate which was produced within 1 hour with an energy efficiency of 30% was directly used as the fuel in a direct formate fuel cell (DFFC). The fuel cell with a Pd–CeO2/C anode and FeCo/C cathode achieved a peak power density of 92 mW cm−2 and an energy efficiency of 30%. A closed loop of “electricity–formate–electricity”, which also closed the carbon recycling loop, was achieved signifying the promising future for electrochemical CO2 reduction to fuels for energy storage.Conflicts of interest
There are no conflicts to declare.Acknowledgements
The authors acknowledge the EPSRC LifesCO2R project (EP/N009746/1), EPSRC NECEM (EP/R021503/1) and NERC MeteoRR (NE/L014246/1). Hang Xiang acknowledges the Doctoral Training Awards (SAgE DTA, 2015 cohort) from the Faculty of Science, Agriculture and Engineering, Newcastle University for supporting the PhD study. The authors also acknowledge Ente Cassa di Risparmio di Firenze for funding (project EnergyLab) and the PRIN 2017 Project funded by the Italian Ministry MUIR Italy (No 2017YH9MRK). Dr Da Li is also appreciated for engaging in scientific discussion of this work. Data supporting this publication is openly available under an ‘Open Data Commons Open Database License’. Additional metadata are available at: https://doi.org/10.25405/data.ncl.9907877.v1.References
- S. Kaneco, H. Katsumata, T. Suzuki and K. Ohta, Electrochemical reduction of CO2 to methane at the Cu electrode in methanol with sodium supporting salts and its comparison with other alkaline salts, Energy Fuels, 2006, 20(1), 409–414 CrossRef CAS.
- C.-T. Dinh, T. Burdyny, M. G. Kibria, A. Seifitokaldani, C. M. Gabardo, F. P. G. de Arquer, A. Kiani, J. P. Edwards, P. De Luna and O. S. Bushuyev, CO2 electroreduction to ethylene via hydroxide-mediated copper catalysis at an abrupt interface, Science, 2018, 360(6390), 783–787 CrossRef CAS PubMed.
- S. Rasul, D. H. Anjum, A. Jedidi, Y. Minenkov, L. Cavallo and K. Takanabe, A highly selective copper–indium bimetallic electrocatalyst for the electrochemical reduction of aqueous CO2 to CO, Angew. Chem., 2015, 127(7), 2174–2178 CrossRef.
- A. K. Singh, S. Singh and A. Kumar, Hydrogen energy future with formic acid: a renewable chemical hydrogen storage system, Catal. Sci. Technol., 2016, 6(1), 12–40 RSC.
- S. Rasul, A. Pugnant, H. Xiang, J.-M. Fontmorin and H. Y. Eileen, Low cost and efficient alloy electrocatalysts for CO2 reduction to formate, J. CO2 Util., 2019, 32, 1–10 CrossRef CAS.
- S. Rasul, A. Pugnant and E. Yu, Electrochemical Reduction of CO2 at Multi-Metallic Interfaces, ECS Trans., 2018, 85(10), 57–66 CrossRef CAS.
- J. Albo and A. Irabien, Cu2O-loaded gas diffusion electrodes for the continuous electrochemical reduction of CO2 to methanol, J. Catal., 2016, 343, 232–239 CrossRef CAS.
- N. Theaker, J. M. Strain, B. Kumar, J. P. Brian, S. Kumari and J. M. Spurgeon, Heterogeneously catalyzed two-step cascade electrochemical reduction of CO2 to ethanol, Electrochim. Acta, 2018, 274, 1–8 CrossRef CAS.
- S. Fukuzumi, Production of liquid solar fuels and their use in fuel cells, Joule, 2017, 1(4), 689–738 CrossRef CAS.
- T. Vo, K. Purohit, C. Nguyen, B. Biggs, S. Mayoral and J. L. Haan, Formate: an energy storage and transport bridge between carbon dioxide and a formate fuel cell in a single device, ChemSusChem, 2015, 8(22), 3853–3858 CrossRef CAS PubMed.
- L. An and R. Chen, Direct formate fuel cells: a review, J. Power Sources, 2016, 320, 127–139 CrossRef CAS.
- Q. Wang, H. Dong and H. Yu, Development of rolling tin gas diffusion electrode for carbon dioxide electrochemical reduction to produce formate in aqueous electrolyte, J. Power Sources, 2014, 271, 278–284 CrossRef CAS.
- J. Wu, F. G. Risalvato, S. Ma and X.-D. Zhou, Electrochemical reduction of carbon dioxide III. The role of oxide layer thickness on the performance of Sn electrode in a full electrochemical cell, J. Mater. Chem. A, 2014, 2(6), 1647–1651 RSC.
- X. Lu, D. Y. Leung, H. Wang and J. Xuan, A high performance dual electrolyte microfluidic reactor for the utilization of CO2, Appl. Energy, 2017, 194, 549–559 CrossRef CAS.
- E. Irtem, T. Andreu, A. Parra, M. Hernández-Alonso, S. García-Rodríguez, J. Riesco-García, G. Penelas-Pérez and J. Morante, Low-energy formate production from CO2 electroreduction using electrodeposited tin on GDE, J. Mater. Chem. A, 2016, 4(35), 13582–13588 RSC.
- Z. Bitar, A. Fecant, E. Trela-Baudot, S. Chardon-Noblat and D. Pasquier, Electrocatalytic reduction of carbon dioxide on indium coated gas diffusion electrodes—Comparison with indium foil, Appl. Catal., B, 2016, 189, 172–180 CrossRef CAS.
- J. Chung, J. Koh, E.-H. Kim and S. I. Woo, Hierarchical Cu pillar electrodes for electrochemical CO2 reduction to formic acid with low overpotential, Phys. Chem. Chem. Phys., 2016, 18(8), 6252–6258 RSC.
- Y. Li, J. Qiao, X. Zhang, T. Lei, A. Girma, Y. Liu and J. Zhang, Rational design and synthesis of SnOx electrocatalysts with coralline structure for highly improved aqueous CO2 reduction to formate, ChemElectroChem, 2016, 3(10), 1618–1628 CrossRef CAS.
- Y. Fu, Y. Li, X. Zhang, Y. Liu, J. Qiao, J. Zhang and D. P. Wilkinson, Novel hierarchical SnO2 microsphere catalyst coated on gas diffusion electrode for enhancing energy efficiency of CO2 reduction to formate fuel, Appl. Energy, 2016, 175, 536–544 CrossRef CAS.
- T. Lei, X. Zhang, J. Jung, Y. Cai, X. Hou, Q. Zhang and J. Qiao, Continuous electroreduction of carbon dioxide to formate on Tin nanoelectrode using alkaline membrane cell configuration in aqueous medium, Catal. Today, 2018, 318, 32–38 CrossRef CAS.
- Q. Zhang, Y. Zhang, J. Mao, J. Liu, Y. Zhou, D. Guay and J. Qiao, Electrochemical Reduction of CO2 by SnOx Nanosheets Anchored on Multiwalled Carbon Nanotubes with Tunable Functional Groups, ChemSusChem, 2019, 12(7), 1443–1450 CrossRef CAS PubMed.
- F. Li, L. Chen, G. P. Knowles, D. R. MacFarlane and J. Zhang, Hierarchical mesoporous SnO2 nanosheets on carbon cloth: a robust and flexible electrocatalyst for CO2 reduction with high efficiency and selectivity, Angew. Chem., Int. Ed., 2017, 56(2), 505–509 CrossRef CAS PubMed.
- J. Yu, H. Liu, S. Song, Y. Wang and P. Tsiakaras, Electrochemical reduction of carbon dioxide at nanostructured SnO2/carbon aerogels: The effect of tin oxide content on the catalytic activity and formate selectivity, Appl. Catal., A, 2017, 545, 159–166 CrossRef CAS.
- S. Y. Choi, S. K. Jeong, H. J. Kim, I.-H. Baek and K. T. Park, Electrochemical reduction of carbon dioxide to formate on tin–lead alloys, ACS Sustainable Chem. Eng., 2016, 4(3), 1311–1318 CrossRef CAS.
- S. Guo, S. Zhao, J. Gao, C. Zhu, X. Wu, Y. Fu, H. Huang, Y. Liu and Z. Kang, Cu-CDots nanocorals as electrocatalyst for highly efficient CO2 reduction to formate, Nanoscale, 2017, 9(1), 298–304 RSC.
- R. Kortlever, I. Peters, S. Koper and M. T. Koper, Electrochemical CO2 reduction to formic acid at low overpotential and with high faradaic efficiency on carbon-supported bimetallic Pd–Pt nanoparticles, ACS Catal., 2015, 5(7), 3916–3923 CrossRef CAS.
- J. T. Feaster, C. Shi, E. R. Cave, T. Hatsukade, D. N. Abram, K. P. Kuhl, C. Hahn, J. K. Nørskov and T. F. Jaramillo, Understanding selectivity for the electrochemical reduction of carbon dioxide to formic acid and carbon monoxide on metal electrodes, ACS Catal., 2017, 7(7), 4822–4827 CrossRef CAS.
- W. Lee, Y. E. Kim, M. H. Youn, S. K. Jeong and K. T. Park, Catholyte-Free Electrocatalytic CO2 Reduction to Formate, Angew. Chem., Int. Ed., 2018, 57(23), 6883–6887 CrossRef CAS PubMed.
- H. Xiang, S. Rasul, K. Scott, J. Portoles, P. Cumpson and H. Y. Eileen, Enhanced selectivity of carbonaceous products from electrochemical reduction of CO2 in aqueous media, J. CO2 Util., 2019, 30, 214–221 CrossRef CAS.
- D. D. Zhu, J. L. Liu and S. Z. Qiao, Recent advances in inorganic heterogeneous electrocatalysts for reduction of carbon dioxide, Adv. Mater., 2016, 28(18), 3423–3452 CrossRef CAS PubMed.
- H. Miller, J. Ruggeri, A. Marchionni, M. Bellini, M. Pagliaro, C. Bartoli, A. Pucci, E. Passaglia and F. Vizza, Improving the energy efficiency of direct formate fuel cells with a Pd/C-CeO2 anode catalyst and anion exchange ionomer in the catalyst layer, Energies, 2018, 11(2), 369 CrossRef.
- L. Wang, M. Bellini, J. Filippi, M. Folliero, A. Lavacchi, M. Innocenti, A. Marchionni, H. Miller and F. Vizza, Energy efficiency of platinum-free alkaline direct formate fuel cells, Appl. Energy, 2016, 175, 479–487 CrossRef CAS.
- L.-C. Weng, A. T. Bell and A. Z. Weber, Modeling gas-diffusion electrodes for CO2 reduction, Phys. Chem. Chem. Phys., 2018, 20(25), 16973–16984 RSC.
- A. Kamat, A. Huth, O. Klein and S. Scholl, Chronoamperometric investigations of the electrode–electrolyte interface of a commercial high temperature PEM fuel cell, Fuel Cells, 2010, 10(6), 983–992 CrossRef CAS.
- P. K. Sow, Z. Lu, H. Talebian, L. Damron and W. Mérida, Double layer capacitance measurements to characterize the water intrusion into porous materials, J. Phys. Chem. C, 2016, 120(43), 24794–24802 CrossRef CAS.
- C. W. Li and M. W. Kanan, CO2 reduction at low overpotential on Cu electrodes resulting from the reduction of thick Cu2O films, J. Am. Chem. Soc., 2012, 134(17), 7231–7234 CrossRef CAS PubMed.
- M. Lázaro, L. Calvillo, V. Celorrio, J. Pardo, S. Perathoner and R. Moliner, Study and application of carbon black Vulcan XC-72R in polymeric electrolyte fuel cells, Carbon black: production, properties and uses, 2011, p. 41 Search PubMed.
- M. Bevilacqua, C. Bianchini, A. Marchionni, J. Filippi, A. Lavacchi, H. Miller, W. Oberhauser, F. Vizza, G. Granozzi and L. Artiglia, Improvement in the efficiency of an OrganoMetallic Fuel Cell by tuning the molecular architecture of the anode electrocatalyst and the nature of the carbon support, Energy Environ. Sci., 2012, 5(9), 8608–8620 RSC.
- M. Ahn, Y.-H. Cho, Y.-H. Cho, J. Kim, N. Jung and Y.-E. Sung, Influence of hydrophilicity in micro-porous layer for polymer electrolyte membrane fuel cells, Electrochim. Acta, 2011, 56(5), 2450–2457 CrossRef CAS.
- A. Kumar, A. Sanger, A. Kumar and R. Chandra, Highly sensitive and selective CO gas sensor based on a hydrophobic SnO2/CuO bilayer, RSC Adv., 2016, 6(52), 47178–47184 RSC.
- H. A. Attia, B. N. Getu, H. Ghadban and A. K. A. Mustafa, Portable solar charger with controlled charging current for mobile phone devices, Int. J. Energy Environ. Eng., 2014, 7(1), 17–24 Search PubMed.
- T. Gunji and F. Matsumoto, Electrocatalytic Activities towards the Electrochemical Oxidation of Formic Acid and Oxygen Reduction Reactions over Bimetallic, Trimetallic and Core–Shell-Structured Pd-Based Materials, Inorganics, 2019, 7(3), 36 CrossRef CAS.
- A. Berná, A. Rodes, J. M. Feliu, F. Illas, A. Gil, A. Clotet and J. M. Ricart, Structural and spectroelectrochemical study of carbonate and bicarbonate adsorbed on Pt (111) and Pd/Pt (111) electrodes, J. Phys. Chem. B, 2004, 108(46), 17928–17939 CrossRef.
Footnote |
| † Electronic supplementary information (ESI) available. See DOI: 10.1039/c9se00625g |
| This journal is © The Royal Society of Chemistry 2020 |