Increasing efficiency of perovskite solar cells using low concentrating photovoltaic systems†
Received
22nd July 2019
, Accepted 17th September 2019
First published on 18th November 2019
Abstract
Perovskite solar cell (PSC) technology is the flag bearer for the future of photovoltaics allowing unlimited possibilities for its application. This technology is currently limited by issues related to its scale-up, stability and the composition of the materials used in its preparation. Using small sized solar cells with higher efficiency under solar concentration is gaining traction as a methodology for scaling up this technology and broadening its applications. However, this has only been reported in devices with size <1 mm2 neglecting the series resistance of the device. Here, we report the performance of a 9 mm2 PSC at varying solar concentration levels and correlate it with the series resistance of the solar cell. The n–i–p structured device using a triple cation perovskite absorber with a mesoporous titanium oxide/SnO2 layer as the electron transporting layer and Spiro-OMeTAD as the hole transporting material achieved a peak efficiency of 21.6% under 1.78 Suns as compared to the 21% obtained under 1 Sun (1000W m−2) and AM1.5G. We further boosted the power output up to 15.88 mW under 10.7 Suns compared to the 1.88 mW obtained under 1 Sun; however this results in an actual efficiency drop of the PSC owing to the device series resistance. Further, we investigated the impact of the increasing solar cell temperature at higher concentration levels and identified the influence of series resistance on the performance of the PSC. Our work identifies the potential of concentrating photovoltaics and highlights the challenges and makes recommendations for future development.
Introduction
Photovoltaic (PV) technology has continued to progress rapidly through its growing deployment and the innovation of new materials. While the global progress of silicon PVs continues to dominate the industry,1 advanced materials such as perovskite solar cells (PSCs) are reaching new levels of efficiency making them a potential alternative.2 The growth in PSC research is primarily due to its excellent material properties and ease of manufacture. The idea of directly printing a high-efficiency PSC on any given substrate in a variety of shapes and sizes at lower costs opens opportunities for many new PV products and markets that were previously not possible.3
The theoretical Shockley–Queisser limit imposed by the material band-gap dictates the electrical efficiency4 of single junction solar cells. Multi-junction solar cells overcome these limits by using a group of materials stacked together utilising different parts of the solar spectrum and accumulating the extracted power.5 Operating solar cells under concentrated sunlight results in an improvement in their efficiency.6 This is particularly due to the high photon density incident on the solar cell which drives larger quasi-Fermi-level splitting in the semiconductor absorber material delivering a higher output voltage and photovoltaic efficiency of the solar cells.7
By varying the ratio between I and Br in MAPb(IxBr1−x),8 the bandgap (Eg) of the perovskite material can be tuned from around 1.6 to 2.3 eV and this can be further reduced to ∼1.2 eV using Sn compositions making them a very good candidate for fabricating multi-junction solar cells.9 The other advantage of these materials is the high absorption coefficient10 and long charge carrier diffusion length.11–13 Whilst higher efficiencies (>21%) for single junction PSCs have been reported, these are predominantly found in smaller sized PSCs (<1 mm2). The use of concentrator photovoltaics (CPVs) with a 0.81 mm2 sized PSC14 further increased the efficiency levels up to 23.1% opening up a new line of research combining PSCs with low concentrating photovoltaic (LCPV) technologies. However, the tasks of identifying the effectiveness of this methodology and overcoming the practical challenges remain. In the present study we investigate the performance of a 9 mm2 PSC at low levels of solar concentration and create a new approach that can be realised for designing PSCs for LCPV systems. Here, we experimentally evaluate the performance of PSCs both on their own and when coupled with an optical concentrator at different incident illumination levels and varying solar cell temperatures. The optical concentrator used in this study is a kaleidoscope with a breaking-symmetry top (12 mm × 12 mm) and a truncated pyramid geometry and square exit aperture (3 mm × 3 mm). The PSC used in this study is a triple cation based n–i–p structured perovskite solar cell.15,16 We observe that the electrical power is magnified under concentrated sunlight. However, the internal series resistance of the solar cell tends to decrease the fill factor substantially. While varying the illumination intensity levels we observe that there exists an optimum solar concentration level for the solar cell which is a function of its series resistance. Therefore, it will be possible to design a solar cell for low concentration levels through the reduction of the series resistance.
PSCs under solar concentration
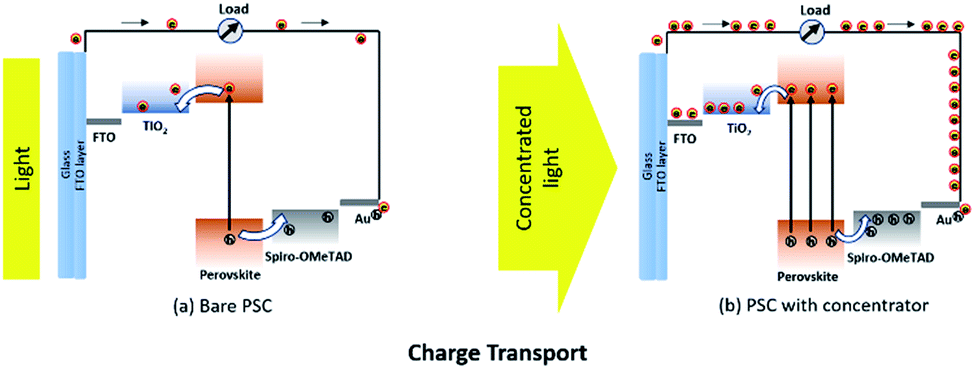
Hybrid organic–inorganic lead halide perovskites can combine the functions of light absorption, n-type conduction and p-type conduction. Fig. 1(a) and (b) describe the absorption of light leading to the creation of free carriers in a bare PSC and a PSC with a solar concentrator. Charge separation can then occur through injection of photo-generated electrons into TiO2 nanoparticles and injection of holes into a hole-transporting material (HTM)17,18 such as Spiro-OMeTAD.19 Concentrated light has a larger number of photons, which accelerates electron generation in the perovskite absorber hence increasing the photo current proportional to the solar concentration (Fig. 1(b)).
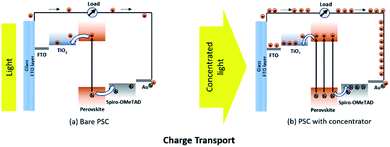 |
| | Fig. 1 Operating principle of perovskite solar cells: charge transport of (a) a bare perovskite solar cell (PSC) and (b) a PSC with a concentrator. | |
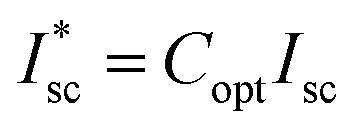
At a cell voltage of zero, the cell current reaches a maximum limiting value, which is called the short-circuit current (Isc). So, for the short-circuit current of a solar cell under solar concentration 
| |  | (1) |
Copt is the optical concentration ratio and
eqn (2) explains the lumped equivalent circuit
20 model and the application of Kirchoff's rules for this,
| | 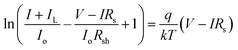 | (2) |
where
IL is the current at load,
Io is the saturation current,
Rs is the series resistance and
Rsh is the shunt resistance. For a high-quality solar cell with negligible parasitic losses due to series and shunt resistances,
Rs = 0 and
Rsh = ∞;

is the open circuit voltage (under concentrated light),
k is the Boltzmann constant, and
T is the absolute temperature. In an ideal case, the short-circuit current is equal to the light-induced current at load:
Isc =
IL.
| | 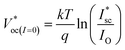 | (3) |
| |  | (4) |
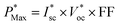
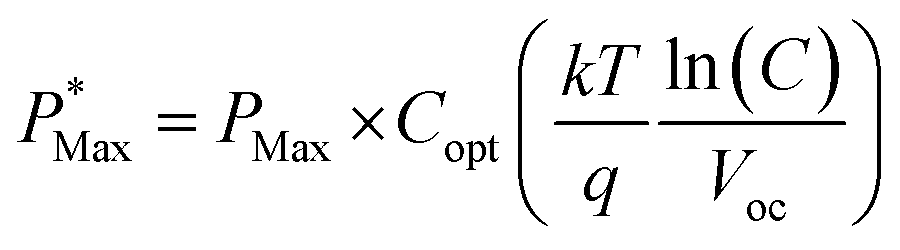
The  as shown in eqn (3) increases logarithmically with the increasing photocurrent if the dark current remains constant at the cell operating temperature and can be related to the open circuit voltage at standard illumination levels of 1000 W m−2 and 25 °C as per eqn (4). Using the above equations, the maximum power that can be extracted from the solar cell can be expressed as
| |  | (5) |
| |  | (6) |
Methods
Perovskite fabrication
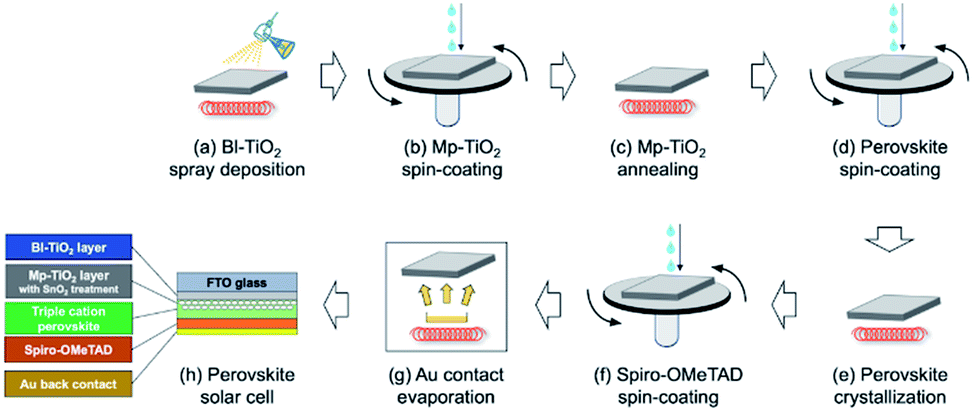
The fabrication process of a solar cell and the final architecture are shown in Fig. 2. To prepare the perovskite solar cell, an FTO glass substrate was cleaned by sonication with acetone and ethanol for 15 minute each in order.21 Then, a blocking titanium oxide layer (Bl-TiO2) was deposited by spray pyrolysis deposition of a precursor solution (1 mL of titanium diisopropoxide bis(acetylacetonate) (Sigma-Aldrich) in 15 mL of ethanol) and annealed at 450 °C as shown in Fig. 2(a).21 To deposit a meso-porous titanium oxide layer (Mp-TiO2), a dispersed titanium oxide solution (1 g of PST30NRD (Dyesol) in 8 mL of ethanol) was spun on the Bl-TiO2 as shown in Fig. 2(b) and annealed at 500 °C (Fig. 2(c)). Subsequently, a tin-oxide layer was deposited by spin-coating of a precursor solution (0.1 M tin chloride(IV) in deionized water) and annealed at 100 °C for 10 min and 190 °C for 1 h in air, and then UV/O3 treatment was performed for 15 min. After that, the perovskite layer was formed by the spin-coating method (Fig. 2(d)). The perovskite solution was prepared with excess lead ((FAPbI3)0.875(MAPbBr3)0.125(CsPbI3)0.1) by mixing lead iodide (1.2 M), lead bromide (0.15 M), formamidinium iodide (1.0 M), methylammonium bromide (0.15 M), and cesium iodide (0.13 M) in DMF/DMSO (4![[thin space (1/6-em)]](https://www.rsc.org/images/entities/char_2009.gif) :1 v/v%). The spin-coating process was set as a two-step program with 2000 and 5000 rpm for 10 and 30 seconds, respectively. 100 μL of chlorobenzene was dropped on the substrate 10 seconds before spin-coating was complete.22 After that, the perovskite layer was crystalized by annealing at 100 °C for 1 hour (Fig. 2(e)). To deposit Spiro-OMeTAD as the hole-transport material (HTM), an HTM solution was spun on the perovskite layer at 4000 rpm for 30 seconds (Fig. 2(f)). The HTM solution consists of 80 mg of Spiro-OMeTAD diluted in 1023 μL of CB, 23 μL of a Li-TFSI solution (196 mg of Li-TFSI in 379 μL of acetonitrile), and 18 μL of a Co-complex solution (99 mg of Co-complex in 263 μL of acetonitrile).23 Finally, a 70 nm Au back-contact layer was evaporated on the Spiro-OMeTAD layer (Fig. 2(g)) to complete the perovskite solar cell (Fig. 2(h)).
:1 v/v%). The spin-coating process was set as a two-step program with 2000 and 5000 rpm for 10 and 30 seconds, respectively. 100 μL of chlorobenzene was dropped on the substrate 10 seconds before spin-coating was complete.22 After that, the perovskite layer was crystalized by annealing at 100 °C for 1 hour (Fig. 2(e)). To deposit Spiro-OMeTAD as the hole-transport material (HTM), an HTM solution was spun on the perovskite layer at 4000 rpm for 30 seconds (Fig. 2(f)). The HTM solution consists of 80 mg of Spiro-OMeTAD diluted in 1023 μL of CB, 23 μL of a Li-TFSI solution (196 mg of Li-TFSI in 379 μL of acetonitrile), and 18 μL of a Co-complex solution (99 mg of Co-complex in 263 μL of acetonitrile).23 Finally, a 70 nm Au back-contact layer was evaporated on the Spiro-OMeTAD layer (Fig. 2(g)) to complete the perovskite solar cell (Fig. 2(h)).
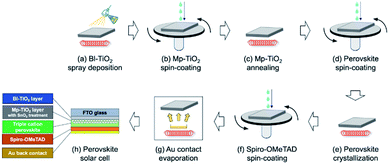 |
| | Fig. 2 Manufacture of the PSC: (a) Bl-TiO2 spray deposition, (b) Mp-TiO2 spin coating, (c) Mp-TiO2 annealing, (d) perovskite spin coating, (e) crystallisation, (f) Spiro-OMeTAD spin coating, and (g) Au-contact evaporation. (h) Perovskite solar cell showing the different layers. | |
CPV assembly
The concentrator unit was fabricated by incorporating an optical element on top of the solar cell and bonding it using a UV curable optical adhesive. Enough adhesive is applied on the base of the concentrator unit and then it is immediately placed on the solar cell surface. The alignment of the optical element above the solar cell is very crucial and special precautions are taken while bonding it with the PSC. Once aligned, the bond is cured using a low power UV lamp. The bond sets within a few minutes of UV exposure. Room temperature curing was carried out to avoid any misalignment of the concentrator and the cell. The top surface of the solar cell is then completely masked to prevent any excessive light reaching areas other than the active area of the solar cell under study.
Experimental
The performance of the PSC and the CPV unit was analysed using a Newport Class-A solar simulator at EPFL. The solar simulator consisted of a xenon lamp and a filter to provide an AM1.5G solar spectrum. The simulator was calibrated using a silicon reference cell (LCE-50, Centronics) with a KG3 filter. This solar simulator had a maximum illumination area of 100 × 100 mm for a nominal working distance of 200 mm. It had a uniformity of irradiation higher than 96%. In the I–V measurement, the PSC was illuminated via the solar simulator and was connected to a continuously changing external applied voltage. The CPV unit was characterised at different angles of incidence using a special setup at a constant illumination level to achieve variable intensities of light on the PSC. A digital protractor was used to adjust the different slope angles of the device under test. The IV curve measurement of the CPV unit and the PSC was then carried out at 1000 W m−2 and was also carried out by varying the intensity levels of the incoming solar radiation to generate a few other sets of illumination levels on the PSC. Further, we investigated the stability of the PSC under 1 Sun and a high irradiance of 1.78 Suns and the full AM1.5G spectrum for a duration of 50 hours. A T-type thermocouple was attached to the PSC device. The thermocouple conformed to the IEC 584 Class 1 standard and was capable of measuring temperatures ranging from −75 °C to +260 °C. Two thermocouples were used in this study to monitor the ambient and the PSC temperature simultaneously. The measurements were logged using an OMEGA RDXL2SD temperature recorder in equal time intervals of 30 seconds. The CPV unit was exposed to a constant source of light with an intensity of 1000 W m−2 and the I–V characteristics were recorded at different device temperatures. An ORIEL IQE 200B based at EPFL was used to carry out the EQE experiments. The IQE 200B incorporated a patented detector geometry using a beam splitter, allowing for simultaneous measurement of the EQE and the reflective losses to quantify the IQE. This measurement was performed by shining a monochromatic probe beam onto the sample and recording the photocurrent generated as a function of wavelength. EQE analysis of the bare PSC and the CPV unit was undertaken using IPCE adhering to the IEC 60904-8:2014 standard to understand the changes in spectral response of the PSC when coupled with the optical element.
Results and discussion
Device performance
The devices shown in Fig. 3(a) and (b) were characterised under a standard AM1.5G spectrum and different illumination levels of 1000 W m−2, 530 W m−2, 390 W m−2 and 160 W m−2. The I–V characteristics are shown in Fig. 3(c) and (d). At 1000 W m−2 the maximum power of the CPV unit was found to be 15.88 mW, which is very high compared to the 1.88 mW obtained via the PSC (8.4 times higher). The short-circuit current density was found to be 263.5 mA cm−2, which is 10.73 times higher than that of the non-concentrating counterpart. The reason for the lower power ratio compared to the short-circuit current ratio is due to the reduction in fill factor of the CPV unit compared to the non-concentrating counterpart. While the fill factor remains constant for the PSC (0.81), it is found to vary considerably for the CPV unit dropping to 0.57 at 1000 W m−2. It is interesting to note that the fill factor of the CPV unit increases from 0.57 to 0.79 as the illumination levels are reduced on the CPV unit indicating that the cell's performance depends on the intensity levels more than on its distribution which remained constant in all the previous scenarios. The drop in FF also reduces the maximum power of the CPV unit.
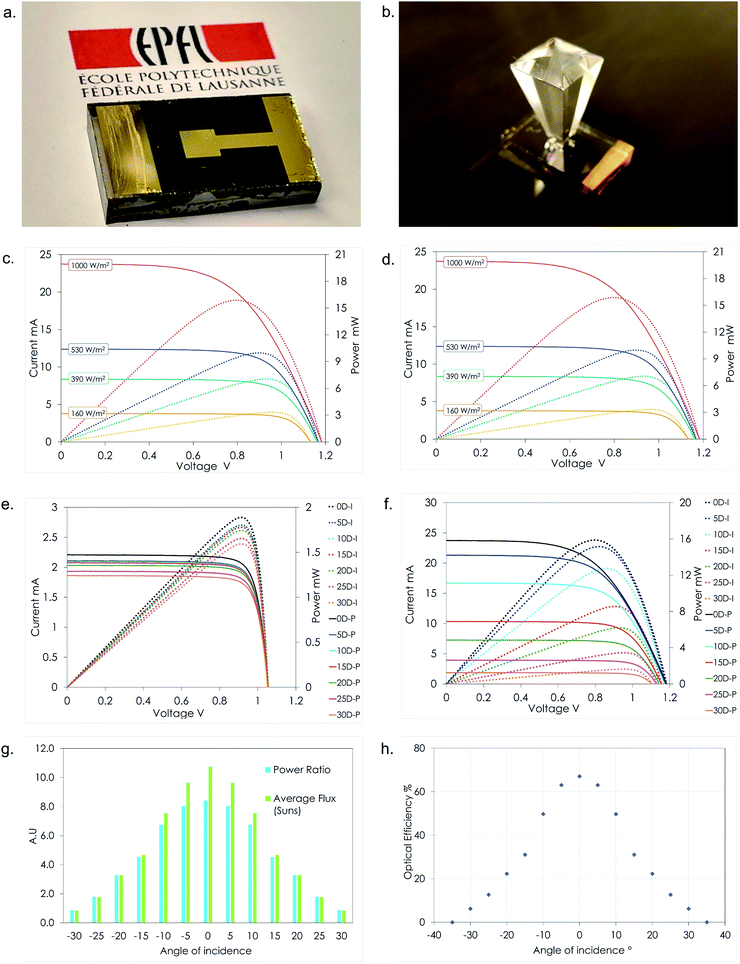 |
| | Fig. 3 (a) Zoomed image of the back side of the PSC used in the present study. (b) PSC with a concentrator. (c) IV characteristics of the PSC measured at 1000 W m−2, 530 W m−2, 390 W m−2 and 160 W m−2. (d) IV characteristics of the CPV unit measured at 1000 W m−2, 530 W m−2, 390 W m−2 and 160 W m−2. (e) IV characteristics of the PSC measured at different inclinations at 1000 W m−2. (f) IV characteristics of the CPV unit measured at different inclinations at 1000 W m−2. (g) Power ratio and average flux on the CPV at different angles of incidence. (h) Optical efficiency of the CPV at different angles of incidence. | |
The PSC and the CPV unit were characterised at different angles of incidence at a constant illumination level. Since the incident angle of irradiation from the solar simulator could not be changed, different incident angles were realised by changing the inclination of the CPV unit and the PSC using a special setup. The results of this experiment are shown in Fig. 3(e) and (f). The impact of the reduced illumination at different angles of incidence can clearly be seen on the CPV unit. Both the Isc and the Voc drop with the increasing angle of incidence. Using the above equations, the maximum power that can be extracted from the solar cell can be expressed as
| |  | (7) |
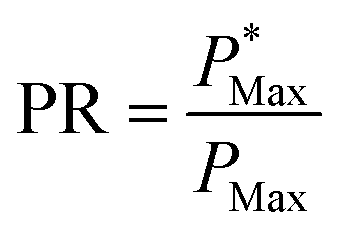
The power ratio (PR) is the ratio of the maximum power output of the CPV unit when compared to the PSC under similar operating conditions. Unlike the optical concentration ratio, the power ratio considers the change in fill factor and open circuit voltage in a CPV unit compared to the PSC counterpart while exposed to similar conditions. The power ratio reveals the performance of the concentrator in a CPV module in terms of the increase in the total power output. Fig. 3(g) shows the power ratio and the optical concentration ratio (average intensity) at different angles of incidence.
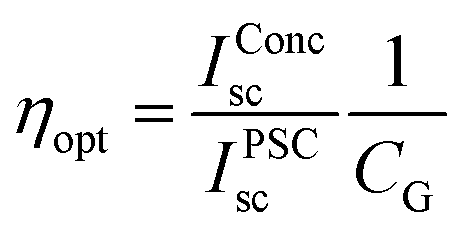
The power ratio of the CPV unit is found to vary between 1 and 10.7 for different incidence angles. A maximum power ratio of 8.4 is found to occur at a 0° incidence angle and the lowest is recorded for 1000 W m−2 at a 30° inclination. Beyond the 30° inclination, the performance drops sharply and decreases to a nil value. The optical efficiency estimates the fraction of incident energy on the aperture that reaches the solar cell considering all the possible losses. The light rays incident on the aperture of the CPV unit will enter the optical element with a surface reflection component at the air–glass interface; further they are refracted within the optical element and reach the solar cell surface due to total internal reflection. The optical efficiency ηopt is calculated in terms of the Isc of the PSC and CPV unit using eqn (8) and is shown in Fig. 3(h)
| |  | (8) |
where
IConcsc is the short-circuit current of the CPV unit,
IPSCsc is the short-circuit current of the PSC and
CG is the geometrical concentration ratio.
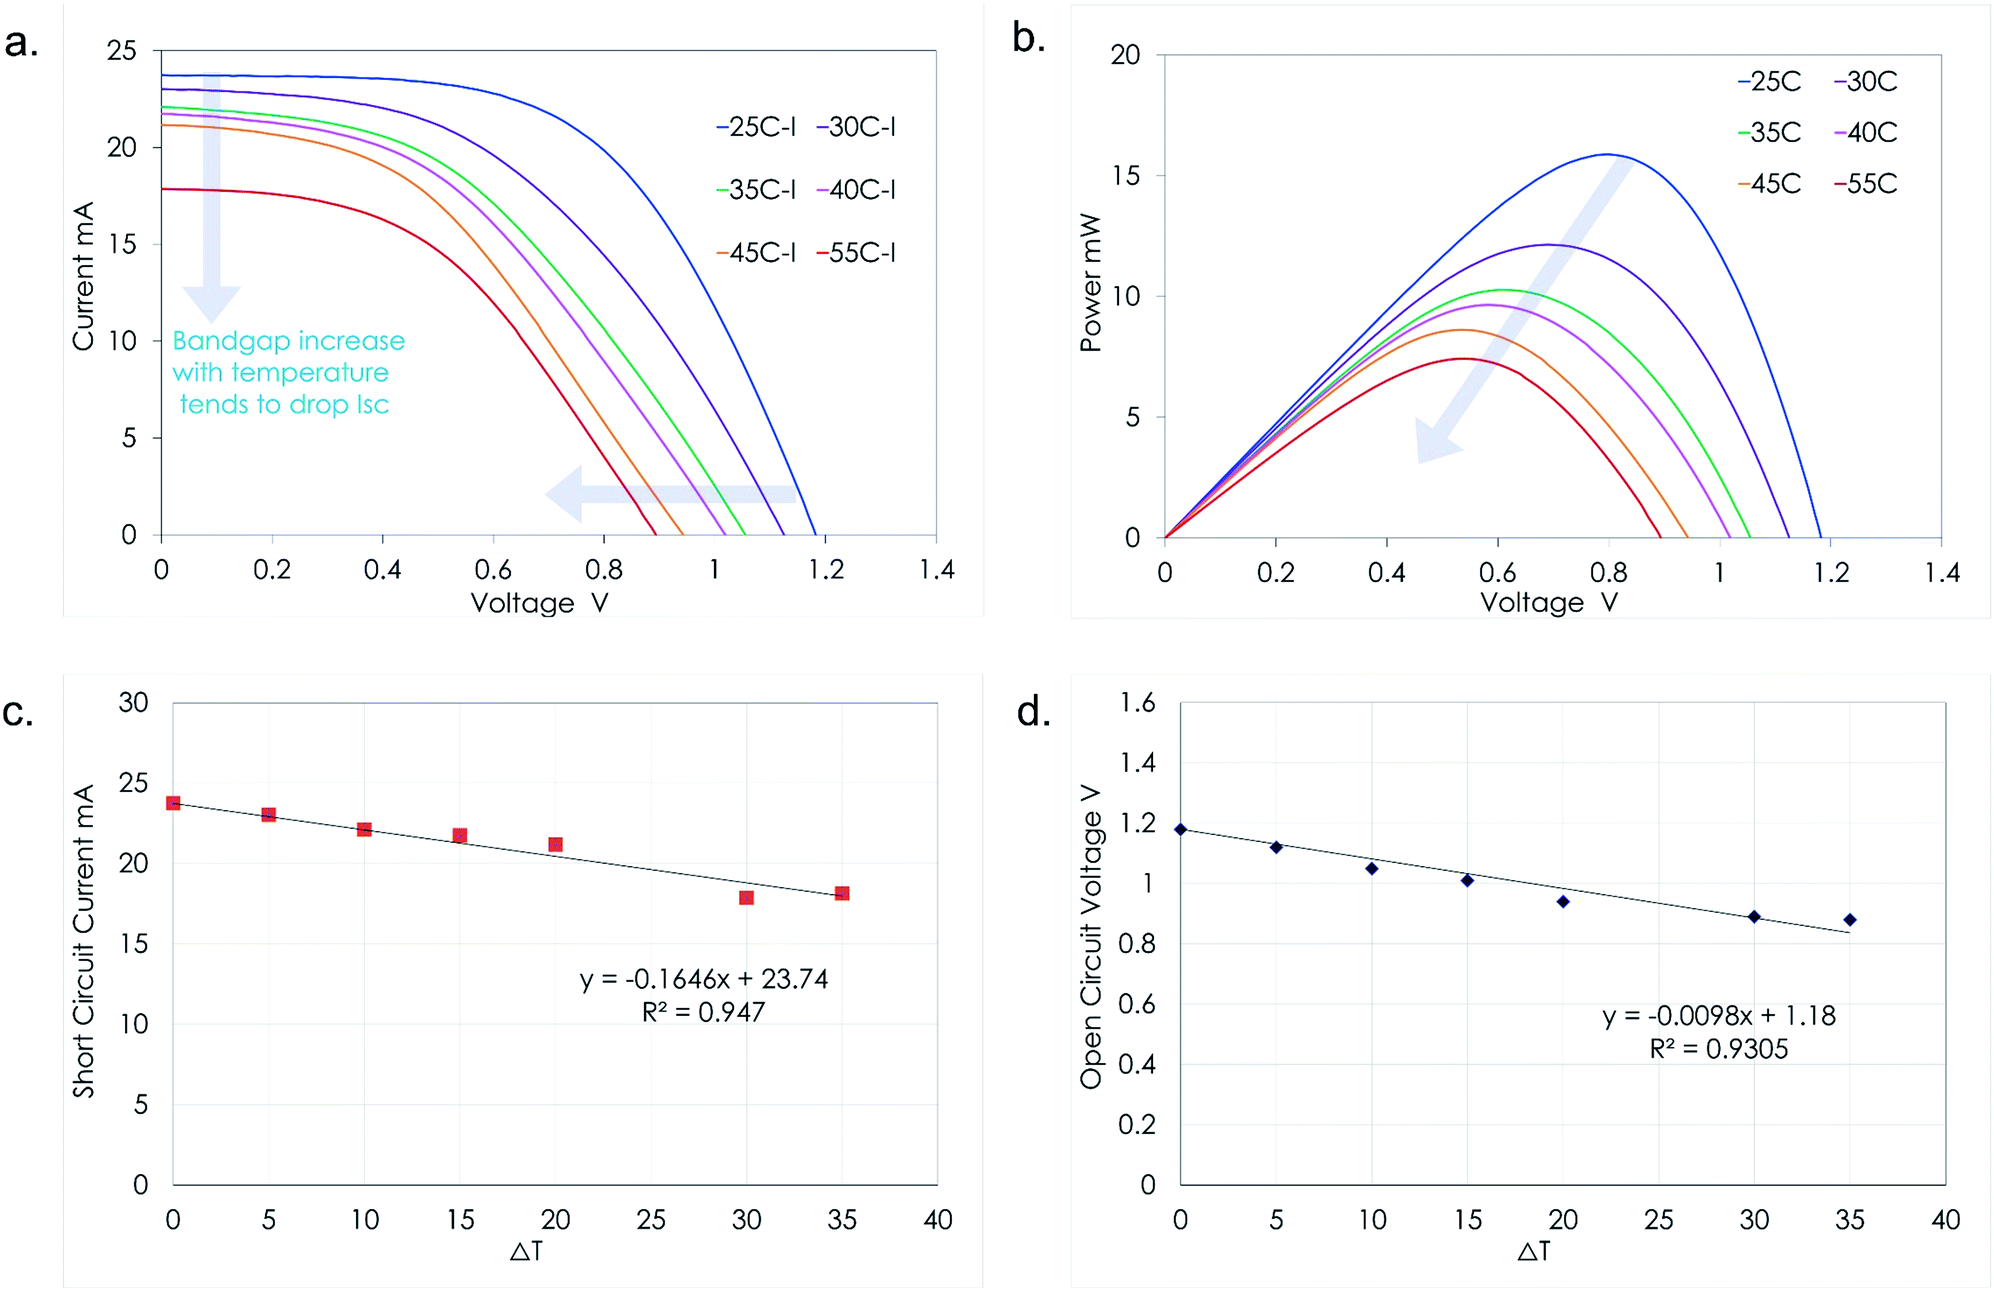
Impact of temperature
The key challenge for unlocking the potential of PSCs is the development of perovskite-based PVs combining high PCE and operational stability.24 The temperature-induced performance losses caused due to the incoming solar radiation impact the charge extraction and decrease the overall performance of the system. Previous studies highlighted that the mismatch in thermal expansion coefficients25 and low fracture energy of layers in perovskite solar cells can impact the mechanical integrity of perovskite solar cells. Solar concentration increases the number of photons incident on the solar cell, but at the same time it accelerates the temperature rise within the PSC. The generated current of a solar cell is a function of the number of photons hitting the photovoltaic surface. The higher illumination in CPV devices amplifies the photo-generated current which converts the incident radiation to electrical power. Simultaneously, the dark current being dissipative in nature tries to reduce the solar cell efficiency. The dark current which is a function of the solar cell operating temperature reduces the Voc and thereby reduces the power output from the system. The temperature sensitivity of open-circuit voltage is highly critical as it accounts for 80–90% of the temperature coefficient of efficiency.26 For the first time, we investigate the impact of temperature on a PSC coupled to a solar concentrator as shown in Fig. 5(a) and (b).
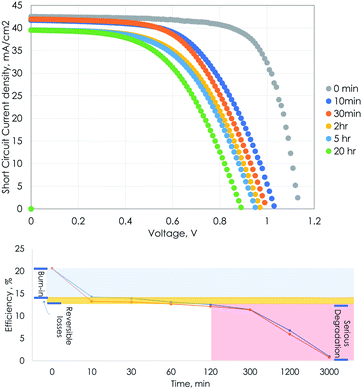 |
| | Fig. 4
J–V curves of the PSC under 1.78 Suns and the corresponding efficiency over time. | |
 |
| | Fig. 5 Electrical characteristics of the PSC with a concentrator at different temperatures: (a) I–V characteristics at varying temperatures; both the Isc and Voc can be seen to decrease with the increasing temperature. (b) P–V characteristics at varying temperatures; both the MPP and FF can be seen to decrease with the increasing temperature. (c) Variation of short-circuit current with the temperature differential. (d) Variation of open circuit voltage with the temperature differential. | |
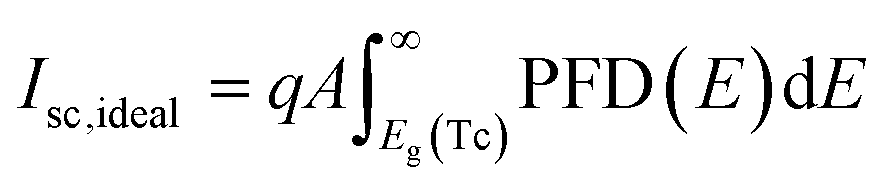
The short-circuit current depends on the number of photons that can create an electron–hole pair. With solar concentration, the number of photons incident on the solar cells is amplified as is the short-circuit current when examined at 25 °C. However, being exposed continuously to concentrated illumination tends to raise the temperature of the device. It is very well known that the short-circuit current density increases slightly with temperature solar cell/device. This occurs fundamentally because of the decrease in bandgaps with temperature for most semiconductors; however this is not true for PSCs. For perovskites, the bandgap (Eg) increases with temperature and hence the temperature dependence of Isc,ideal is negative. The short-circuit current can be expressed as the product of an ideal number of photons incident on the solar cell per unit area of the solar cell known as Photon Flux Density (PFD).
| | | Isc = Isc,ideal × fcIsc | (9) |
| | 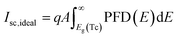 | (10) |
Under concentrated light this can be further represented as
| | | Isc = Copt × Isc,ideal × fc | (11) |
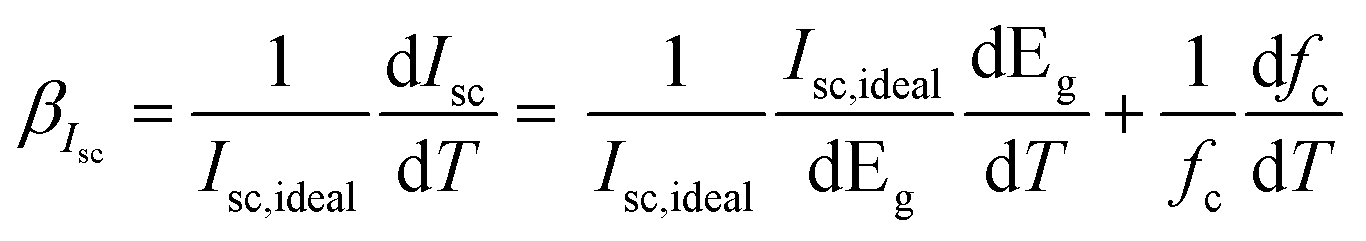
The temperature dependence of Isc,ideal is related to on the temperature dependence of the bandgap. It is important to note that minor changes in Eg can influence the output current, measured with a solar simulator, if the bandgap is near a peak of the spectrum. The temperature coefficient26 of the short-circuit current can then be described as follows:
| | 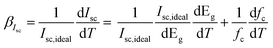 | (12) |
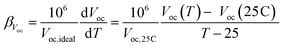
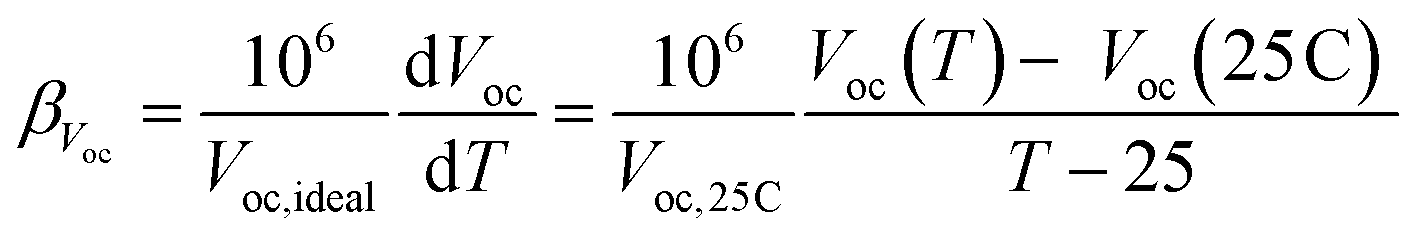
Fig. 5(c) shows the variation of the short-circuit current with respect to the temperature. It can be clearly noted that the Isc decreases with the increasing temperature linearly. We observe that the Isc drops by 0.16 mA with every degree rise in temperature. The average βIsc estimated under concentration (10.7x) is found to be −6513 ppm °C−1. The temperature coefficient of the open circuit voltage27 can then be described as shown in eqn (13).
| |  | (13) |
The average βVoc estimated under concentration (10.7x) is found to be −9402 ppm °C−1. Fig. 5(d) shows the variation of the Voc with respect to the temperature dropping by 9.8 mV with every degree rise in temperature.
Device stability
Although PSC devices are progressing towards excellent efficiencies, their lack of stability under prolonged solar irradiation remains unresolved and seriously undermines their commercialization. Further, a lack of standard reporting procedures for PSCs often makes it difficult to understand the different mechanisms responsible for the degradation. A previous study14 used liquid nitrogen to cool the PSC and maintain its temperature while performing the stability tests, which cannot be regarded as a true representative of the real-time operating performance assessment of the device. In order to assess the stability of the PSC under solar concentration, we measure the JV characteristics by placing the device under concentrated sunlight (1.78 Suns applying forced convection using a cooling fan) and present the results in Fig. 4. We observed that the performance sharply drops during the initial 10 min period due to the non-recoverable permanent degradation of the device28 occurring at the beginning of its operation also referred to as the device burn-in. We observed good stability under 1.78 Sun irradiance for 5 hours, with the cell maintaining 81% of its efficiency after the burn-in period. Further, we measured the device after resting in the dark and observed an average 0.75% gain in the device efficiency. A more serious degradation of the device is seen after this, further leading to the end of its life.
Interpretation, validity and practical relevance of the results
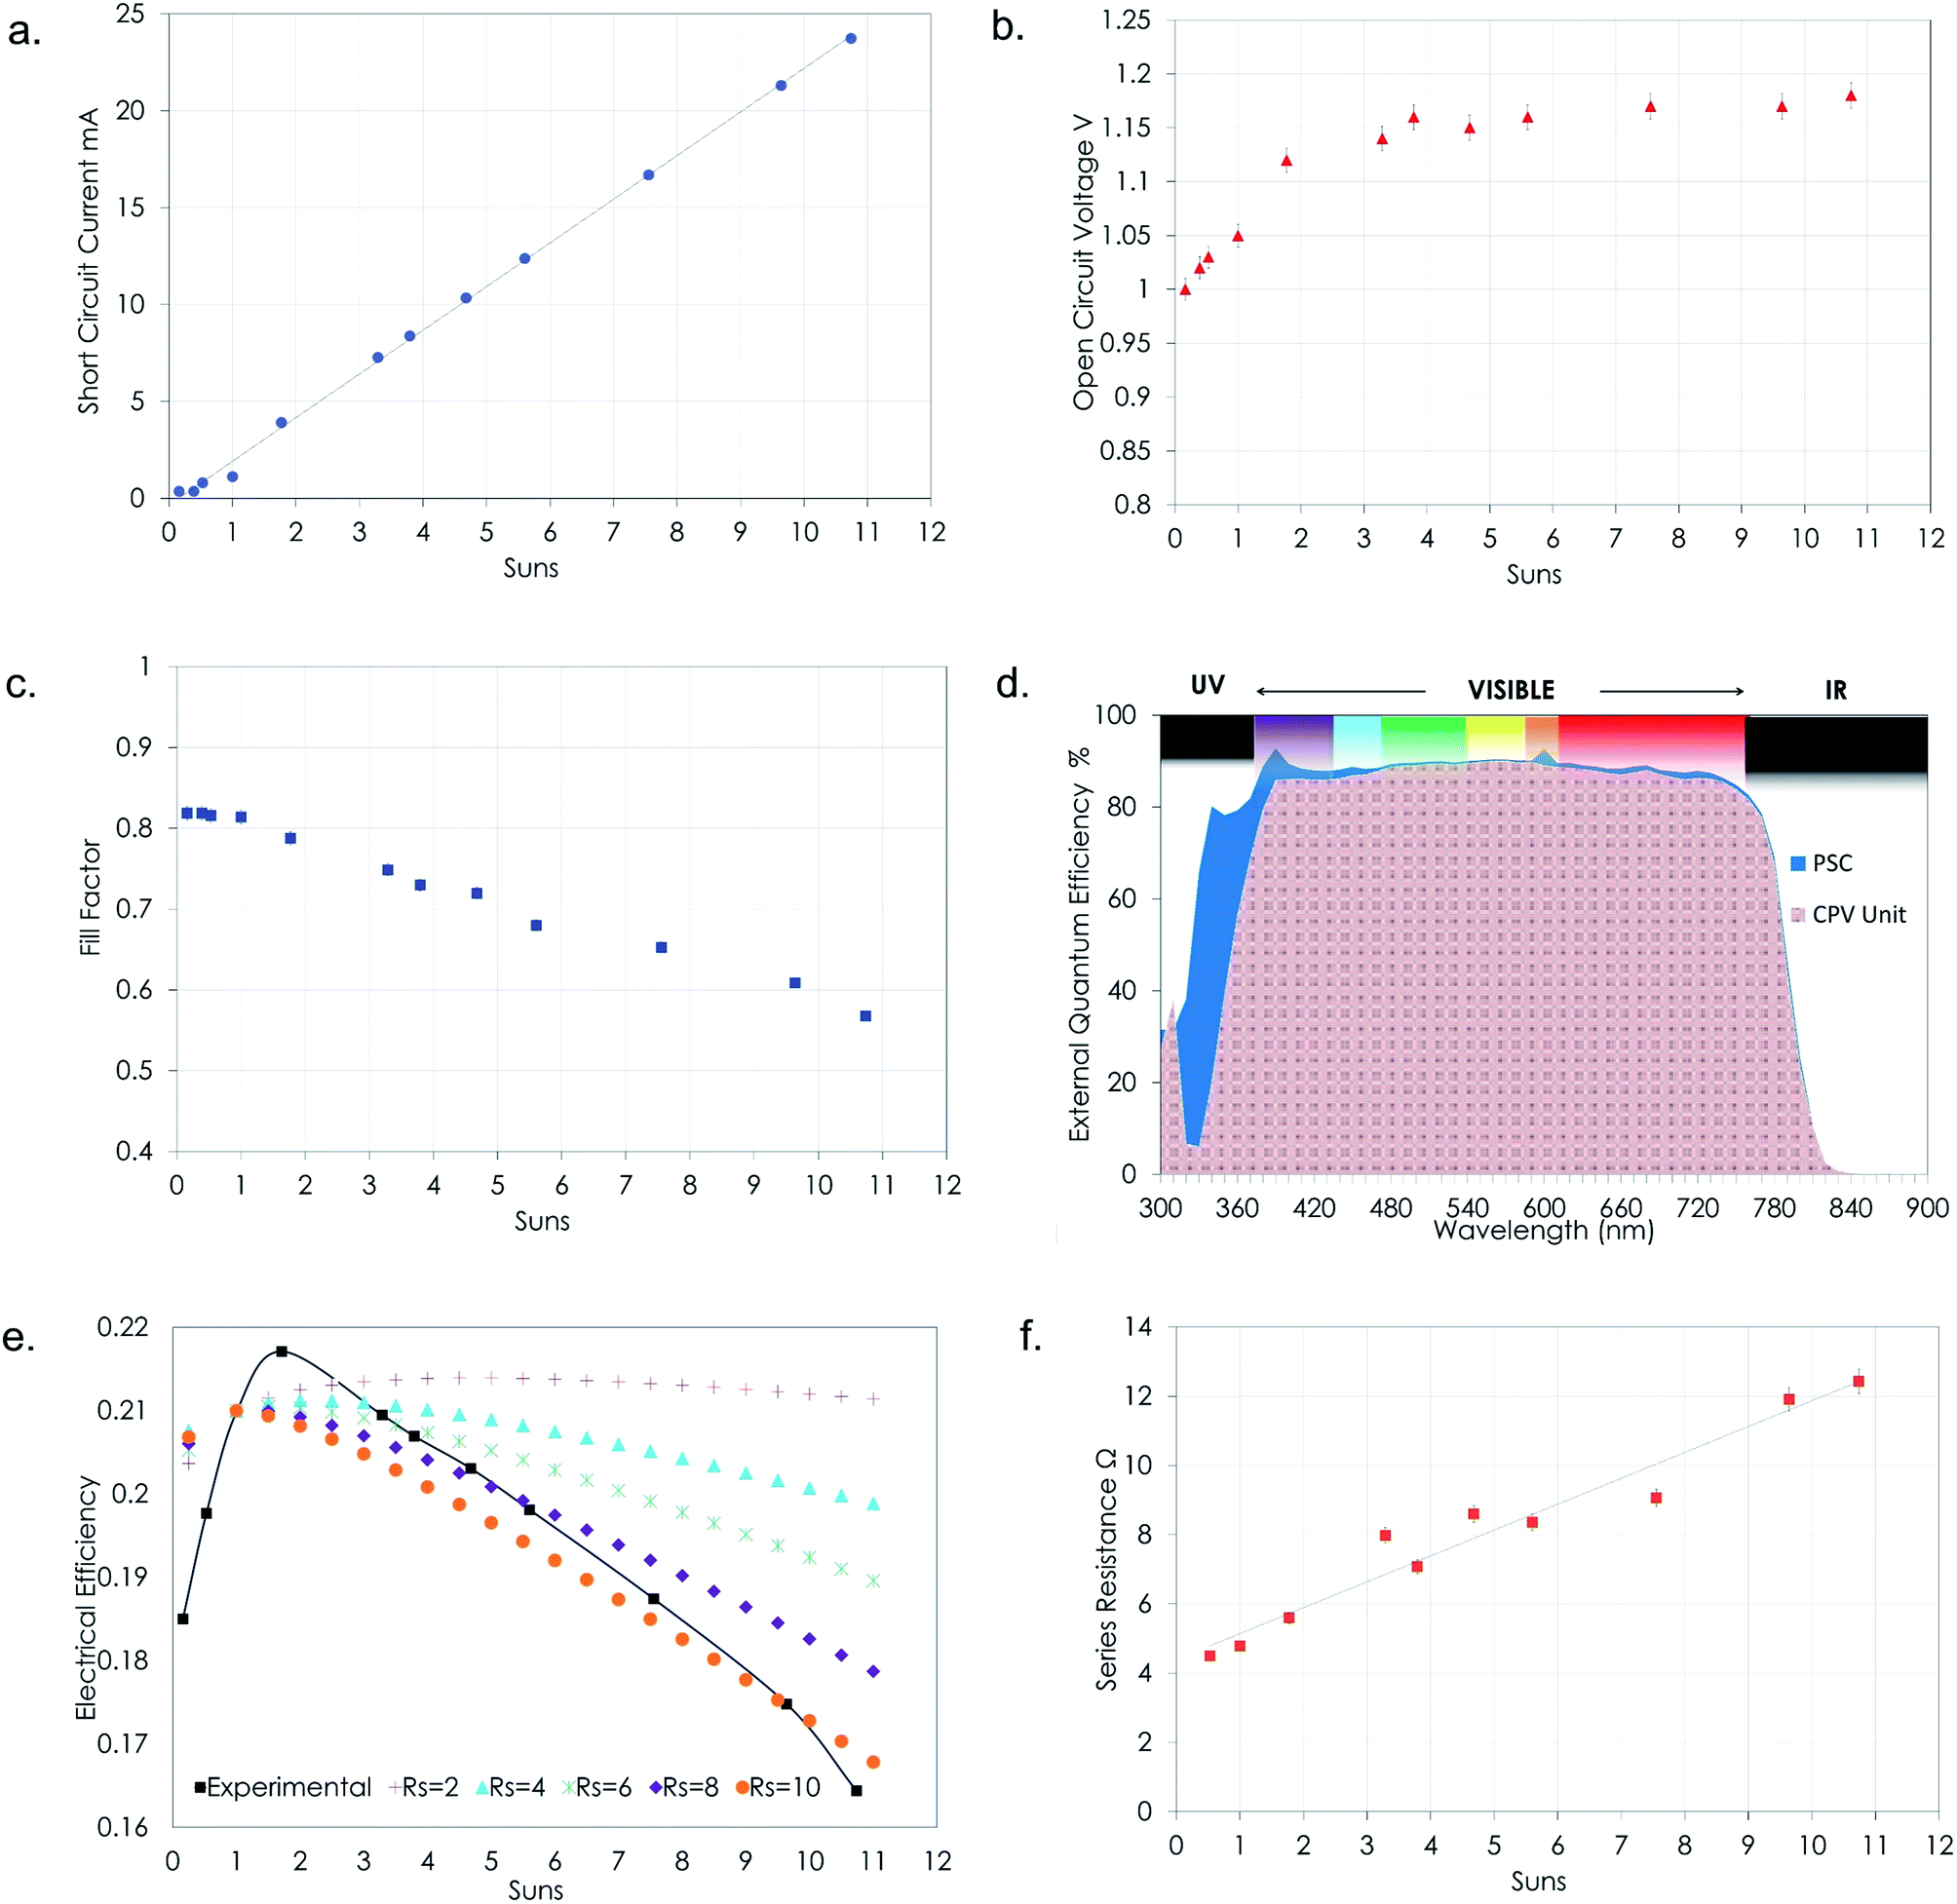
The short-circuit current varies linearly with the increasing illumination levels on the PSC in accordance with eqn (1). The variation of the short-circuit current and the open circuit voltage as a function of the number of Suns incident on the PSC is shown in Fig. 6(a) and (b), respectively. The Isc varies linearly with the increasing levels of solar concentration and the open circuit voltage increases exponentially with increasing solar concentration. The rate of increase of the Voc can be observed to be maximum between 1 and 2 Suns and further stabilises at higher concentration levels reaching a maximum value of 1.18 V at 10.8 Suns.
 |
| | Fig. 6 Comparison of (a) Isc, (b) Voc, and (c) FF. (e) Electrical efficiency of perovskite solar cell devices measured under various solar concentrations (up to 10.8 Suns). (d) EQE of the PSC and the CPV unit. (f) Impact of series resistance on the electrical efficiency of the PSC under different solar concentrations. | |
The fill factor is a good measure of the PSC's electrical performance; however, it is important to note that the fill factor drops under solar concentration as shown in Fig. 6(c). This is primarily due to the increased current being drawn from the PSC along with the internal series resistance of the cell. It must also be noted that the PSC used in the current study was not optimised for use under higher solar concentration and the fill factor drop originates from the resistance from the charge extraction layers, contact resistance between the internal layers of the solar cell and parasitic resistance in the fluorine-doped tin oxide (FTO) transparent conducting electrodes.
The quantum efficiency is the ratio of the number of carriers collected by the solar cell to the number of photons of a given energy incident on the solar cell. It is usually expressed as a function of either wavelength or energy. If all photons of a certain wavelength are absorbed and the resulting minority carriers are collected, then the quantum efficiency at that wavelength is unity. The external quantum efficiency (EQE)/internal photon conversion efficiency (IPCE) includes the effect of optical losses such as transmission and reflection. Due to the absorption of light by the material of the optical element, the EQE of the CPV module drops in the range of 300–400 nm as shown in Fig. 6(d). The decrease in EQE of the CPV unit over the range of 400 nm to 1100 nm is due to the optical losses in the concentrator which are negligible. The absorption of light below 400 nm reduces the performance of the system substantially. On integrating the EQE for both the bare PSC and the PSC with the optical element it was found that the EQE drops by 8.1% due to the absorption by the glass material of which a 7% drop occurs in the spectral range below 400 nm.
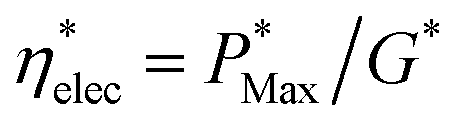
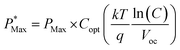
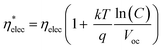
The electrical efficiency is defined as the ratio of maximum cell power output to the incoming irradiance on the solar cell surface. For the PSC under solar concentration, the electrical efficiency may be expressed as  where G* is the incoming concentrated solar radiation.
| |  | (14) |
| |  | (15) |
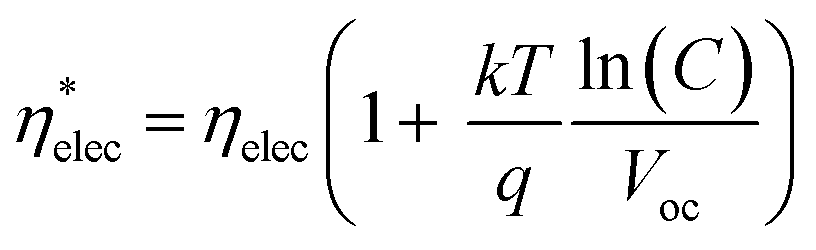
Efficiency increases between 1 and 2 Suns and then drops as shown in
Fig. 6(e). This indicates that the PSC under study would perform optimally at 1.78 Suns. The efficiency at 1 Sun for the champion device was 21%; the same cell was attached to an optical element and the efficiency was found to increase to 21.6% at 1.78 Suns. Ideally, the electrical efficiency of the cell should increase with solar concentration, but losses caused due to internal resistances tend to decrease the power output substantially, which means there is an optimum level of solar concentration that a specific design of solar cell would be able to achieve.
Impact of series resistance
Theoretically, the efficiency of a solar cell increases slightly under concentrated light as shown in eqn (10) because both output and input energies increase due to solar concentration. However, this is not the case as losses occur within the solar cell due to the cell series resistance (Rs). The higher the series resistance, the greater the power losses. The power lost through the PSC can be expressed as| | 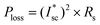 | (16) |
Under solar concentration the amount of current produced is magnified as is the I2R loss experienced by the solar cell. Under solar concentration the effect of series resistance is correlated linearly with the collection efficiency of the concentrator, meaning increased resistive losses with increasing concentration. The power loss increases with the increasing solar concentration, and hence there is a drop in the fill factor as seen earlier with increasing solar concentration. We have used the measured parameters in the present study obtained at 1 Sun to evaluate the impact of series resistance on the electrical efficiency of the PSC.
In Fig. 6(e) it can clearly be seen that the electrical efficiency improves with increasing solar concentration and decreasing series resistance. The PSC can have different optimum concentration ratios of operation depending on its series resistance. The lower the series resistance the higher the optimum solar concentration under which the device can operate. An important point to note however is that the series resistance of the PSC may change at different concentration levels as it can be a function of the operating solar cell temperature which changes significantly when exposed to solar concentration. A detailed study on these aspects needs to be carried out in the future.
The performance of the perovskite solar cells under solar concentration becomes limited due to the series resistance of the device. One of the major contributors to the series resistance is the transparent conductive oxide layer of the FTO glass which has an electrical conductivity of 1 × 10⁻⁴ to 1 × 10⁻³ Ω cm. The resistive losses tend to decrease the fill factor of the PSC, hence limiting its overall performance. In perovskite solar cells the conductivity of the FTO film can, in principle, be enhanced by increasing the thickness, but this will decrease its transparency and can again impact the PSC performance. Varying the light intensity incident on a solar cell changes all the solar cell parameters and the impact of series and shunt resistances. Fig. 6(f) shows the variation of the series resistance with illumination intensity. Increasing the light intensity on the PSC tends to vary the series resistance of the cell between 4.37 and 12.5 Ω. The electrical efficiency of the PSC is also plotted with the increasing illumination levels. It was observed that the series resistance linearly increased with solar concentration.
Future directions
Solar cell design
In the PSC the current flows across its active area; the resistive losses are simply calculated by multiplying current, sheet resistance and distance from the active area to the metal electrode. An effective method to decrease the impact of the series resistance could be to form a bass bar and finger on the FTO glass to decrease the distance as an advanced design architecture for perovskite solar cells with a concentrator. Further, depositing conductive grids and/or constructing interconnected unit cells can be used to reduce resistance.
Stability and reliability
Although using established methods from the silicon PV industry in reporting the performance indices of PSCs might seem like a good idea, it is important to note that the degradation mechanisms and their impact are very different in PSC devices compared to those of silicon. Understanding the key differences and their potential is crucial for the success of the PSC industry. The PV module qualification tests (e.g., IEC 61215 and IEC 61646) have an element of UV Preconditioning that requires 15 kW h m−2 of total UVA + UVB exposure (280–400 nm) and at least 5 kW h m−2 of UVB exposure (280–320 nm). This equates to exposure to a standard AM 1.5G light source over several months. This might have a limited impact on the silicon PV panels but can prove to be significantly detrimental for PSC devices.
The TiO2-based electron transport layer widely used in high-performance PSCs causes photocatalytic degradation under UV illumination. Optical materials with UV-stabilisers that restrict the UV part of solar spectrum (<400 nm) from reaching the solar cell can be employed to construct solar concentrators. This method can partially reduce the power output from the cell due to the change in its transparency levels but can potentially improve the stability of the device under outdoor conditions. Further studies need to be carried out to explore these impacts.
Upscaling
Smaller sized PSCs have been shown to have higher efficiencies and it would be sensible to assemble systems comprising several smaller sized solar cells. Further, coupling them with other applications such as building integration may open new markets for this technology whilst solving its issues of scalability. LCPVs have a very huge advantage in terms of their application in climates with lower DNI and diffuse radiation which makes them capable of being widely adopted. The broader applications not only mean a larger market but LCPVs using PSCs also take advantage of lower material costs and significantly lower energy payback time. Further, employing this technique with added advantages of an aesthetically pleasing architecture may prove to find wider adoption in the market.
Conclusions
This paper discussed the performance of a PSC under different sets of illumination conditions and solar cell temperatures. The short-circuit current density of the PSC tends to linearly increase with the incoming solar radiation levels. The open circuit voltage of the solar cell also changes logarithmically with increasing illumination levels. However, the fill factor of the device was found to drop substantially which reduces the efficiency of the solar cell and the maximum power that could be extracted from the device. The temperature dependences of both the short-circuit current and the open circuit voltage were also investigated under low concentration levels. It is suggested that modifications to the device series resistance would be the pathway needed for further development of the PSC for LCPV systems.
Conflicts of interest
There are no conflicts to declare.
Acknowledgements
H. B. acknowledges the support of the EPSRC IAA (EP/K022156/1) and is thankful to the Group for Molecular Engineering of Functional Materials at EPFL for hosting him. The project leading to this application has received funding from the European Union's Horizon 2020 research and innovation programme under grant agreement No. 763989 of the APOLO project.
References
-
Fraunhofer Institute for Solar and Systems, Photovoltaics Report, Germany, 2018 Search PubMed.
- H. J. Snaith, Nat. Mater., 2018, 17, 372–376 CrossRef CAS PubMed.
- C. Ballif, L.-E. Perret-Aebi, S. Lufkin and E. Rey, Nat. Energy, 2018, 3, 438–442 CrossRef.
- W. Shockley and H. J. Queisser, J. Appl. Phys., 1961, 32, 510–519 CrossRef CAS.
- P. Löper, S.-J. Moon, S. Martín de Nicolas, B. Niesen, M. Ledinsky, S. Nicolay, J. Bailat, J.-H. Yum, S. De Wolf and C. Ballif, Phys. Chem. Chem. Phys., 2015, 17, 1619–1629 RSC.
- H. Baig, K. C. Heasman and T. K. Mallick, Renewable Sustainable Energy Rev., 2012, 16, 5890–5909 CrossRef.
- H. Cotal, C. Fetzer, J. Boisvert, G. Kinsey, R. King, P. Hebert, H. Yoon and N. Karam, Energy Environ. Sci., 2009, 2, 174–192 RSC.
- M. I. H. Ansari, A. Qurashi and M. K. Nazeeruddin, J. Photochem. Photobiol., C, 2018, 35, 1–24 CrossRef CAS.
- T. C.-J. Yang, P. Fiala, Q. Jeangros and C. Ballif, Joule, 2018, 2, 1421–1436 CrossRef CAS.
- S. De Wolf, J. Holovsky, S. J. Moon, P. Löper, B. Niesen, M. Ledinsky, F. J. Haug, J. H. Yum and C. Ballif, J. Phys. Chem. Lett., 2014, 5, 1035–1039 CrossRef CAS PubMed.
- A. Mei, X. Li, L. Liu, Z. Ku, T. Liu, Y. Rong, M. Xu, M. Hu, J. Chen, Y. Yang, M. Grätzel and H. Han, Science, 2014, 345, 295–298 CrossRef CAS PubMed.
- D. B. Mitzi, S. Wang, C. A. Feild, C. A. Chess, A. M. Guloy, M. K. Nazeeruddin, E. W. Diau, C. Y. Yeh, S. M. Zakeeruddin and M. Grätzel, Science, 1995, 267, 1473–1476 CrossRef CAS PubMed.
- S. D. Stranks, G. E. Eperon, G. Grancini, C. Menelaou, M. J. P. Alcocer, T. Leijtens, L. M. Herz, A. Petrozza and H. J. Snaith, Science, 2013, 342, 341–344 CrossRef CAS PubMed.
- Z. Wang, Q. Lin, B. Wenger, M. G. Christoforo, Y.-H. Lin, M. T. Klug, M. B. Johnston, L. M. Herz and H. J. Snaith, Nat. Energy, 2018, 3, 855–861 CrossRef CAS.
- K. T. Cho, G. Grancini, Y. Lee, E. Oveisi, J. Ryu, O. Almora, M. Tschumi, P. A. Schouwink, G. Seo, S. Heo, J. Park, J. Jang, S. Paek, G. Garcia-Belmonte and M. K. Nazeeruddin, Energy Environ. Sci., 2018, 11, 952–959 RSC.
- M. Saliba, T. Matsui, J.-Y. Seo, K. Domanski, J.-P. Correa-Baena, M. K. Nazeeruddin, S. M. Zakeeruddin, W. Tress, A. Abate, A. Hagfeldt and M. Grätzel, Energy Environ. Sci., 2016, 9, 1989–1997 RSC.
- J. C. Brauer, Y. H. Lee, M. K. Nazeeruddin and N. Banerji, J. Phys. Chem. Lett., 2015, 6, 3675–3681 CrossRef CAS PubMed.
- S. Ameen, M. A. Rub, S. A. Kosa, K. A. Alamry, M. S. Akhtar, H.-S. Shin, H.-K. Seo, A. M. Asiri and M. K. Nazeeruddin, ChemSusChem, 2016, 9, 10–27 CrossRef CAS.
- S. Fantacci, F. De Angelis, M. K. Nazeeruddin and M. Grätzel, J. Phys. Chem. C, 2011, 115, 23126–23133 CrossRef CAS.
- H. Baig, N. Sarmah, K. C. Heasman and T. K. Mallick, Sol. Energy Mater. Sol. Cells, 2013, 113, 201–219 CrossRef CAS.
- H. Kanda, A. Uzum, H. Nishino, T. Umeyama, H. Imahori, Y. Ishikawa, Y. Uraoka and S. Ito, ACS Appl. Mater. Interfaces, 2016, 8, 33553–33561 CrossRef CAS PubMed.
- K. T. Cho, S. Paek, G. Grancini, C. Roldán-Carmona, P. Gao, Y. Lee and M. K. Nazeeruddin, Energy Environ. Sci., 2017, 10, 621–627 RSC.
- J. Burschka, N. Pellet, S.-J. Moon, R. Humphry-Baker, P. Gao, M. K. Nazeeruddin and M. Grätzel, Nature, 2013, 499, 316–320 CrossRef CAS.
- G. Grancini, C. Roldán-Carmona, I. Zimmermann, E. Mosconi, X. Lee, D. Martineau, S. Narbey, F. Oswald, F. De Angelis, M. Graetzel and M. K. Nazeeruddin, Nat. Commun., 2017, 8, 15684 CrossRef CAS PubMed.
- R. Cheacharoen, N. Rolston, D. Harwood, K. A. Bush, R. H. Dauskardt and M. D. McGehee, Energy Environ. Sci., 2018, 11, 144–150 RSC.
- M. A. Green, Prog. Photovoltaics, 2003, 11, 333–340 CAS.
- J. A. Schwenzer, L. Rakocevic, R. Gehlhaar, T. Abzieher, S. Gharibzadeh, S. Moghadamzadeh, A. Quintilla, B. S. Richards, U. Lemmer and U. W. Paetzold, ACS Appl. Mater. Interfaces, 2018, 10, 16390–16399 CrossRef CAS PubMed.
- Q. Wang, N. Phung, D. Di Girolamo, P. Vivo and A. Abate, Energy Environ. Sci., 2019, 12, 865–886 RSC.
Footnote |
| † Electronic supplementary information (ESI) available. See DOI: 10.1039/c9se00550a |
|
| This journal is © The Royal Society of Chemistry 2020 |
Click here to see how this site uses Cookies. View our privacy policy here. 
 Open Access Article
 This Open Access Article is licensed under a
  *a,
Hiroyuki
Kanda
b,
Abdullah M.
Asiri
c,
Mohammad Khaja
Nazeeruddin
*a,
Hiroyuki
Kanda
b,
Abdullah M.
Asiri
c,
Mohammad Khaja
Nazeeruddin

 is the open circuit voltage (under concentrated light), k is the Boltzmann constant, and T is the absolute temperature. In an ideal case, the short-circuit current is equal to the light-induced current at load: Isc = IL.
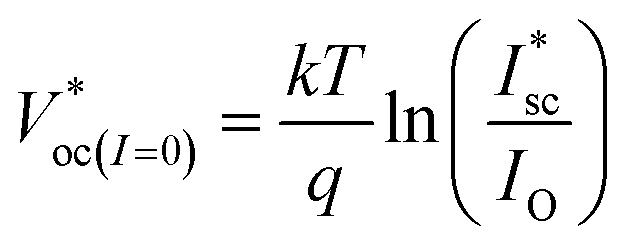
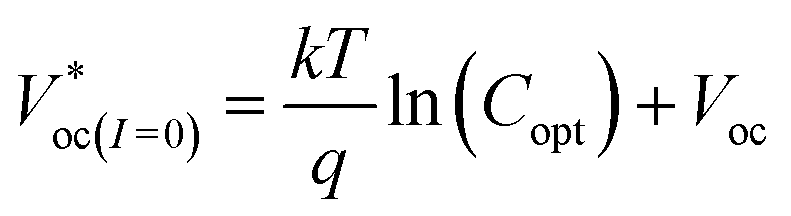
 as shown in eqn (3) increases logarithmically with the increasing photocurrent if the dark current remains constant at the cell operating temperature and can be related to the open circuit voltage at standard illumination levels of 1000 W m−2 and 25 °C as per eqn (4). Using the above equations, the maximum power that can be extracted from the solar cell can be expressed as


 where G* is the incoming concentrated solar radiation.