
 Open Access Article
 This Open Access Article is licensed under a Creative Commons Attribution-Non Commercial 3.0 Unported Licence
Pyroelectric power generation from the waste heat of automotive exhaust gas
Juyoung
Kim
a,
Satoru
Yamanaka
a,
Ichiro
Murayama
a,
Takanori
Katou
a,
Tomokazu
Sakamoto
a,
Takuro
Kawasaki
b,
Tatsuo
Fukuda
c,
Tohru
Sekino
 d,
Tadachika
Nakayama
e,
Masatoshi
Takeda
e,
Masaaki
Baba
e,
Hirohisa
Tanaka
f,
Kazuya
Aizawa
b,
Hideki
Hashimoto
d and
Yoonho
Kim
*a
d,
Tadachika
Nakayama
e,
Masatoshi
Takeda
e,
Masaaki
Baba
e,
Hirohisa
Tanaka
f,
Kazuya
Aizawa
b,
Hideki
Hashimoto
d and
Yoonho
Kim
*a
aAdvanced Research and Development Department, Daihatsu Motor Co., Ltd, 3000, Yamanoue, Ryuo, Gamo, Shiga 520-2593, Japan. E-mail: Yoonho_Kim@dk.daihatsu.co.jp; Fax: +81-74-857-1064; Tel: +81-74-857-1685
bJ-PARC Center, Japan Atomic Energy Agency, 2-4 Shirane Shirakata, Tokai, Naka, Ibaraki 319-1195, Japan
cMaterials Sciences Research Center, Japan Atomic Energy Agency, 1-1-1, Kouto, Sayo, Hyogo 679-5148, Japan
dThe Institute of Scientific and Industrial Research (ISIR), Osaka University, Mihogaoka 8-1, Osaka, Ibaraki 567-0047, Japan
eNagaoka University of Technology, 1603-1, Kamitomioka, Nagaoka, Niigata 940-2188, Japan
fKwansei Gakuin University, 2-1 Gakuen, Sanda, Hyogo 669-1337, Japan
First published on 24th December 2019
Abstract
Waste heat is a potentially exploitable energy source but remains a problem awaiting a solution. To explore solutions for automobile applications, we investigate pyroelectric power generation from the temperature variation of exhaust gas using a novel electro-thermodynamic cycle. Niobium-doped lead zirconate titanate stannate (PNZST) ceramics were applied as pyroelectric materials, and their structural characteristics were investigated. In the driving cycle assessments (JC-08) using real exhaust gas, the maximum power generated was identified as 143.9 mW cm−3 (777.3 J L−1 per 1 cycle) over a temperature range of 150–220 °C and an electric field of 13 kV cm−1. The net mean generating power of the total driving cycle was 40.8 mW cm−3, which is the most enhanced result in our power generating systems to date and 314 times greater than our first report. Materials with sharp transition behaviors with the temperature and electric field are worthy of study with regard to pyroelectric energy harvesting materials, and their corresponding crystal and domain structures were investigated to optimize performance.
Introduction
Research and interest in types of energy conversion that would otherwise be overlooked have increased as the energy demands of society continue to grow. In 2011, approximately 58% of the energy consumed was lost as waste heat across the world, and that in the transportation sector accounted for 34.5% of the total loss.2 In automobiles, a given amount of waste heat is lost from exhaust gas, and the temperature of exhaust gas varies temporally corresponding to the cycling of an internal combustion engine or driving conditions. Such a temporal temperature variation (dT/dt, where t is time) can be utilized as thermoelectric energy, which can be harvested to be converted into electrical energy,3–6 known as the pyroelectric effect (PE).7Pyroelectric materials that exhibit a PE have a polar symmetry in their crystal structure, leading to spontaneous polarization (PS). As the temperature increases, these materials undergo phase transitions from the ferroelectric phase to the paraelectric phase as PS changes. The decrease in polarization of the materials can be recovered as electrical work from the thermodynamic cycle. Perovskite structures such as Pb(Zr,Ti)O3 (PZT) and Pb(Mg1/3Nb2/3)O3–PbTiO3 (PMN–PT)-based ceramics have been utilized in many studies for energy harvesting due to their outstanding electrical properties. Pandya et al.8 reported that a maximum energy density and power density of 1.06 J cm−3 and 526 W cm−3, respectively, were scaled for ferroelectric PMN–PT thin films from the implementation of Ericsson cycles. Kim et al.1 reported the practical application of pyroelectric power generation using PZT-based ceramics for exhaust gas of an automobile by using a novel electro-thermodynamic cycle.
To improve the efficiency of power generation, the development of pyroelectric materials through diversified analysis is required. In this report, following previous studies,1,9–12 a practical assessment of the power generation performance was conducted using an engine dynamometer, for which we obtained considerably improved results with niobium-doped lead zirconate titanate stannate (Pb0.99Nb0.02(Zr0.637Sn0.273Ti0.09)0.98O3, PNSZT) ceramics. This material was characterized and investigated with respect to its phase structure and transition behavior in the cycles to discuss the proper direction of materials research in the pyroelectric power generation system.
Novel electro-thermodynamic cycle
From the perspective of the temperature and electric field, the electro-thermodynamic cycle using the PE can be described by the loop of the electric displacement of materials. Fig. 1 illustrates the electrical polarization (D) change in a pyroelectric material with electric field (E) at high temperature (TH) and low temperature (TL). The Olsen cycle proposed by Olsen et al.13–16 consists of an A–B–C–D loop using two isoelectric and two isothermal processes. The generating power density (PD, W L−1) in this system can be calculated according to the formula| PD = NDf |
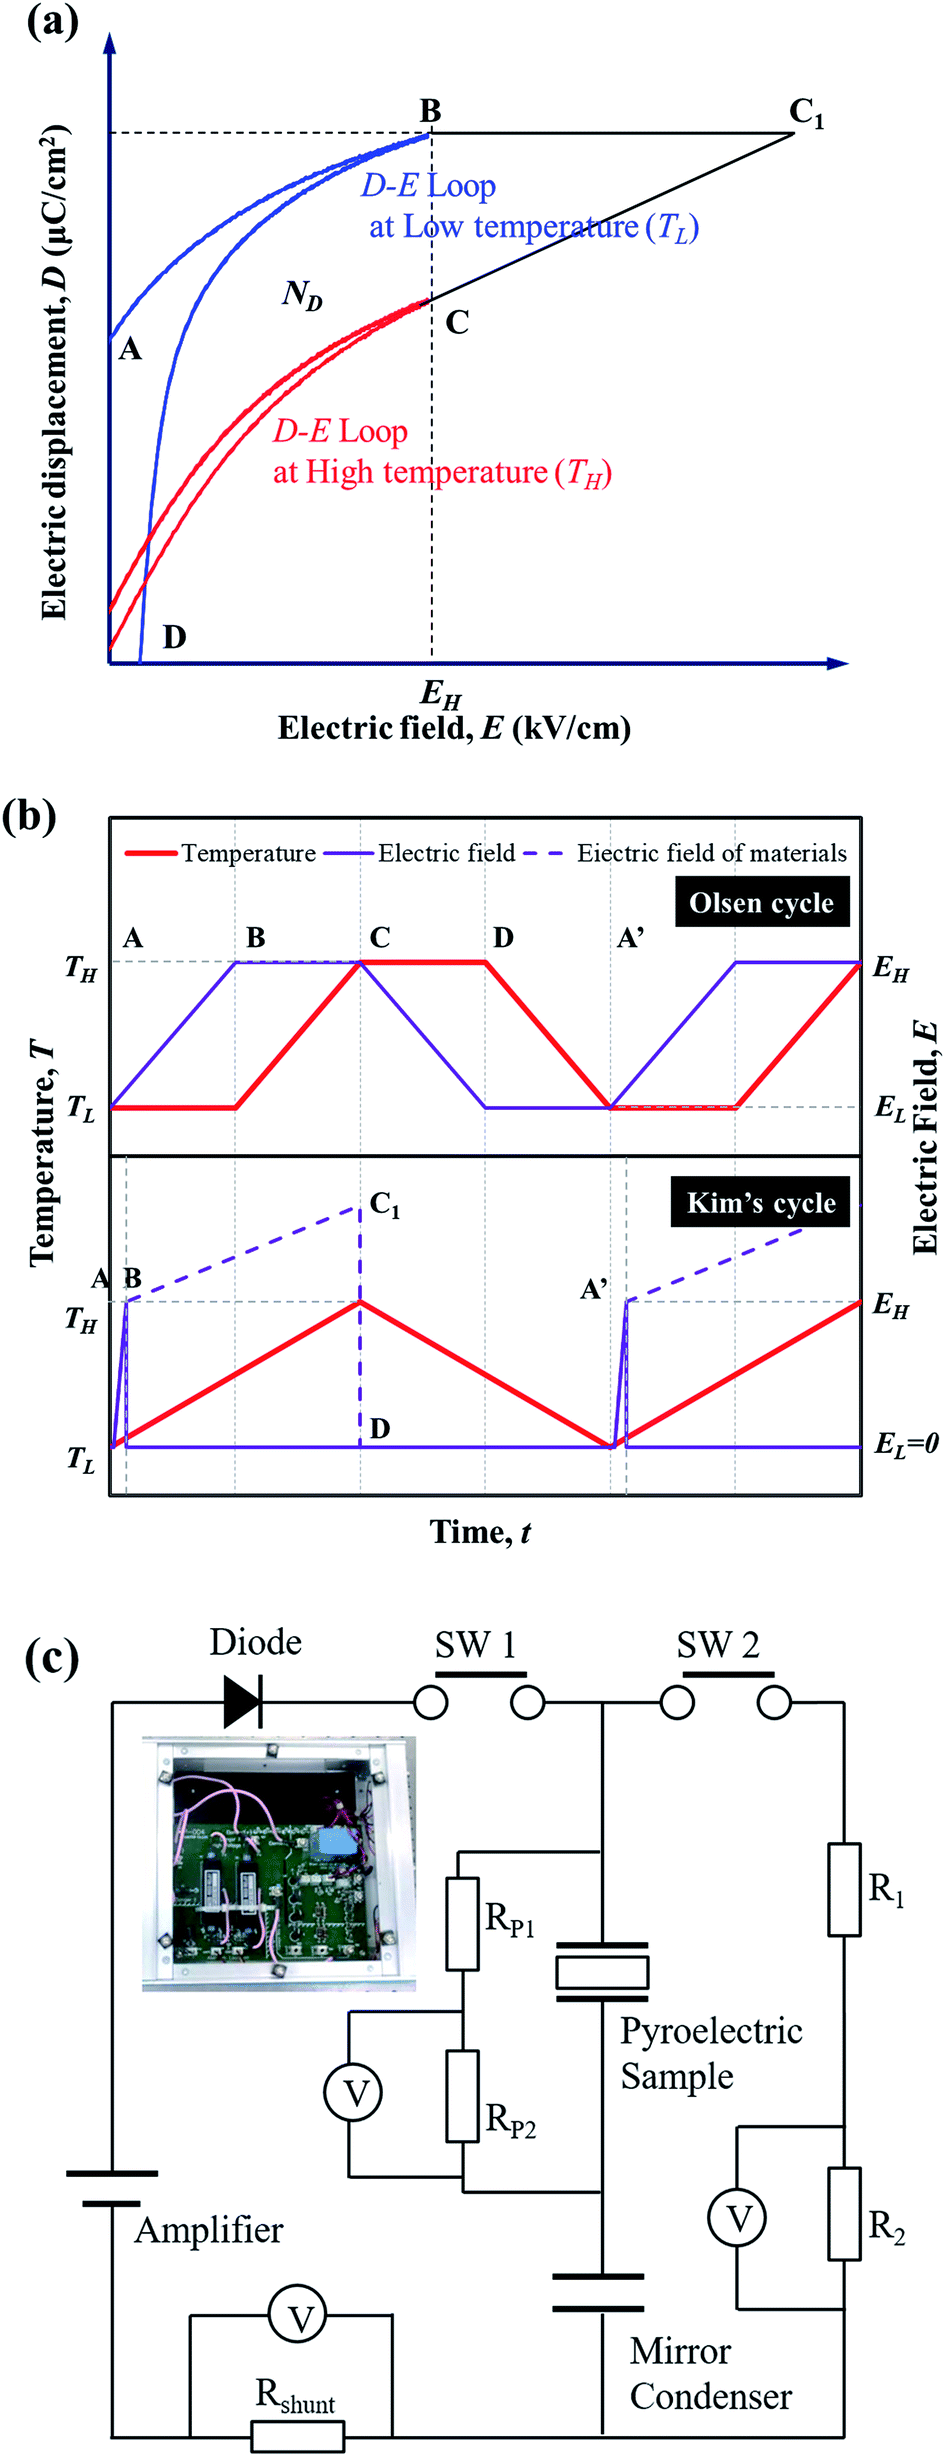 | ||
| Fig. 1 (a) A schematic of bipolar D–E loops for a pyroelectric material at high and low temperature along with the novel electro-thermodynamic cycle, (b) the cycling conditions for the D–E loop, and (c) a harvesting circuit with a diode and two switches (DSW). | ||
STEP 1 (A–B): the external electric field (EH) is applied briefly to the sample when the temperature begins to increase, and the sample reaches maximum polarization.
STEP 2 (at point B): EH is removed by the diode when charging is completed.
STEP 3 (B–C1): in this period, we can obtain an additional voltage increase in the sample. The material is then isolated in the circuit (Fig. 1(c)), and the electric displacement D is kept constant while the temperature increases to TH. The internal electric field of the materials (dashed line) is increased along path BC1 based on the electro-thermodynamic equation dD/dt = εdE/dt − pdT/dt (where D, E, T, ε, t and p are the electric displacement, electric field, temperature, dielectric permittivity, time, and pyroelectric coefficient, respectively).
STEP 4 (C1–D): when the temperature begins to decrease, the switch is turned on and charged electricity immediately flows to R1 and R2. Finally, the material is reconnected to the circuit.
STEP 5 (D–A′): the D–E loop is closed by cooling back to TL and moving to point A. After the electricity has finished decreasing, the temperature continues to decrease when the switch is opened.
STEP 6 (at point A′): the switch is turned off before the next cycle.
Fig. 1(c) shows a harvesting circuit with a diode and two switches (DSW) redesigned based on the general Sawyer–Tower (ST) circuit to divide the input/output energy by the inductions of the diode and switch resistance (PP1 and PP2 for measuring the voltage of pyroelectric materials, and R1, R2 and RShunt for calculating the net generating power).
Experimental
PNZST (Pb0.99Nb0.02(Zr0.637Sn0.273Ti0.09)0.98O3) ceramics with sizes of 30 × 20 × 0.5 mm3 were acquired from Murata Manufacturing Co., Ltd. For analysis of the crystal structure, neutron powder diffraction patterns were collected using a high-resolution neutron powder diffractometer (BL19 Takumi) in the Materials and Life Science Experimental Facility at J-PARC. The collected data were analyzed by the Rietveld method using the software Z-Rietveld. Transmission electron microscopy (TEM) observations using a real working environmental electron holography microscope (JEM-ARM200F-B, JEOL) were conducted at the National Institute for Materials Science (NIMS). For in situ experiments, Aduro in situ heating and an electrical biasing holder (Protochips Inc.) with a fusion electrothermal E-chip (E-FXA) were equipped. The bipolar electric–hysteresis loops for the PNZST sample were also measured using an impedance analyzer.For power generation tests in the laboratory, a DSW circuit (Fig. 1(c)) was used as an energy-harvesting circuit.1,12 To simulate engine exhaust gas, two heat blowers (Hot Wind System, LEISTER) and a mechanical cylinder (ELCM4E10MK-AP, Oriental Motor) were employed. In the pseudosinusoidal temperature variation with a period of 0.05 Hz, the TH ranged from 100 to 200 °C with a temperature difference of ΔT = TH − TL = 40 °C, and the electric field was applied using a high-voltage amplifier (677B, TREK), synchronized to the pseudosinusoidal temperature variation.
A virtual vehicle simulator using an engine dynamometer based on exhaust gas (660cc, KF-VE3, Daihatsu Motor Co. Ltd.17) was used to evaluate the generating performance of the materials in a real environment, as shown in Fig. 2. The material was set into a special module case in the exhaust pipe with the circuit connected. The generating test was performed based on the Japanese fuel-economy and emission test driving cycle (JC08 mode).17,18
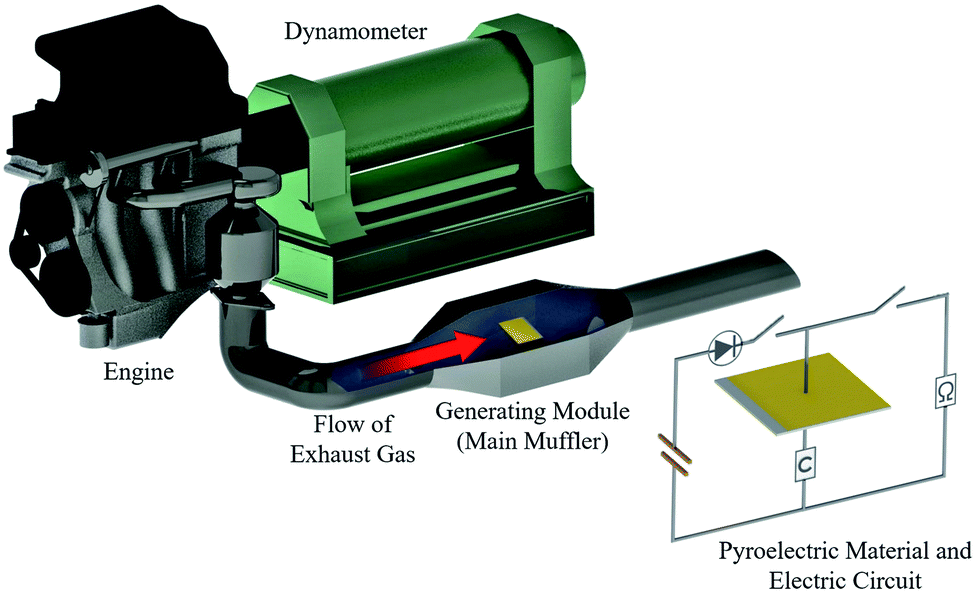 | ||
| Fig. 2 A schematic diagram of the engine dynamometer assessment (Daihatsu, home-made). The pyroelectric material is set inside the generating module (main muffler). | ||
Results and discussion
Fig. 3(a) shows the time-of-flight (TOF) neutron powder diffraction pattern for the PNZST powder in the d-spacing range of 0.5–3.2 Å, as well as the crystal structure drawn using the VEST software.19 According to the Rietveld refinement, the diffraction peaks of PNZST were fitted and characterized by the rhombohedral unit cell with the space group R3c. The lattice parameters were calculated to be a = b = c = 5.82938(2) Å, α = β = γ = 59.7995(4)° in a rhombohedral lattice. Crystallographic data for PNZST were also obtained, as listed in Table 1.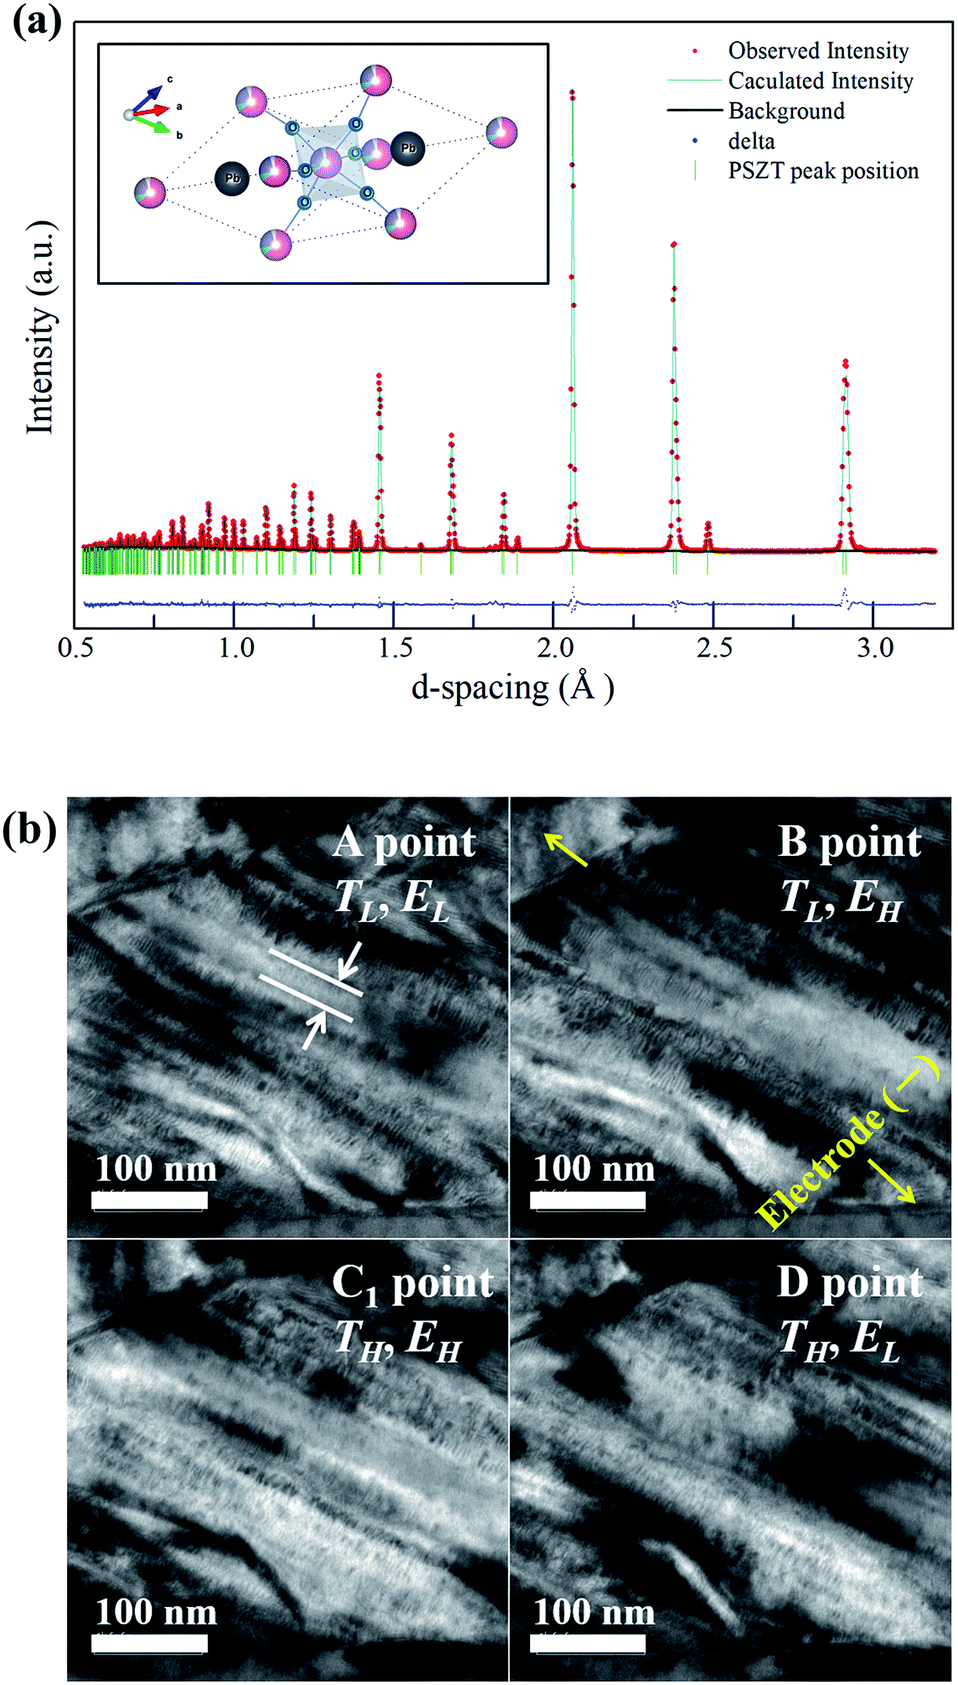 | ||
| Fig. 3 (a) Refined profiles of a sample at room temperature from the powder using neutron diffraction data and the crystal structure of the R3c phase for PNZST, and (b) the microstructures of PNZST ceramics observed by in situ transmission electron microscopy (TEM) experiments. | ||
| Atom | x | y | z | B |
|---|---|---|---|---|
| Pb | 0.23281(5) | 0.23281(5) | 0.23281(5) | 1.414(11) |
| Nb/Zr/Sn/Ti | 0 | 0 | 0 | 0.280(14) |
| O | 0.28287(11) | 0.22625(12) | 0.77480(14) | 2.053(17) |
Fig. 3(b) presents the microstructure obtained from TEM observations. The anisotropic domains were less than 50 nm thick and had hierarchical lamellar-like structures. The high density of nanoscale domains occurred due to small domain wall energies, which could facilitate the reorientation of polarization.20In situ experiments were performed along the individual cycle points A, B, C1 and D in Fig. 1(b). According to the TH and EH variations, the reversible response to the temperature and external electric field of the domains was confirmed.
Fig. 4(a) shows the temperature dependence of D–E hysteresis loops for the ceramics. The spontaneous polarization (Ps) and remnant polarization (Pr) respectively reached 34.32 and 29.79 μC cm−2 and the coercive field (Ec) reached 7.63 kV cm−1 at room temperature, indicating square loops typical of a ferroelectric (FE) state. The Ps, Pr and Ec decreased with temperature, and the antiferroelectric (AFE) region could be found shortly with double loop hysteresis in the vicinity of 150 °C before slim loops of a paraelectric state (PE) appeared. When an electric field above 5 kV cm−1 is applied while the temperature increases, the materials have a FE–PE phase transformation according to the temperature without going through the AFE phase. Berlincourt et al.21 confirmed the phase diagram of Pb0.99Nb0.02(Zr0.73Sn0.27Ti0.07)0.98O3 ceramics with the electric field and demonstrated that the incipient AFE state acts to increase the slope of the FE–PE boundary. As shown in Fig. 4(b), the polarizations of PNZST ceramics as a function of temperature decrease sharply while undergoing phase transformation corresponding to the D–E loop results. The sharp polarization behavior of PNZST compared to that in our previous study (C-6, PZT-based ceramics)1 can be expected due to the atomic ordering in the lattice22,23 and phase state under cycles.24,25 A rhombohedral phase has more available orientations for polarizations than a tetragonal phase such as the C-6 sample, leading to a naturally softer domain reorientation. This means that the rhombohedral state is relatively liable to rotate polarization with a small Ec and can maximize the energy generation by reducing the input energy.
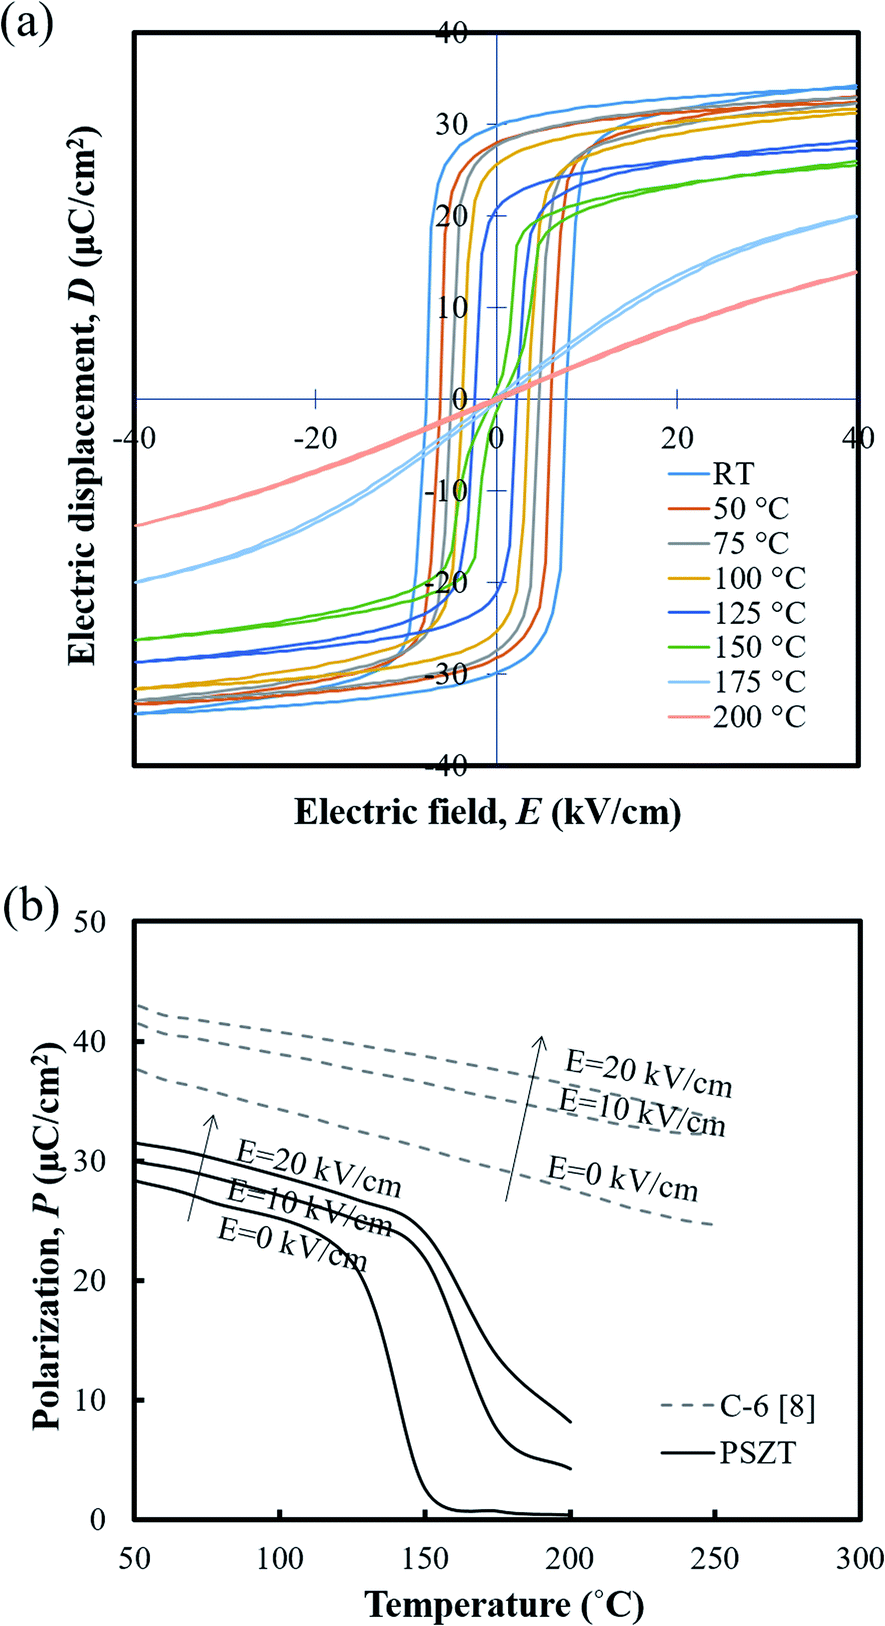 | ||
| Fig. 4 (a) Hysteresis D–E loops and (b) the polarizations of the PNZST ceramic as a function of temperature. | ||
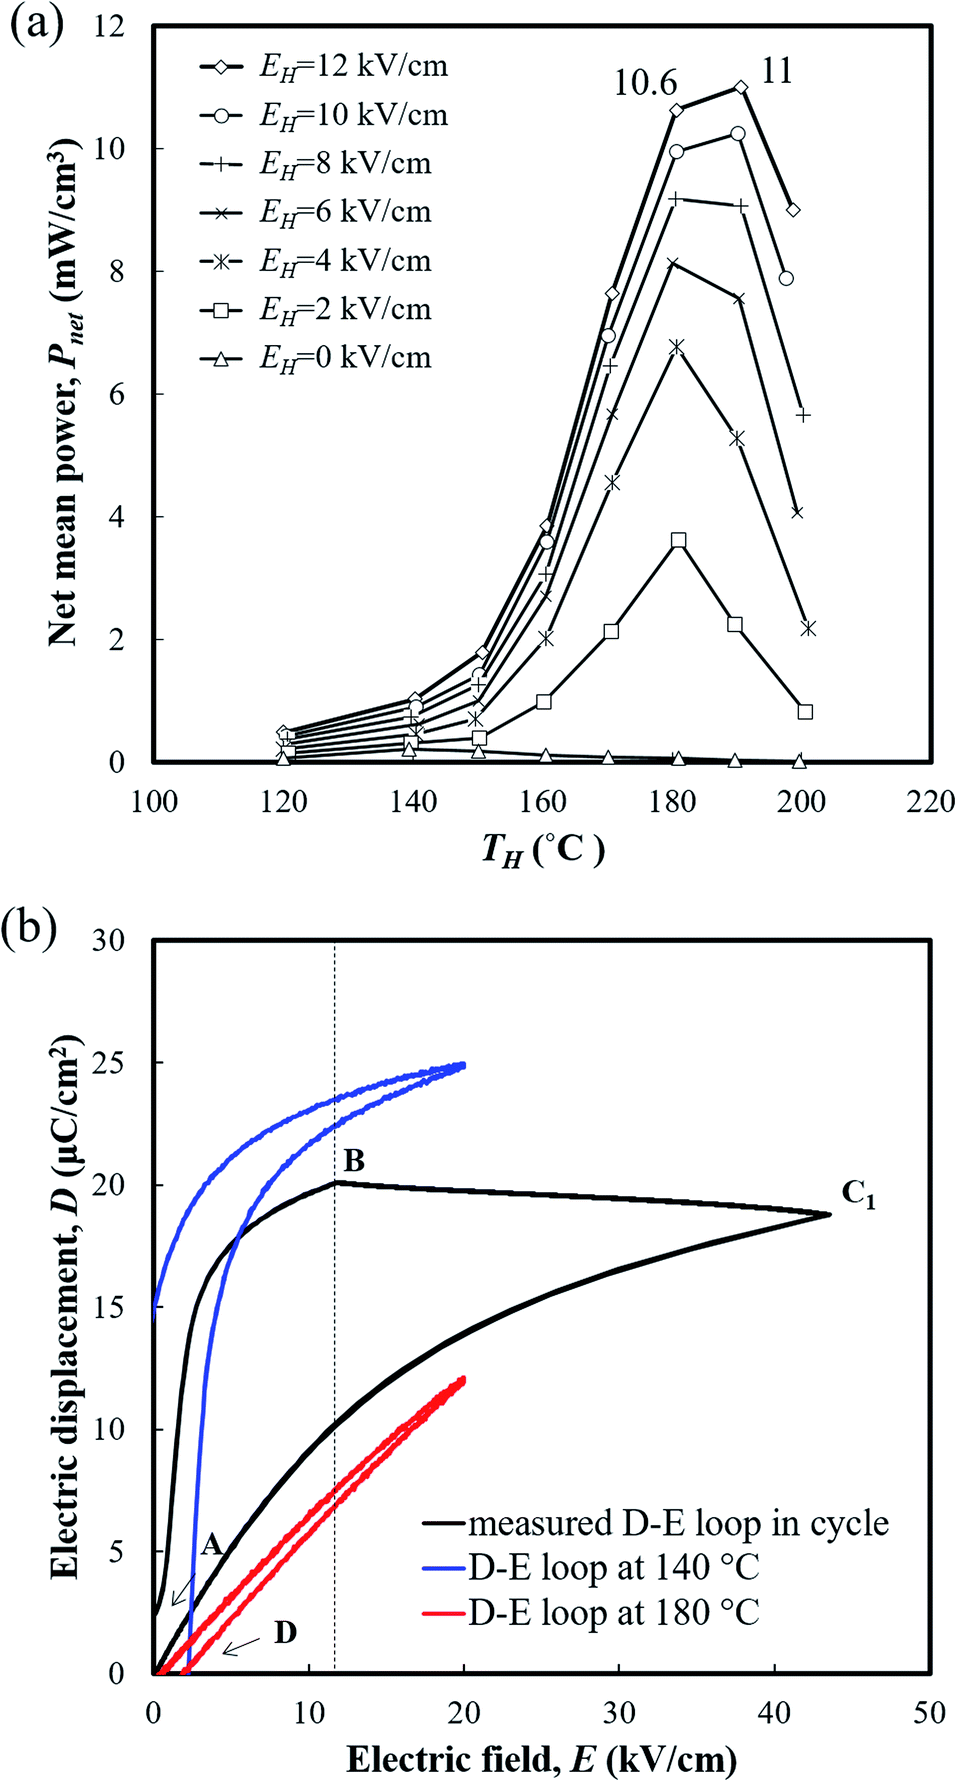
The generating performance was evaluated using the DSW circuit in Fig. 1(c). The temperature variation ΔT (=TH − TL) was set to be 40 °C considering the average temperature variation of the practical mode environment, and EH reached up to 12 kV cm−1 under each temperature condition. Fig. 5(a) presents the net mean power (Pnet) generated by PNZST samples according to TH and E. The peak of Pnet was obtained when the TH was near 180 °C (temperature range between 140 °C and 180 °C), including the FE–PE transition region in which the largest change in polarization occurred due to depolarization of the material above the transition temperature.26 As higher EH was applied, the Pnet increased and the temperature of the Pnet peak became higher. This indicates that the temperature of the FE–PE transition increase was a function of EH.21 The maximum Pnet observed was 11 mW cm−3 (generating energy of 220 J L−1 per 1 cycle) at TH = 190 °C (temperature range between 150 °C and 190 °C), which is a significantly enhanced value compared to the PZT-based ceramics in our previous study (C-9: 0.16 mW cm−1). Above TH = 190 °C, the change in polarization decreased, which resulted in the degradation of Pnet.
 | ||
| Fig. 5 (a) Temperature dependence of the net mean power of PNZST samples in the laboratory generating assessments. ΔT was 40 °C in all ranges; (b) results of the theoretical generating potential evaluation with PNZST samples at TH = 180 °C and EH = 12 kV cm−1. | ||
Fig. 5(b) shows the measured D–E behavior of PNZST samples undergoing the generating cycle (at TH = 180 °C and EH = 12 kV cm−1), which is calculated from the charge of the connected capacitor. Compared to the theoretical area of the isothermal D–E loop, there are gaps in electrical displacements which are mainly due to cycling conditions. As shown in Fig. 1(b), when the EH applied in the A–B process, the temperature of the material already increases, which makes a difference with regard to its theoretical isothermal behavior. The process C1–D also has losses because the material is undergoing the cooling step during the recovery of the energies. On the other hand, at point D, the polarization of the material vanishes above the FE–PE transformation temperature and a certain level of electric field is needed to realign the dipoles until the full repolarization of point B. Materials that are liable to rotate polarization have high slopes of the A–B route linked with their high power generating potential.
An engine dynamometer assessment using real exhaust gas was conducted based on the Japanese fuel-economy and emission test driving cycle (JC08 mode), as shown in Fig. 2. In the redesigned main muffler, the temperature of the exhaust gas was controlled to include the phase transition region of the PNZST samples, and the external EH was optimized as 13 kV cm−1 for each representative temperature variation (Fig. 6(a) and (b)). Fig. 6(c) shows the individual calculated energy densities of each temperature variation in the mode. The maximum generating power was 143.9 mW cm−3 (generating energy of 777.3 J L−1 per 1 cycle) in the temperature range of 150–220 °C and the detailed cycle behavior is shown in Fig. 7. In this cycle, the speed condition of the vehicle is the range of about 0–40 km h−1 and the acceleration is about 10 m s−2. Fig. 6(d) presents the results of the assessments over the total drive cycle with PNZST samples compared to previous results.1,9 The net mean power was 40.8 mW cm−3 (accumulated generating energy of 49![[thin space (1/6-em)]](https://www.rsc.org/images/entities/char_2009.gif) 117.4 J L−1), which is the highest value produced by any material in our energy harvesting system to date1,9–12 and is 314 times greater than what we presented in our first report.1
117.4 J L−1), which is the highest value produced by any material in our energy harvesting system to date1,9–12 and is 314 times greater than what we presented in our first report.1
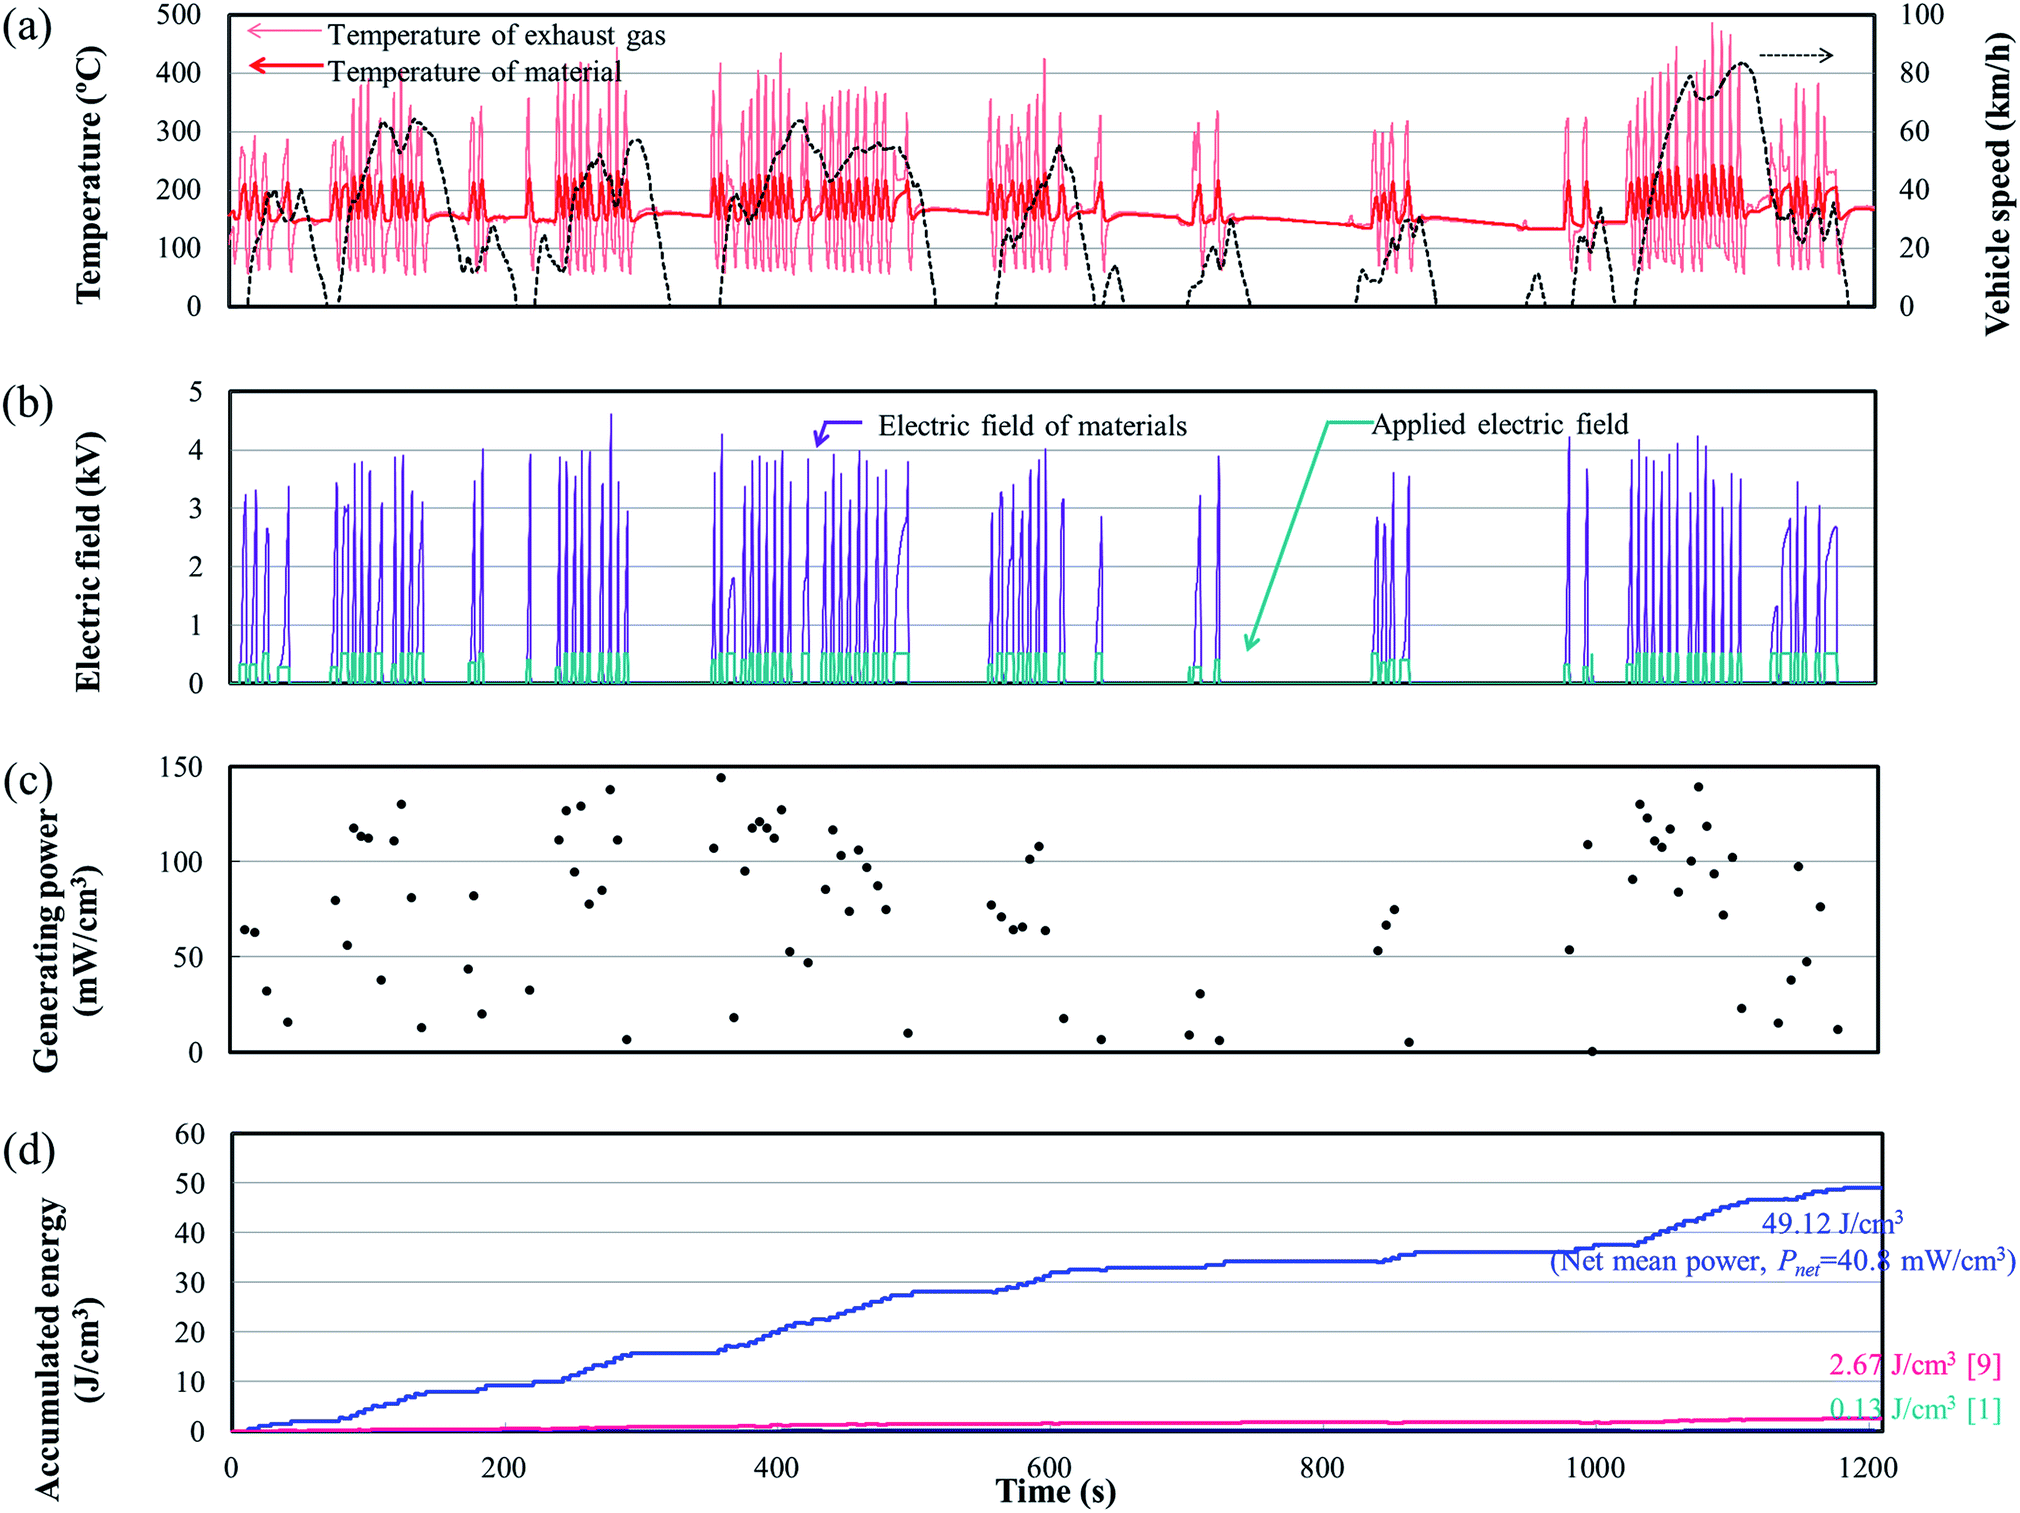 | ||
| Fig. 6 Results of generating power assessments with a real engine dynamometer during the Japanese fuel-economy and emission test driving cycle (JC08 mode). (a) Temperature of exhaust gas (solid line), temperature of the material (bold line) and vehicle speed, (b) electric field of the material and the applied electric field, (c) individual calculated power of each temperature variation, and (d) accumulated generating energy over the total cycle. | ||
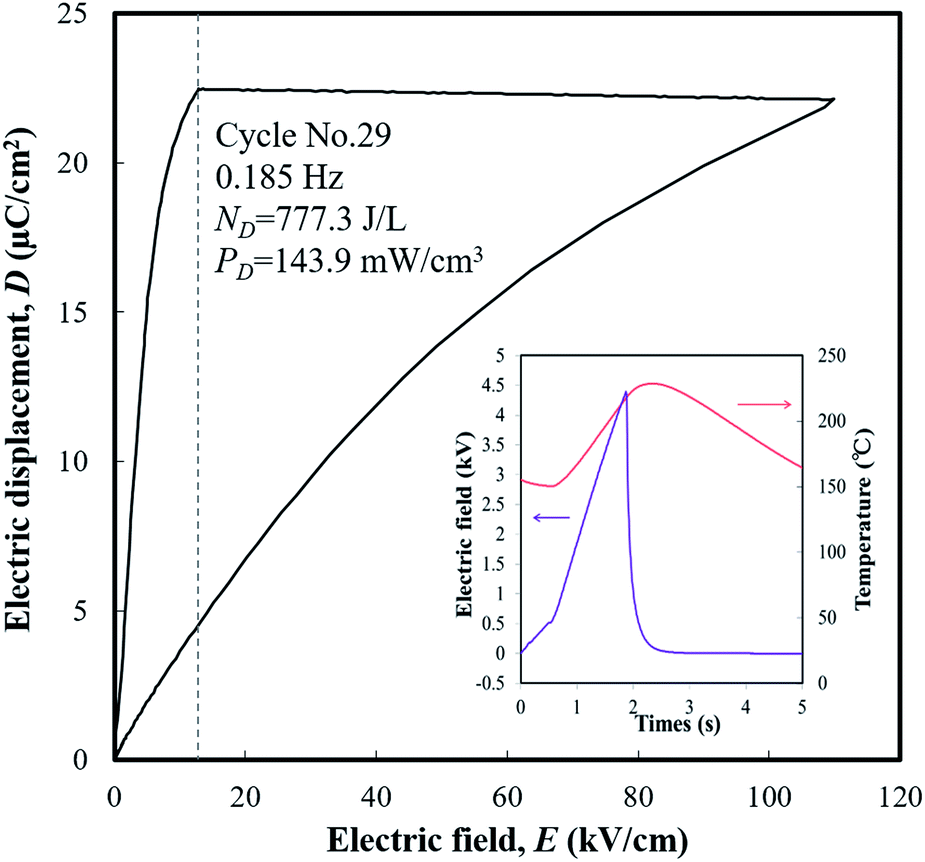 | ||
| Fig. 7 The maximum generating power cycle in the test and its conditions: TL = 150 °C, TH = 220 °C, and EH = 13 kV cm−1. | ||
The comparisons of the current maximum power and energy density for pyroelectric energy harvesting studies for various materials are shown in Table 2, together with the respective operating conditions. PNZST ceramics in this study have a sharp phase transition behavior with the temperature from the rhombohedral phase with many axes of polarization (the number of available orientations for the polarization in the lattice is eight in the rhombohedral phase and six in the tetragonal phase for pervious samples), and the polarization rotates easily with the external electric field with a small Ec, such that enhanced power generating was obtained. These materials have enormous potential for high performance and can be advantageously utilized for many other device applications in addition to this automobile system. According to the practical system environment of devices, the generating power can be enhanced more by thinning the samples, controlling the temperature and frequency, and improving the breakdown voltage.
| Material | Temperature TH/TL (°C) | Electric field EH/EL (kV cm−1) | Frequency of the experimental cycle (Hz) | Energy density (J per L per cycle) | Power density (mW cm−3) | Ref. |
|---|---|---|---|---|---|---|
| PNZST ceramics | 220/150 | 13/0 | 0.185 | 777.3 | 143.9 | This study |
| PZN-4.5 PT single crystals | 160/100 | 20/0 | 0.1 | 217 | 21.7 | 27 |
| PMN-10PT ceramics | 80/30 | 35/0 | — | 186 | — | 28 |
| PMN-32PT thin films | ΔT = 56 | ΔE = 267 | 1000 | 526 | 526000 |
8 |
| PNZST ceramics | 177/157 | 32/4 | 0.26 | 131 | 34 | 29 |
| PLZT ceramics | 160/25 | 75/2 | 0.0178 | 888 | 15.8 | 30 |
| PNNZT ceramics | 220/20 | 90/3 | 0.09 | 867 | 78 | 5 |
| P(VDF-TrFE) thin films | 110/25 | 500/200 | 0.13 | 441 | 58 | 31 |
| BCT-BZT-Fe ceramics | 110/30 | 30/0 | Calculated from the D–E diagram | 305 | — | 32 |
| BNK-BST ceramics | 160/20 | 40/1 | 1523 | — | 33 | |
| BNKT ceramics | 110/25 | 52/1 | 1986 | — | 34 | |
| PZT/CFO-L3 thin films | 27/−173 | 400/0 | 47372 |
— | 35 |
We consider that the high performance materials used for pyroelectric energy harvesting mostly have an appreciable change in polarization behavior in each cycle, as well as a corresponding crystal structure. In addition to this, we speculate that materials that are composed of nanoscale anisotropic domains and have many axes of rotatable dipoles have higher performance. An investigation of the structural changes in pyroelectric materials in terms of the crystal and domain scale is presented herein, and future research regarding energy harvesting will continue to address these characteristics for the design of high performance materials.
Conclusion
Experimental measurements of pyroelectric generating power were conducted for PNZST ceramics in a novel electro-thermodynamic cycle. The PNZST ceramics underwent a phase transition from a ferroelectric state (rhombohedral structure with the space group R3c) to a paraelectric state in the cycle. The crystal structure influences the sharp transition behavior of electric displacement during changes in the temperature and electric field, resulting in enhanced power generating performance. In the virtual engine driving cycle, a net mean generating power of 40.8 mW cm−3 was obtained. To utilize pyroelectric energy harvesting in various applications, PNZST ceramics may be a promising candidate, but further experiments and investigations of the crystal structural transition behavior are necessary to better understand the factors of high power generating performance.Conflicts of interest
There are no conflicts to declare.Acknowledgements
The authors are thankful to Murata Manufacturing Co., Ltd. for providing the materials. Neutron diffraction experiments were performed using a neutron instrument at the MLF Pulsed Neutron Source at J-PARC (Proposal No. 2018I0019). A part of this work was supported by the NIMS microstructural characterization platform as a program of the “Nanotechnology Platform” of the Ministry of Education, Culture, Sports, Science and Technology (MEXT), Japan (Proposal No. A-16-NM-0196, A-17-NM-0119, and A-18-NM-0081). Also, this work was supported by the New Energy Industrial Technology Development Organization (NEDO) through the Advanced Research Program for Energy and Environmental Technologies (Grant No. 17100185-0).References
- Y. Kim, J. Kim, S. Yamanaka, A. Nakajima, T. Ogawa, T. Serizawa, H. Tanaka, M. Baba, T. Fukuda, K. Yoshii, M. Takeda, N. Yamada, T. Nakayama and K. Niihara, Adv. Energy Mater., 2015, 5, 1401942 CrossRef.
- World Energy Flow, in 2011, https://flowcharts.llnl.gov/commodities/energy, accessed February 2019.
- S. P. Alpay, J. Mantese, S. Trolier-McKinstry, Q. Zhang and R. W. Whatmore, MRS Bull., 2014, 39, 1099–1111 CrossRef CAS.
- C. R. Bowen, J. Taylor, E. LeBoulbar, D. Zabek, A. Chauhan and R. Vaish, Energy Environ. Sci., 2014, 7, 3836–3856 RSC.
- A.-S. Siao, I. M. McKinley, C.-K. Chao, C.-C. Hsiao and L. Pilon, J. Appl. Phys., 2018, 124, 174104 CrossRef.
- C. R. Bowen, J. Taylor, E. Le Boulbar, D. Zabek and V. Y. Topolov, Mater. Lett., 2015, 138, 243–246 CrossRef CAS.
- W. H. Clingman and R. G. Moore Jr, J. Appl. Phys., 1961, 32, 675–681 CrossRef.
- S. Pandya, J. Wilbur, J. Kim, R. Gao, A. Dasgupta, C. Dames and L. W. Martin, Nat. Mater., 2018, 17, 432–438 CrossRef CAS PubMed.
- S. Yamanaka, J. Kim, A. Nakajima, T. Katou, Y. Kim, T. Fukuda, K. Yoshii, Y. Nishihata, M. Baba, N. Yamada, T. Nakayama, M. Takeda, K. Niihara and H. Tanaka, Adv. Sustainable Syst., 2017, 1, 1600020 CrossRef.
- J. Kim, S. Yamanaka, A. Nakajima, T. Katou, Y. Kim, T. Fukuda, K. Yoshii, Y. Nishihata, M. Baba, M. Takeda, N. Yamada, T. Nakayama, K. Niihara and H. Tanaka, Ferroelectrics, 2017, 512, 92–99 CrossRef CAS.
- J. Kim, T. Moro, J. Kim, S. Yamanaka, I. Murayama, T. Katou, T. Nakayama, M. Takeda, N. Yamada, Y. Nishihata, T. Fukuda, H. Tanaka, T. Sekino and Y. Kim, J. Alloys Compd., 2018, 768, 22–27 CrossRef CAS.
- J. Kim, S. Yamanaka, A. Nakajima, T. Katou, J. Kim, Y. Kim, T. Fukuda, K. Yoshii, Y. Nishihata, M. Baba, M. Takeda, N. Yamada, T. Nakayama and H. Tanaka, Adv. Sustainable Syst., 2018, 2, 1800067 CrossRef.
- R. B. Olsen, J. M. Briscoe, D. A. Bruno and W. F. Butler, Ferroelectrics, 1981, 38, 975–978 CrossRef CAS.
- R. B. Olsen and D. D. Brown, Ferroelectrics, 1982, 40, 17–27 CrossRef CAS.
- R. B. Olsen and D. Evans, J. Appl. Phys., 1983, 54, 5941–5944 CrossRef CAS.
- R. B. Olsen, D. A. Bruno and J. M. Briscoe, J. Appl. Phys., 1985, 58, 4709–4716 CrossRef CAS.
- T. Serizawa, I. Tan and H. Tanaka, JSAE Rev., 1998, 52, 39–45 Search PubMed.
- Y. Kim, K. Naito, H. Fujikawa, T. Ogawa, I. Tan, K. Hasegawa and H. Tanaka, SAE Technical Paper, 2007 Search PubMed.
- K. Momma and F. Izumi, J. Appl. Crystallogr., 2008, 41, 653–658 CrossRef CAS.
- Y. M. Jin, Y. U. Wang, A. G. Khachaturyan, J. F. Li and D. Viehland, J. Appl. Phys., 2003, 94, 3629–3640 CrossRef CAS.
- D. Berlincourt, H. H. A. Krueger and B. Jaffe, J. Phys. Chem. Solids, 1964, 25, 659–674 CrossRef CAS.
- A. S. Bhalla, R. Guo and R. Roy, Mater. Res. Innovations, 2000, 4, 3–26 CrossRef CAS.
- N. Setter and L. E. Cross, J. Appl. Phys., 1980, 51, 4356–4360 CrossRef CAS.
- D. V. Taylor and D. Damjanovic, J. Appl. Phys., 1997, 82, 1973–1975 CrossRef CAS.
- M. I. Morozov, M.-A. Einarsrud, J. R. Tolchard, P. T. Geiger, K. G. Webber, D. Damjanovic and T. Grande, J. Appl. Phys., 2015, 118, 164104 CrossRef.
- R. Kandilian, A. Navid and L. Pilon, Smart Mater. Struct., 2011, 20, 055020 CrossRef.
- A. Khodayari, S. Pruvost, G. Sebald, D. Guyomar and S. Mohammadi, IEEE Trans. Ultrason. Eng., 2009, 56, 693–699 Search PubMed.
- G. Sebald, S. Pruvost and D. Guyomar, Smart Mater. Struct., 2007, 17, 015012 CrossRef.
- R. B. Olsen, D. A. Bruno, J. M. Briscoe and J. Dullea, Ferroelectrics, 1984, 59, 205–219 CrossRef CAS.
- F. Y. Lee, S. Goljahi, I. M. McKinley, C. S. Lynch and L. Pilon, Smart Mater. Struct., 2012, 21, 025021 CrossRef.
- A. Navid and L. Pilon, Smart Mater. Struct., 2011, 20, 025012 CrossRef.
- D. Sharma, S. Patel, A. Singh and R. Vaish, Journal of Asian Ceramic Societies, 2016, 4, 102–111 CrossRef.
- G. Vats, R. Vaish and C. R. Bowen, J. Appl. Phys., 2014, 115, 013505 CrossRef.
- A. Chauhan, S. Patel, G. Vats and R. Vaish, Energy Technol., 2014, 2, 205–209 CrossRef CAS.
- G. Vats, A. Kumar, N. Ortega, C. R. Bowen and R. S. Katiyar, Energy Environ. Sci., 2016, 9, 1335–1345 RSC.
| This journal is © The Royal Society of Chemistry 2020 |