DOI:
10.1039/D0SC04909C
(Edge Article)
Chem. Sci., 2020,
11, 12553-12569
Dynamics and mechanism of light harvesting in UV photoreceptor UVR8†
Received
4th September 2020
, Accepted 21st October 2020
First published on 28th October 2020
Abstract
Photosynthetic pigments form light-harvesting networks to enable nearly perfect quantum efficiency in photosynthesis via excitation energy transfer. However, similar light-harvesting mechanisms have not been reported in light sensing processes in other classes of photoreceptors during light-mediated signaling. Here, based on our earlier report, we mapped out a striking energy-transfer network composed of 26 structural tryptophan residues in the plant UV-B photoreceptor UVR8. The spectra of the tryptophan chromophores are tuned by the protein environments, funneling all excitation energy to a cluster of four tryptophan residues, a pyramid center, where the excitation-induced monomerization is initiated for cell signaling. With extensive site-directed mutagenesis, various time-resolved fluorescence techniques, and combined QM/MM simulations, we determined the energy-transfer rates for all donor–acceptor pairs, revealing the time scales from tens of picoseconds to nanoseconds. The overall light harvesting quantum efficiency by the pyramid center is significantly increased to 73%, compared to a direct excitation probability of 35%. UVR8 is the only photoreceptor discovered so far using a natural amino-acid tryptophan without utilizing extrinsic chromophores to form a network to carry out both light harvesting and light perception for biological functions.
Introduction
Sunlight is essential to living organisms both as the energy source for photosynthesis and as an environmental signal for biological functions. For the former, different photosynthetic organisms have evolved various light-harvesting complexes, including chlorosomes,1 phycobilisomes,2 FMO complexes,3 light-harvesting complex I (LHCI)4 and light-harvesting complex II (LHCII).5 These antenna complexes contain multiple spatially arranged photosynthetic pigments, which can absorb photon energy and then transmit the excitation energy to reaction centers for energy conversion, ensuring the efficiency of photosynthesis. For light-triggered signaling, living systems use a variety of photoreceptors for the initial sensing of different regions of the solar spectrum, mediating critical biological processes of vision, circadian rhythm, photomorphogenesis and ultraviolet (UV) protection.6–10 In contrast with photosynthetic complexes, most photoreceptors contain only one chromophore, and thus, both the photon absorption and the subsequent photoreactions that lead to protein conformational changes occur at the same site without excitation energy transfer. Interestingly, a recently discovered plant UV-B (280–315 nm) photoreceptor, UVR8 (UV RESISTANCE LOCUS 8), is unique among all photoreceptor proteins, in which there is no external chromophore present, but multiple tryptophan residues in the protein sequence are believed to be its chromophores. UVR8 potentially provides the first example of photoreceptors that use highly organized light-harvesting networks.10
UVR8 forms a homodimer whose interface is decorated with multiple inter-subunit salt-bridges and hydrogen-bonding interactions in the ground or “dark” state.10–12 Upon absorption of UV-B irradiation, the UVR8 dimers spontaneously dissociate into monomers, which bind the key signaling protein Constitutively Photomorphogenic 1 (COP1) to trigger various protective mechanisms against UV damage.10–23 The high-resolution X-ray structure of Arabidopsis thaliana UVR8 has been solved in the dimeric form (Fig. 1a and b), revealing a 7-blade beta-propeller architecture of each monomer.11,12 Unlike other visible and infrared photoreceptors, UVR8 does not contain any external chromophores and utilizes the UV-absorbing natural amino acid tryptophan (Trp or W) to perceive UV-B. Each UVR8 monomer has 14 tryptophan residues, which, except one tryptophan in the flexible C-terminal region (not included in the X-ray structure), can be classified into 3 distinct groups (Fig. 1a and b): pyramid center Trp (Wc, 4 of the 13), peripheral Trp (Wp, 3 of the 13) and distal Trp (Wd, 6 of the 13). One UVR8 dimer has two symmetry-related pyramid centers (4Wc); each is formed by van der Waals clustering of 3Wc (W285, W233 and W337) from one monomer and a fourth Wc (W94) from the opposing monomer. There are also three peripheral Trp residues, 3Wp (W198, W250 and W302), at the dimer interface surrounding the pyramid 4Wc. Furthermore, six Trp residues, 6Wd, are buried in the middle of the beta-propellers and form a highly symmetrical ring with another tyrosine residue (Fig. 1b). Among these tryptophan residues, only two pyramid center Trp (W285 and W233) of the Wc pyramid are critical to the light-induced monomerization.11,12,24–30 Previously, we found a fast fluorescence quenching reaction in ∼150 picoseconds among Trp residues of the pyramid cluster, likely using excitation energy on Wc to initiate dimer dissociation.28 One key question is whether or not other tryptophan residues form a light-harvesting network to transmit excitation energy to the pyramid center (4Wc), enhancing UVR8 quantum yield for sensitive detection of the relatively low intensity of UV-B radiation. Previously, we reported a Trp-to-Trp energy transfer observation,28 which was soon supported by other theoretical results.29,30 However, there is no direct experimental evidence of light harvesting; the time scales and scheme of the excitation energy transfer process are completely unknown.
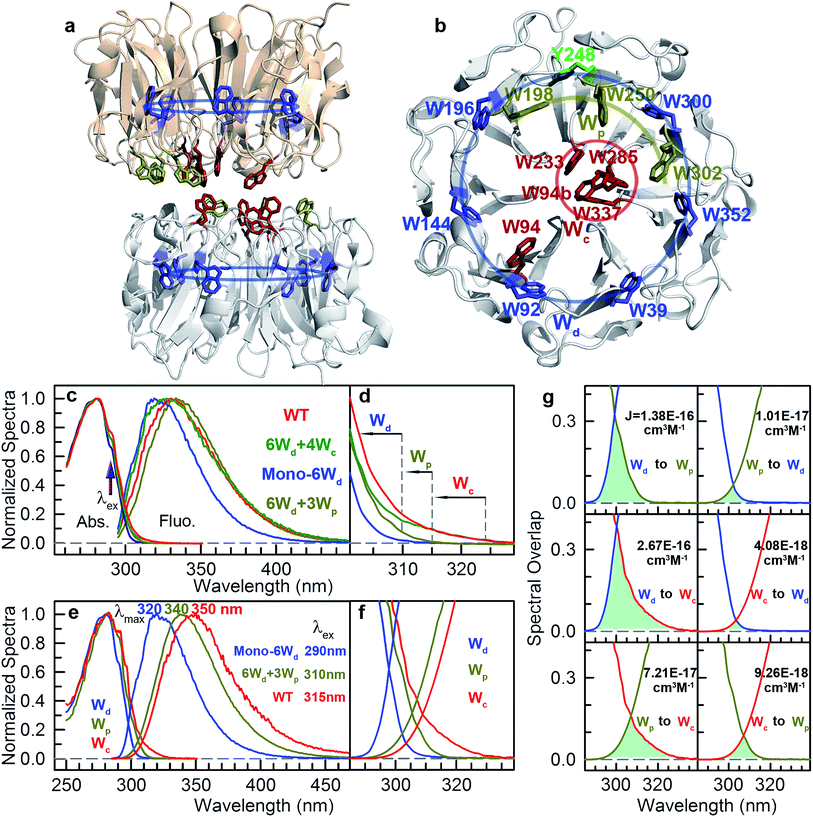 |
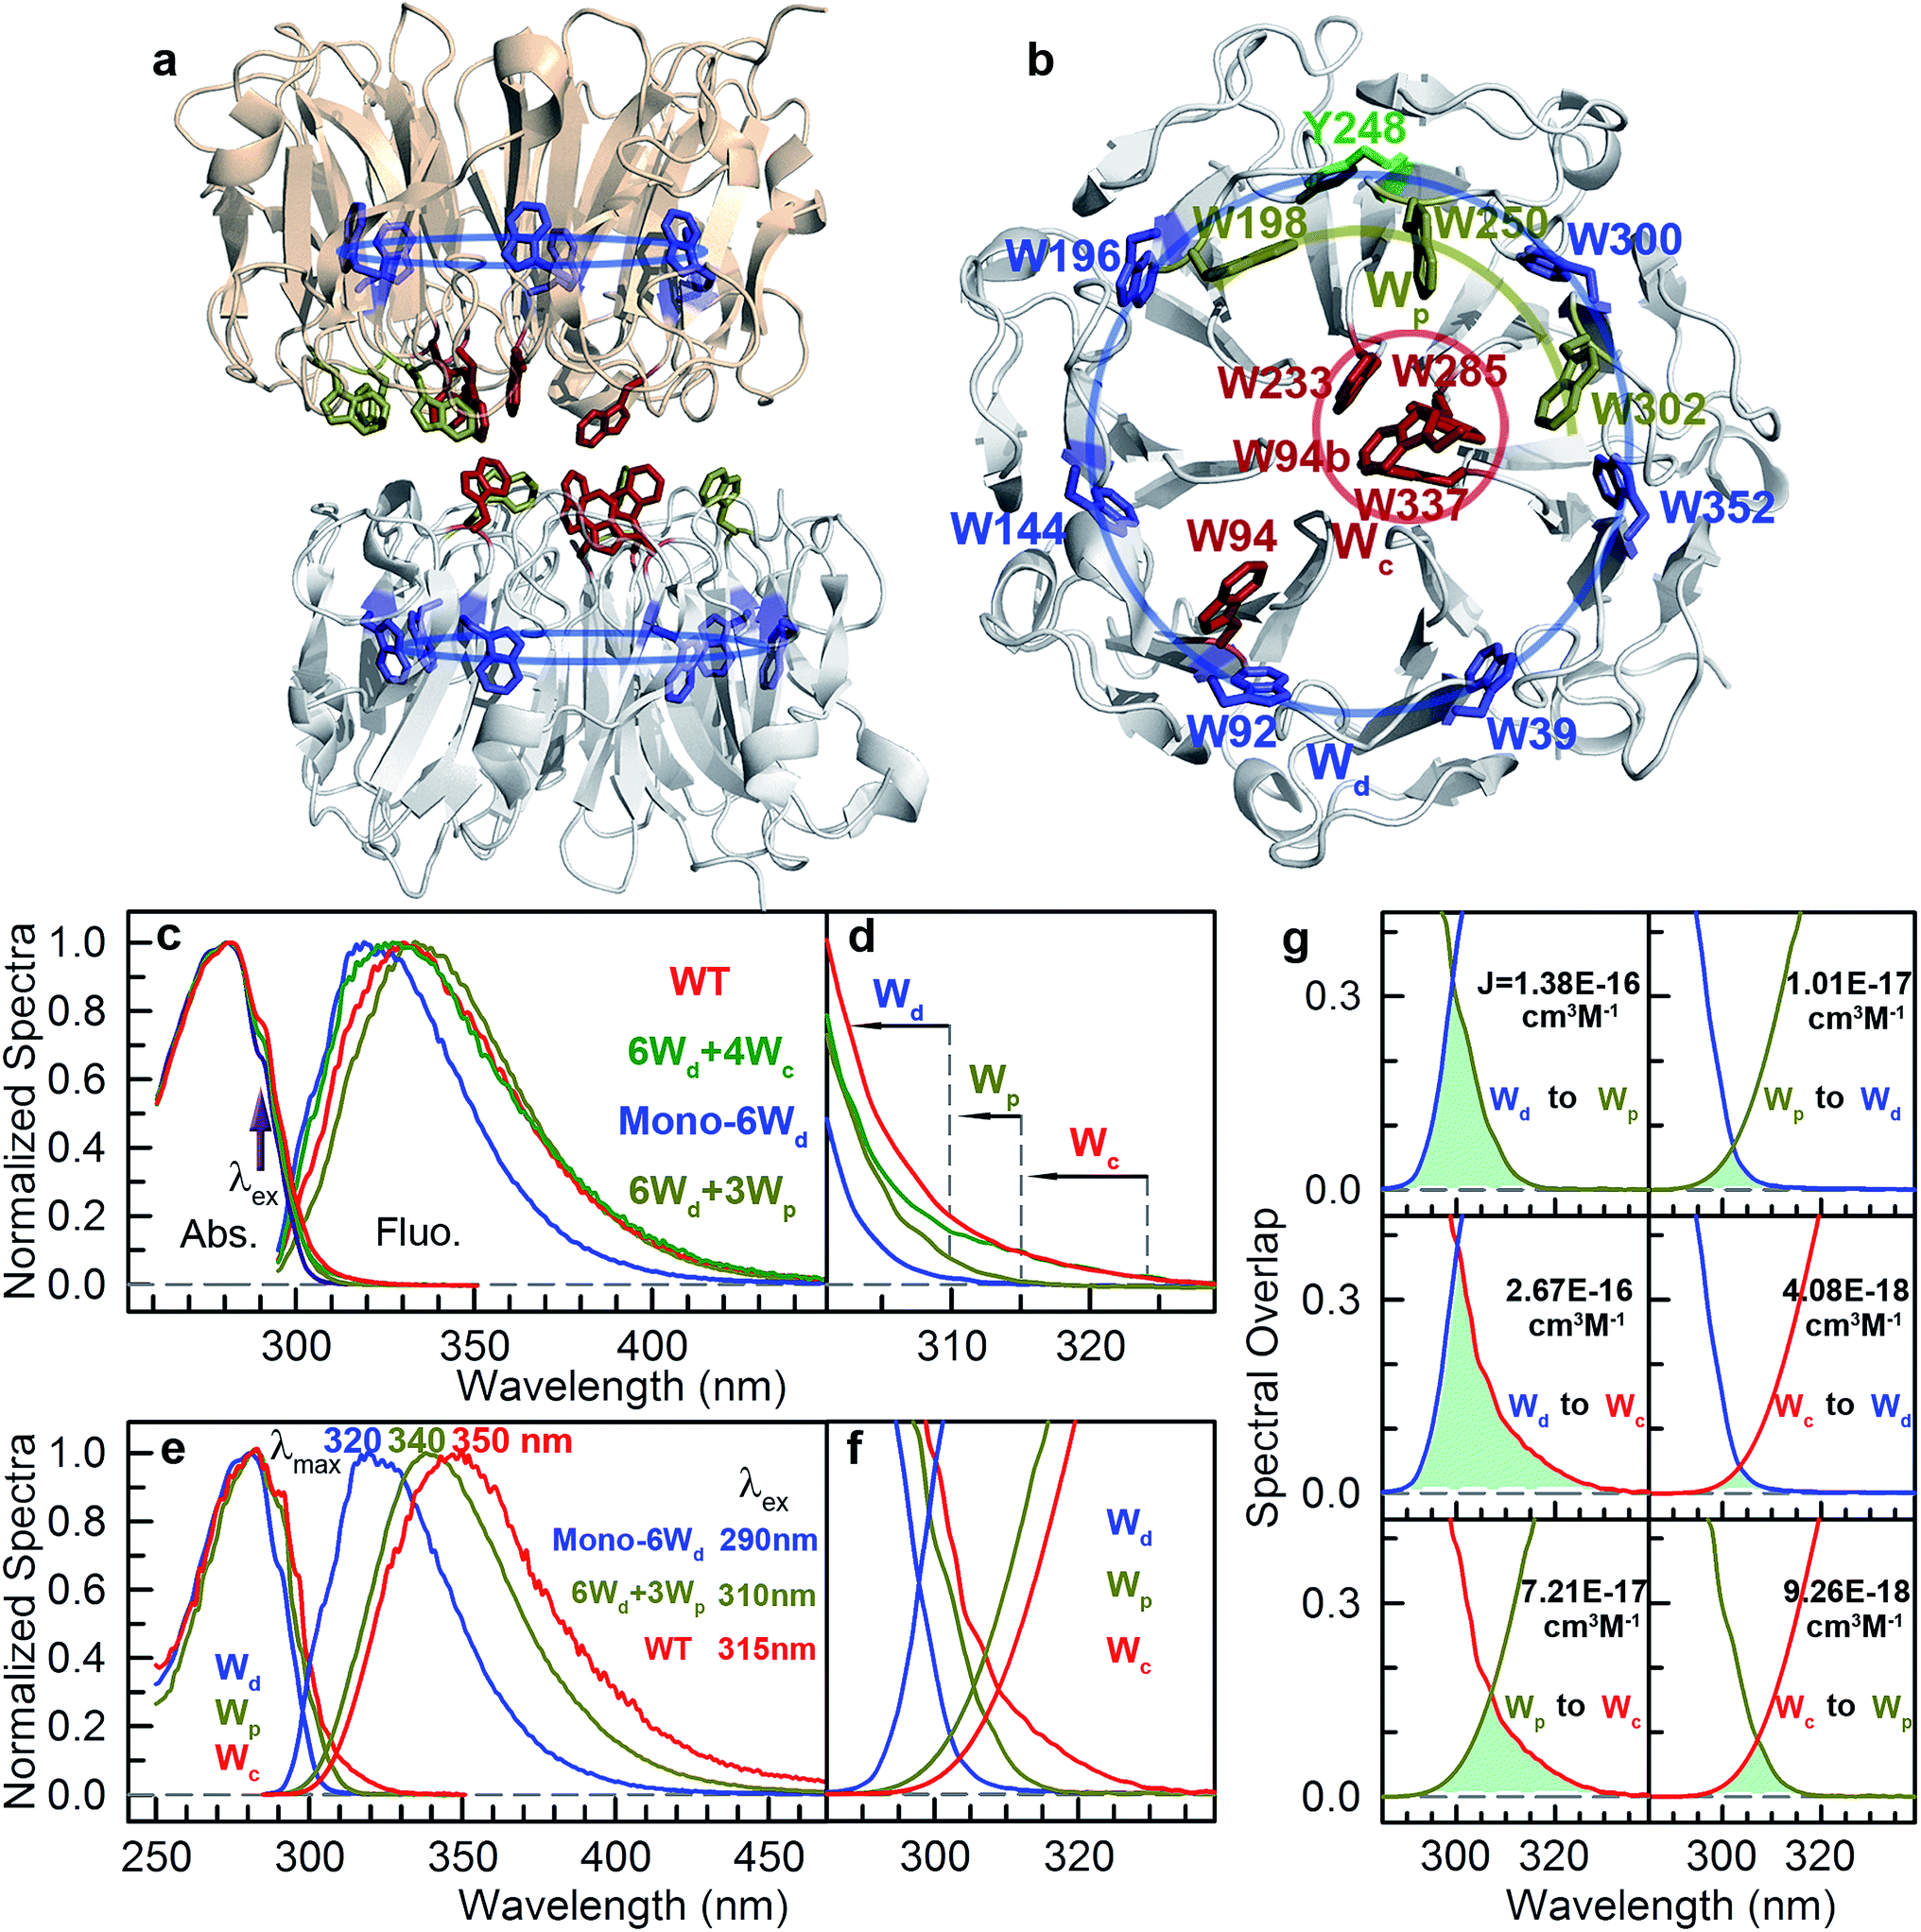
| | Fig. 1 UVR8 light-harvesting tryptophan and steady-state spectra. (a) A side view of UVR8 dimer with 3 groups of W residues highlighted in different colors: 6Wd, blue; 3Wp, dark yellow; and 4Wc, dark red. (b) A top view of one monomer shows symmetrical locations of 6Wd and relative positions of 3Wp/4Wc. W94b is from the other monomer. (c) Normalized absorption and emission spectra for UVR8 WT and 3 mutants. (d) The absorption spectra show differences beyond 300 nm wavelength. (e) Normalized absorption and emission spectra for Wd, Wp and Wc separately. Note the different excitation wavelengths for selected Wd (290 nm), Wp (310 nm) and Wc (315 nm) only. (f) A close view of the absorption-emission overlap region. (g) Spectral overlap integrals for energy transfer. | |
In this work, we first designed tens of UVR8 mutants to remove certain tryptophan residues to isolate the system into three Trp spectral groups. We next used three different time-resolved fluorescence spectroscopy methods to completely measure the energy-transfer dynamics in various UVR8 mutants. Then, we applied combined quantum mechanical and molecular mechanical (QM/MM) simulations and Förster resonance energy transfer (FRET) theory to determine the energy transfer rates, providing further insights into the experimental data. These observations exclude a coherent energy-transfer behavior, as observed in photosynthesis, which is attributed to the large distances between the donors and acceptors in UVR8. Combining all experimental and theoretical results, we revealed a remarkable light-harvesting network in the soluble photoreceptor UVR8, which significantly increases the overall light-sensing efficiency.
Results and discussion
Unique spectra of the three tryptophan groups
Since excitation energy flows downhill, we first investigated the possible resonance energy transfer (RET) direction by obtaining the spectra of 3 Trp groups from mutagenesis studies (mutants summarized in Table S1†). We can knockout either the pyramid center (mutant W233/285/337/94F or 6Wd + 3Wp) or the peripheral outlier (mutant W198/250/302F or 6Wd + 4Wc) by replacing tryptophan with phenylalanine (Phe or F) residues to measure clean spectra of the three Trp groups. However, replacement of all seven interfacial tryptophan residues (3Wp/4Wc) to F leads to severe inclusion body formation with no functional protein yield, probably due to protein misfolding. We identified that the W302F mutant is the cause for this problem. We then used W94/233/285/337/198/250F or 6Wd + W302 as a starting point and replaced the W302 position with all other 18 natural amino acids, but still failed to obtain any well-folded mutant. By further mutating an arginine (Arg or R) residue R286 involved in interfacial salt-bridges to a neutral alanine (Ala or A) residue and W302 to histidine (His or H), a well-folded monomeric protein (mono-6Wd) could be purified with all 3Wp/4Wc removed. Since previous FTIR experiments have suggested that the UVR8 dimer and monomer conformations have similar overall tertiary structure,31 the local environments of buried distal tryptophan residues in the monomer mutant should be the same as those in dimers.
Fig. 1c shows the absorption and emission spectra of UVR8 WT and 3 mutants with certain tryptophan group(s) removed. Although absorption spectra of different protein samples have similar overall shapes with the peak at 282 nm and a shoulder at 290 nm, significant differences were observed in the red region beyond 300 nm (Fig. 1d). For WT and 6Wd + 4Wc, in which the Trp pyramid center is intact, the absorption spectra extend to above 320 nm, which may result from the exciton couplings among the 4 closely packed Wc.11,32 For 6Wd + 3Wp, although absorbance in the red tail region is much lower than WT due to mutation of the pyramid center, the spectrum still extends to 315 nm. In contrast, the mutant mono-6Wd, by mutating all interfacial 3Wp/4Wc, has negligible absorbance beyond 310 nm, indicating that Wd exhibits the bluest absorption among the 3 groups.
From the absorption spectra of the protein samples, absorption spectra of 3 groups of tryptophan residues were readily obtained by spectral subtraction (Fig. 1e). The spectrum data indicate that light with wavelength beyond 310 nm can be used to selectively pump Wp/Wc without exciting Wd. We further measured the emission spectra at 3 different excitation wavelengths (290 nm, 300 nm and 310 nm) with mutants containing 6Wd and various Wp. As shown in Fig. S1,† the emission spectra gradually red shift as the excitation is moved to longer wavelengths, due to the change of excitation ratios of Wp to Wd at various wavelengths. Spectra at 310 nm excitation exhibit a similar shape for all 6Wd + Wp mutants (Fig. S1h†), suggesting that 3Wp have nearly the same emission spectra. Absorption of 4Wc is further red shifted, with a red tail extending to above 325 nm. Thus, 315 nm light can be used to selectively excite 4Wc in UVR8 WT or 6Wd + 4Wc to obtain clean Wc fluorescence; 310 nm excitation in 6Wd + 3Wp provides Wp emission; 290 nm light was applied to mono-6Wd to acquire the Wd spectrum.
Emission spectra of the 3 groups of tryptophan are dramatically different (Fig. 1e): Wd shows a very blue emission with a peak at 320 nm; Wp has a fluorescence spectrum with a maximum at 340 nm (6Wd not excited at 310 nm); Wc exhibits the reddest emission (peak at 350 nm) among the 3 groups (only Wc excited at 315 nm). From our previous extensive studies of tryptophan fluorescence in proteins, Wd emission at 320 nm is unusually blue-shifted and typically from highly buried tryptophan, consistent with Wd locations in the middle of beta-propellers without water molecules within 5 Å. We also noticed that the Wd emission spectrum is structured and thus cannot be fitted with a lognormal function33 that fits typically Trp fluorescence spectra. A structured emission spectrum was also observed for a highly buried Trp in azurin.34 In contrast, Wp and Wc, located at the dimer interface, display redder emission compared to Wd. Water molecules and possibly nearby charged residues stabilize the tryptophan 1La excited state, which has a large dipole moment.35
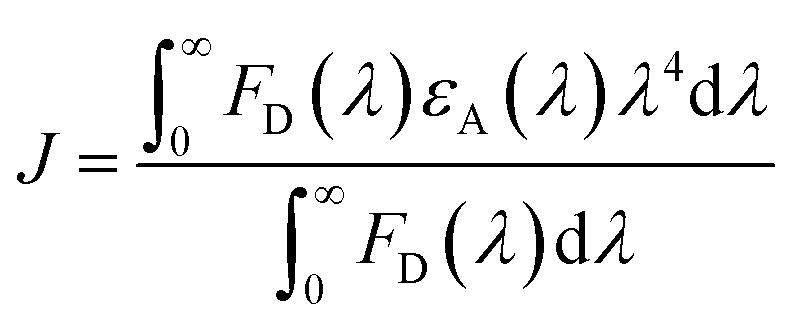
As shown in Fig. 1f, there are overlapping regions between absorption and emission spectra of 3 Trp groups, leading to possible RET. The tryptophan spectra in Fig. 1e reveal an energetic ordering that favors excitation-energy flow from 6Wd to 3Wp/4Wc and from 3Wp to 4Wc. As shown in Fig. 1g, the spectral overlap integrals (J, eqn (6)) for Wd-to-Wp, Wd-to-Wc and Wp-to-Wc RET are 1.38 × 10⁻¹⁶ cm3 M−1, 2.67 × 10⁻¹⁶ cm3 M−1 and 7.21 × 10⁻¹⁷ cm3 M−1, respectively, whereas J values for the corresponding backward transfer are 1.01 × 10⁻¹⁷ cm3 M−1, 4.08 × 10⁻¹⁸ cm3 M−1 and 9.26 × 10⁻¹⁸ cm3 M−1, respectively, which are much smaller than those for the forward transfer. Thus, the backward RET is negligible and the excitation energy is transferred in one direction from the 6Wd ring to the interface Trp, where the energy is then funneled to the critical 4Wc center. Also, the intra-group J values between 6Wd or 3Wp are much smaller than those between inter-groups. Photosynthesis light harvesting often uses a variety of pigments with different spectra to govern energy-transfer direction.36 Here, UVR8 contains only one type of chromophore, the amino acid tryptophan, with spectral tuning by local environments to create a driving force for excitation energy flow.
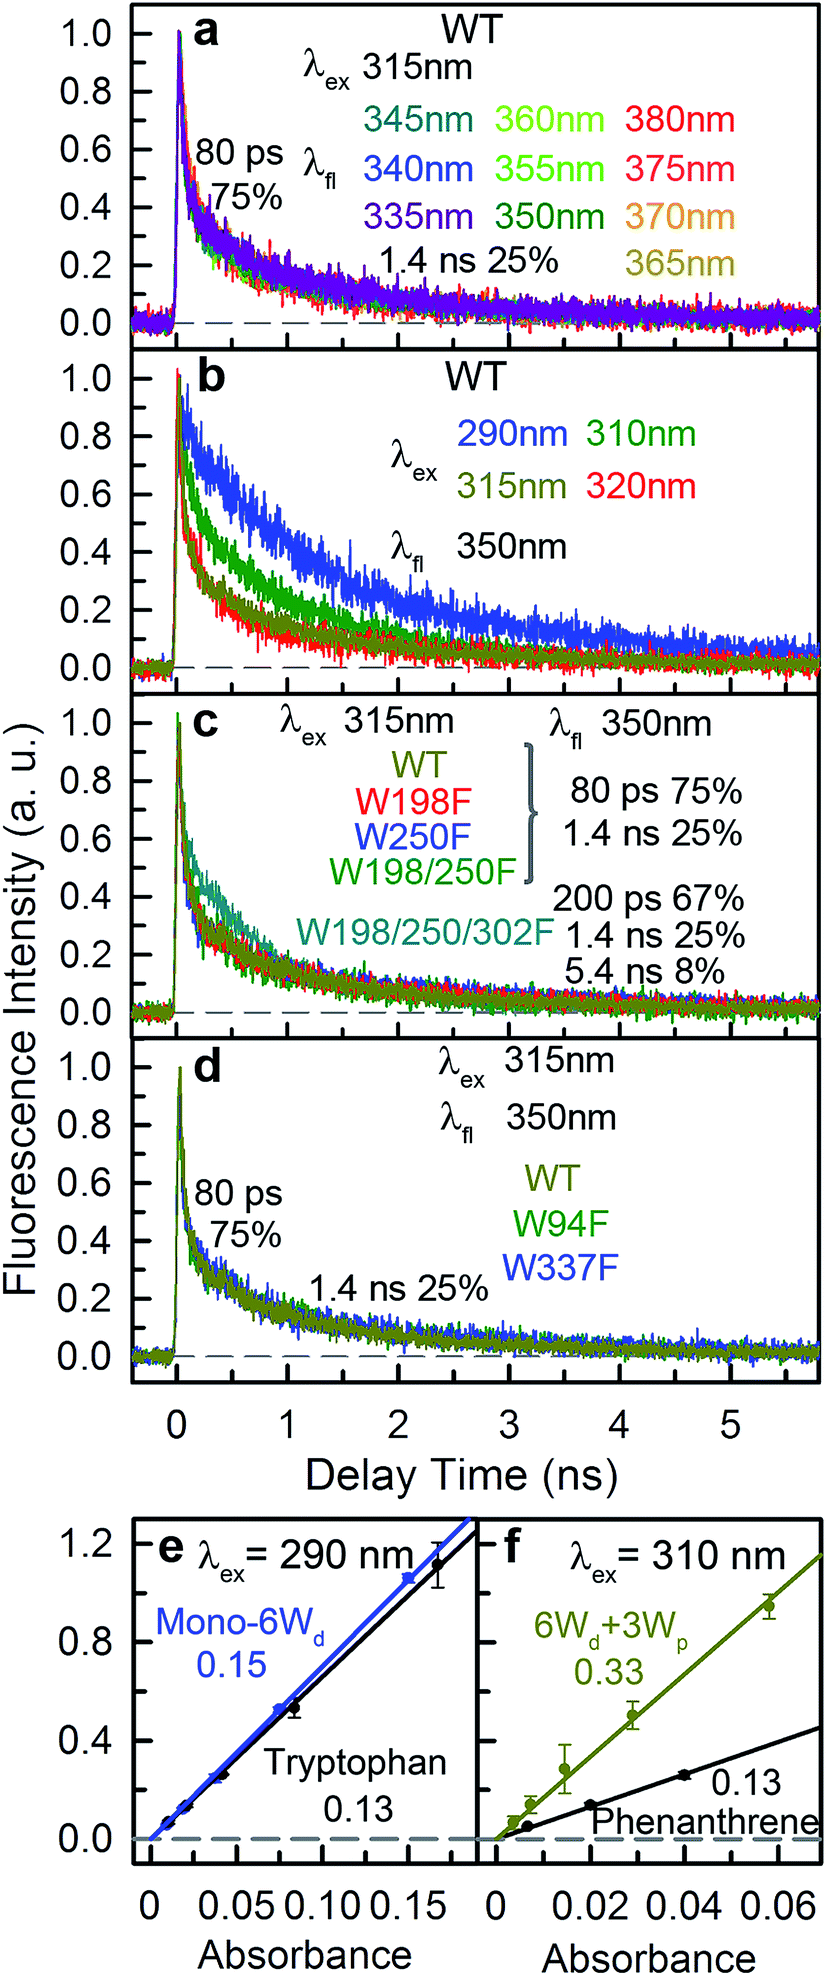
Resonance energy transfer from distal Wd ring to interfacial Wp and Wc
We next experimentally studied RET dynamics from 6Wd to the dimer interface by determining lifetime changes of Wd with and without the Wp/Wc energy acceptors. First, we need to determine the lifetimes of mono-6Wd and related emission spectra without RET. Fig. 2a shows femtosecond-resolved fluorescence transients of mono-6Wd, which have two lifetimes without RET and show no ultrafast component. Combining the fs- and ps-resolved (Fig. 2a and b) data, the two lifetimes of 6Wd were determined to be 500 ps and 2.7 ns, with amplitude percentages of 29% and 71%, respectively, at the emission peak of 320 nm. As shown in Fig. 2c, the amplitude ratio of the 500 ps component gradually increases at shorter fluorescence wavelengths. With the fitted amplitudes from 300 nm to 360 nm, the associated spectra of the two Wd lifetimes were decomposed from the Wd total fluorescence spectrum (Fig. 2d, 6Wd1 and 6Wd2). The contribution from the 0.5 ns spectrum is minor; the 2.7 ns component is dominant due to a longer timescale and larger amplitude.
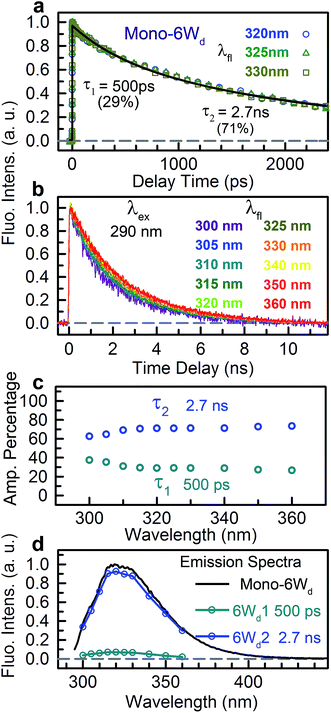 |
| | Fig. 2 Fluorescence lifetimes of 6Wd. (a) Fluorescence transients at fs time resolution of mono-6Wd. (b) Fluorescence transients of mono-6Wd measured by ps-resolved TCSPC. Note the fluorescence wavelengths labeled. (c) Amplitude percentages of 0.5 ns and 2.7 ns lifetimes at different fluorescence wavelengths. (d) Lifetime-associated spectra of 0.5 ns (6Wd1) and 2.7 ns (6Wd2) time constants. | |
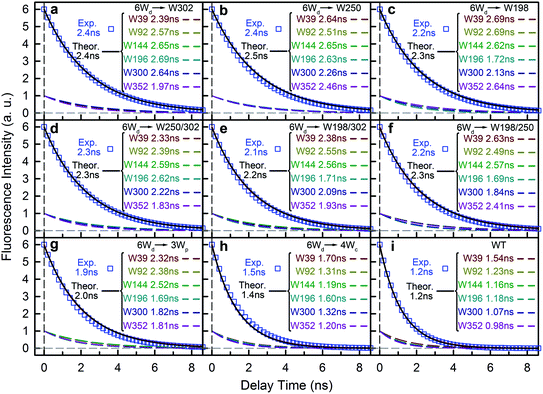
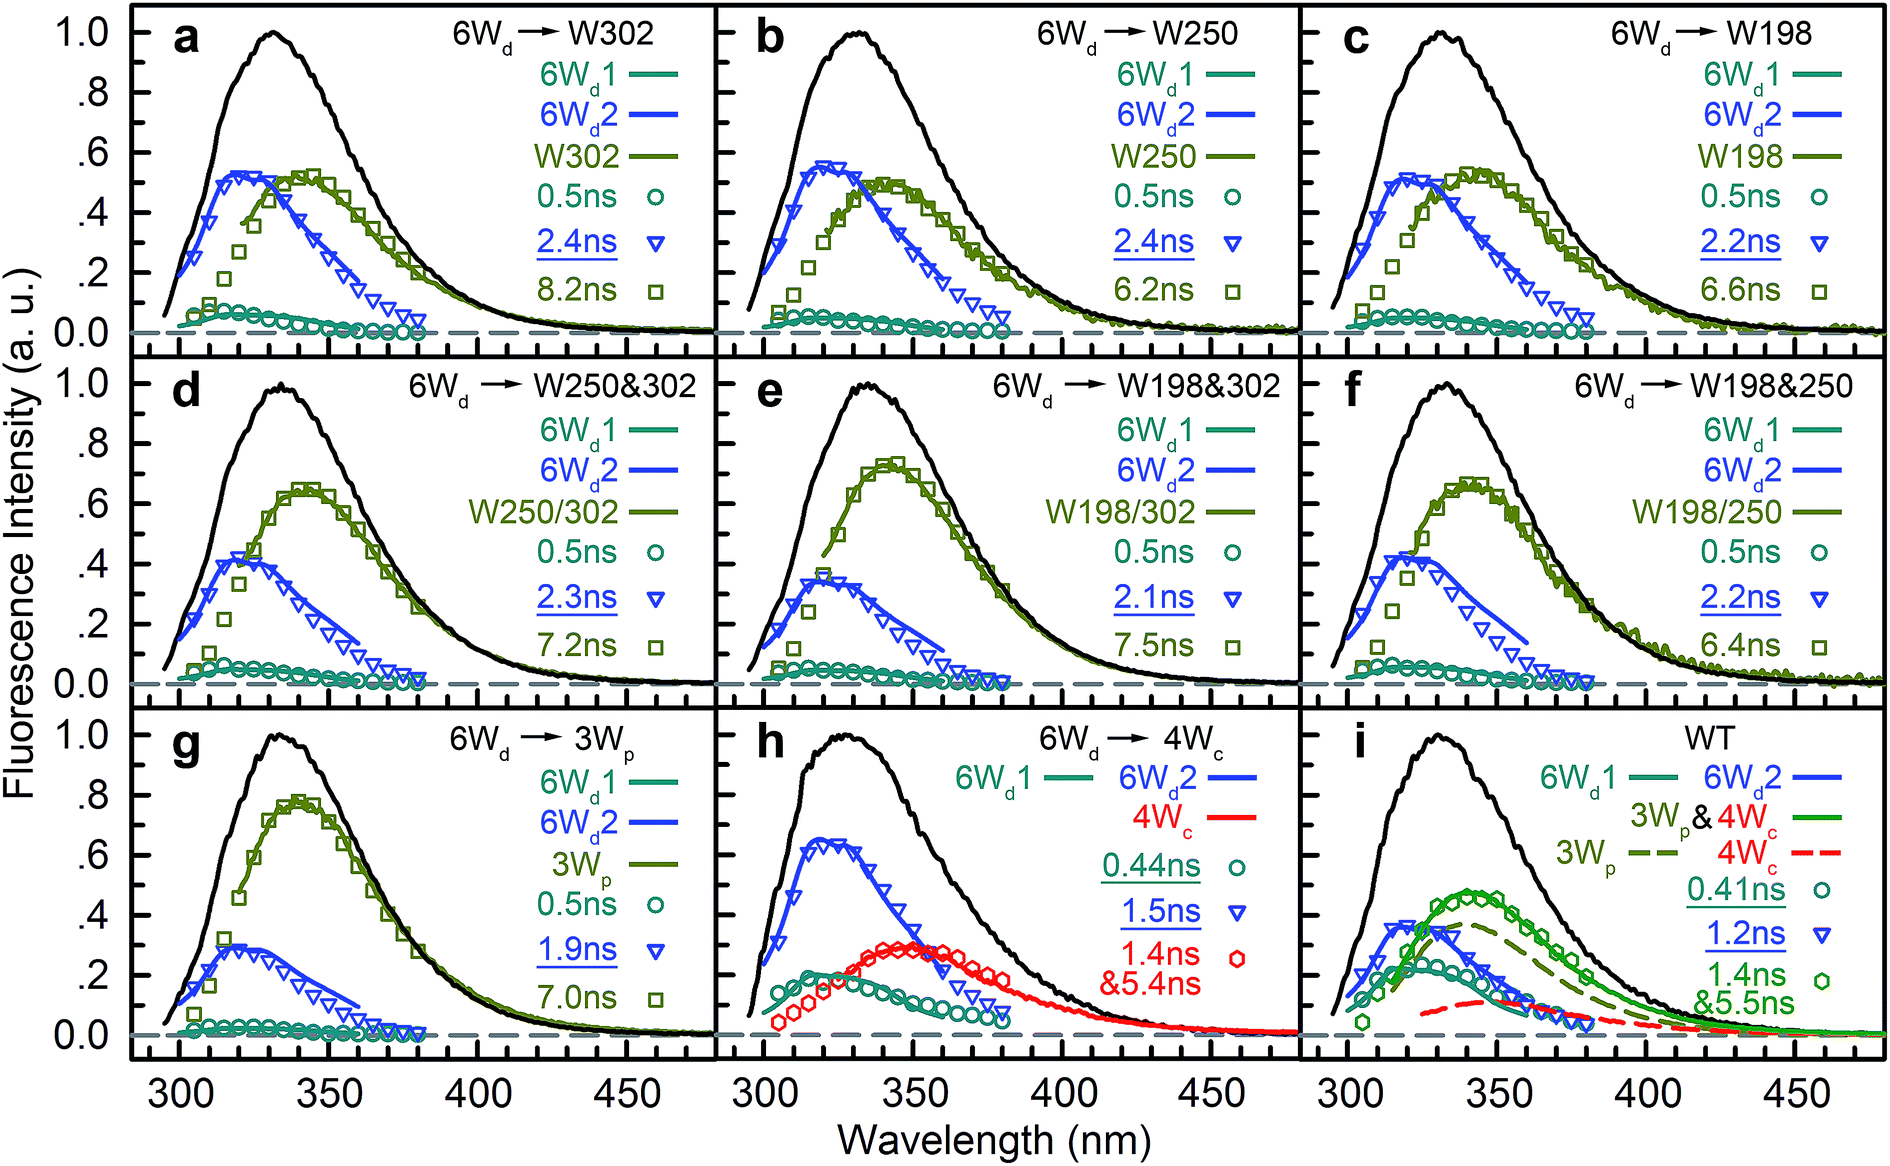
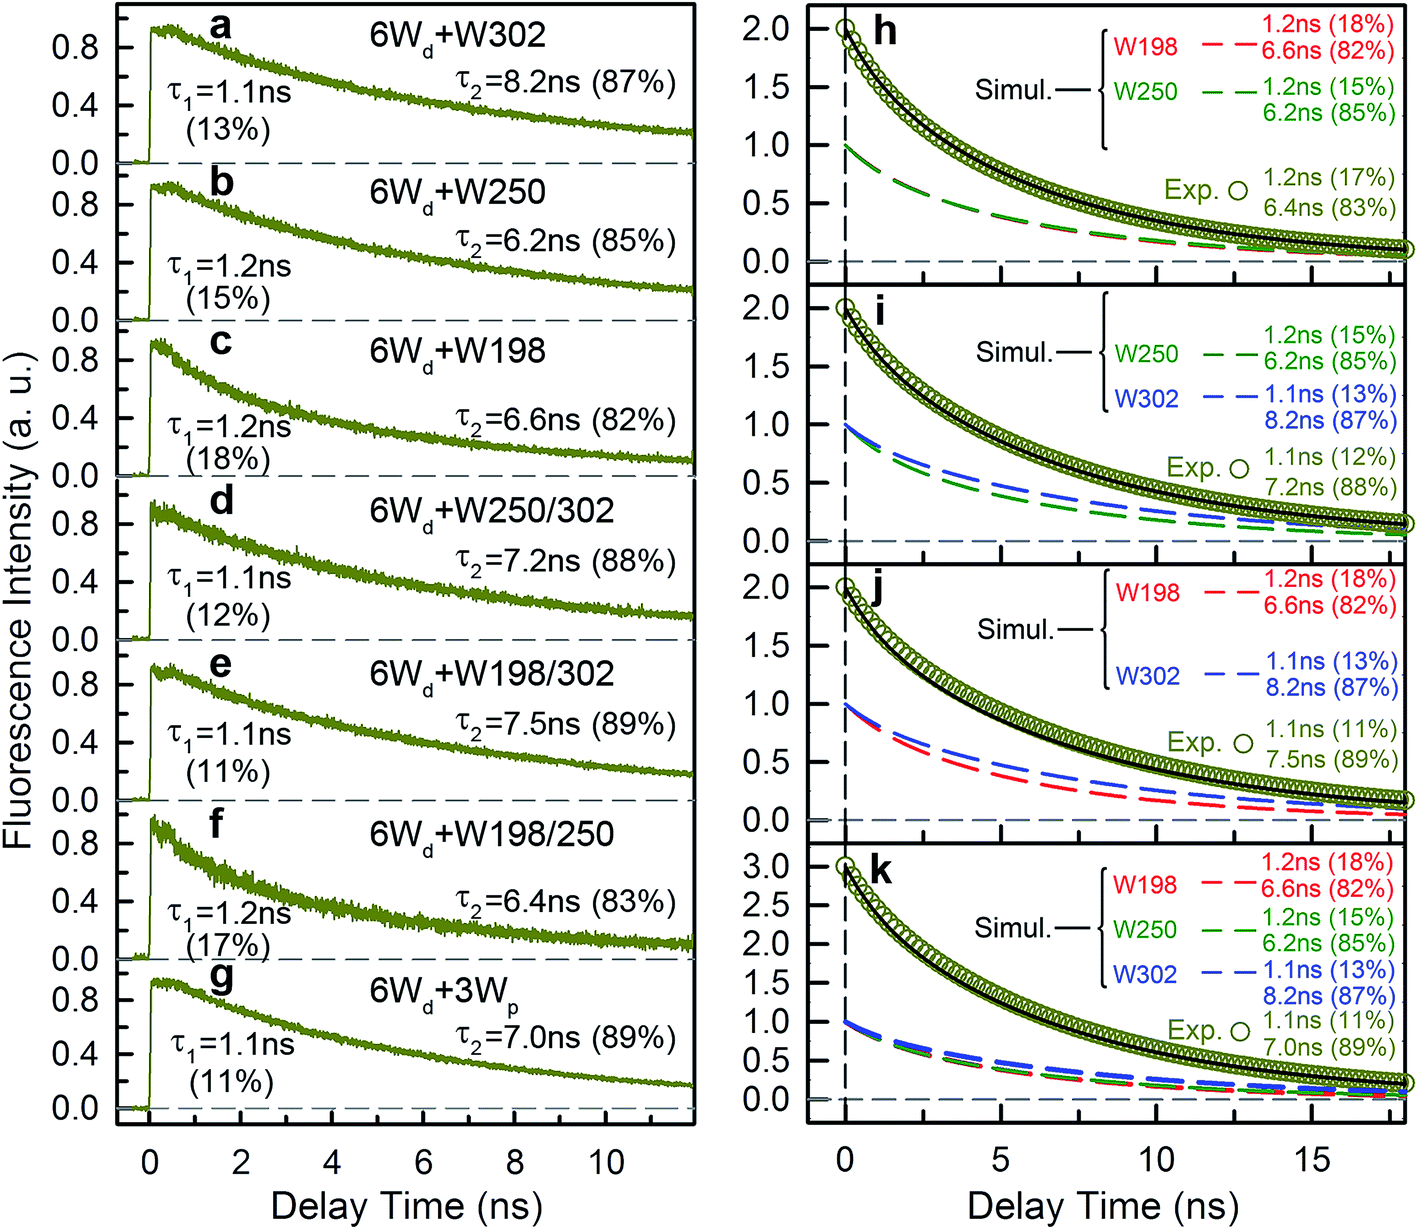
To investigate RET dynamics and determine the transfer timescales, we measured the fluorescence transients of a series of mutants containing 6Wd and various interfacial Trp residues (Table S1†): 6Wd + 1Wp (Fig. 3a–c), 6Wd + 2Wp (Fig. 3d–f), 6Wd + 3Wp (Fig. 3g), 6Wd + 4Wc (Fig. 3h) and WT (Fig. 3i). We expect to observe decreased Wd lifetimes due to additional RET channels. For each mutant, transients from 16 detection wavelengths (305 nm to 380 nm with 5 nm intervals) were measured using sub-nanosecond resolved TCSPC in order to follow the complete decay dynamics. For 6Wd + Wp mutants in Fig. 3a–g, transients at various wavelengths are dramatically different: fluorescence at the red side contains more of slow dynamics in 6–8 ns from Wp lifetimes; data at shorter wavelengths show more contribution from 6Wd dynamics because of their blue emission. In 6Wd + 4Wc, however, all TCSPC transients look similar because the fluorescence in 4Wc is dominantly quenched in 80 ps (see below) and does not show significant contributions under this sub-ns time resolution, leaving the majority signal from 6Wd in all wavelengths. Significantly, we did not observe much 6–8 ns components (Wp lifetime without RET) in WT (Fig. 3i), suggesting that Wp lifetimes become faster due to energy transfer to 4Wc.
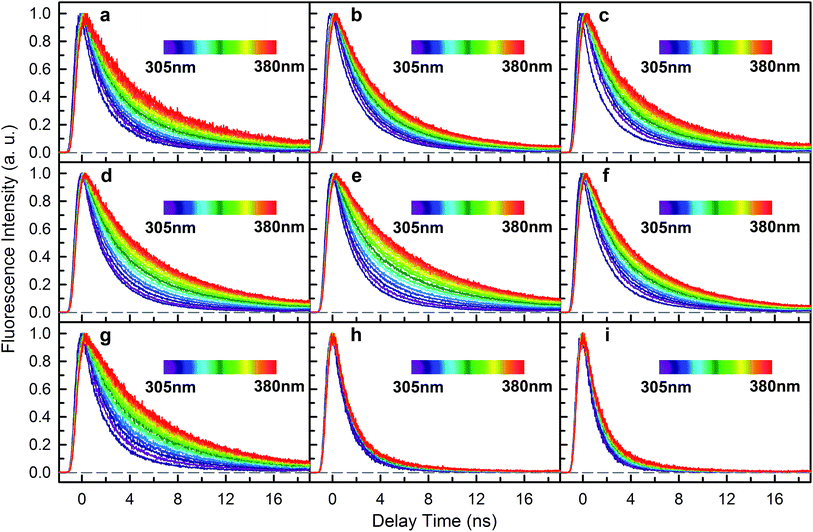 |
| | Fig. 3 Fluorescence decay transients (λex = 290 nm) from 305 nm to 380 nm (5 nm intervals) for UVR8 WT and 8 mutants measured with sub-nanosecond-resolved time correlated single photon counting (TCSPC). (a) 4Wc/198/250F (6Wd + W302). (b) 4Wc/198/302F (6Wd + W250). (c) 4Wc/250/302F (6Wd + W198). (d) 4Wc/198F (6Wd + W250/302). (e) 4Wc/250F (6Wd + W198/302). (f) 4Wc/302F (6Wd + W198/250). (g) 6Wd + 3Wp. (h) 6Wd + 4Wc. (i) WT. | |
To determine Wd lifetimes with RET, the TCSPC data in Fig. 3 were analyzed using global fitting, in which transients at different detection wavelengths were fitted using the same set of time constants with varying amplitude percentages (fitting parameters in Tables S2–S10†). Lifetime associated spectra were constructed for the observed time scales (symbols in Fig. 4) and were then compared with directly measured spectra (solid lines) to determine their origin. The decay transients of the 6Wd + Wp mutants (Fig. 4a–g) were fitted with 3 exponential components: 0.50 ns, 1.9–2.4 ns and 6–8 ns. Since the 6–8 ns lifetimes were not observed in mono-6Wd and their associated spectra are the same as Wp emission, they are from fluorescence lifetimes of Wp. Owing to different local environments, W198, W250 and W302 show time scales of 6.6 ns, 6.2 ns and 8.2 ns, respectively (Fig. 4a–c). The 0.50 ns lifetime (6Wd1) of Wd is much faster than RET time scales to Wp and does not change in the presence of the Wp acceptors. The 1.9–2.4 ns components come from the original 2.7 ns Wd lifetime (6Wd2) and are faster with additional RET channels to Wp. Moreover, this time scale decreases when more Wp are present, consistent with faster energy transfer with more RET acceptors. With the numbers from the three “6Wd + 1Wp” mutants and ∼3% fitting error, the RET to W198, W250 and W302 was calculated to be 12 ± 1.4 ns, 22 ± 4.3 ns and 24 ± 4.9 ns, respectively. By adding the 3 rates together, the total RET time is 5.9 ns, agreeing well with the 6.4 ± 0.6 ns time measured directly from the 6Wd + 3Wp mutant.
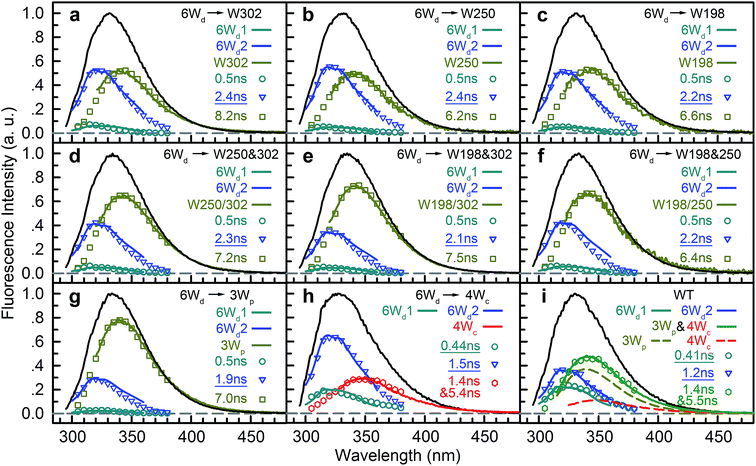 |
| | Fig. 4 Time scales from a global fitting and lifetime-associated spectra. (a) 4Wc/198/250F (6Wd + W302). (b) 4Wc/198/302F (6Wd + W250). (c) 4Wc/250/302F (6Wd + W198). (d) 4Wc/198F (6Wd + W250/302). (e) 4Wc/250F (6Wd + W198/302). (f) 4Wc/302F (6Wd + W198/250). (g) 6Wd + 3Wp. (h) 6Wd + 4Wc. (i) WT. | |
For 6Wd + 4Wc and WT (Fig. 4h and i), four decay components were needed to globally fit the transients. In 6Wd + 4Wc, judging from the associated spectra, the 0.44 ns and 1.5 ns are the 2 lifetimes of Wd; the 1.4 ns and 5.4 ns are from 4Wc. The lifetime of 6Wd1 is decreased to 0.44 ns from the previous 0.50 ns due to faster RET to 4Wc than to Wp. The 6Wd2 lifetime changed to 1.5 ns from 2.7 ns, resulting in a 3.4 ± 0.2 ns RET time scale. In WT, the 0.41 ns associated spectrum is redder (peak at 330 nm) than the 6Wd1 spectrum, suggesting possible Wp-to-Wc energy transfer on similar time scales, leading to mixing of the Wp emission in this component. The 2.7 ns lifetime changes to 1.2 ns by the 2.2 ± 0.2 ns RET to all interfacial Trp, the same as the total RET time calculated with separately measured 6.4 ± 0.6 ns transfer to 3Wp and 3.4 ± 0.2 ns RET to 4Wc. WT shows the fastest RET in all samples, leading to a 44 ± 0.6% energy-transfer efficiency of 6Wd.
To explain the two other time scales observed in 6Wd + 4Wc and WT, we studied 4Wc fluorescence decay dynamics. By 315 nm excitation with ps-resolved TCSPC in WT, we found that 4Wc has two lifetimes (Fig. 5a): 80 ps (75%) and 1.4 ns (25%). As shown in Fig. 5b, 315 nm and 320 nm excitation transients are similar since both only excite 4Wc, whereas 290 nm and 310 nm light bring in Wd/Wp signals, leading to slower overall dynamics. In sub-ns resolved TCSPC data, where 80 ps cannot be resolved, 1.4 ns and 5.4 ns components were observed in 6Wd + 4Wc and their total spectrum agrees with 4Wc emission (Fig. 4h). The 1.4 ns component is consistent with the same time scale of 4Wc under ps time resolution, but the 5.4 ns component was not observed in WT 315 nm excitation data. From mutant studies in Fig. 5c, the 5.4 ns component in 6Wd + 4Wc was introduced by mutation of all 3Wp, which probably causes local structural changes of 4Wc, resulting in less efficient quenching. But the 4Wc absorption red tail (Fig. 1d) was not suppressed in 6Wd + 4Wc by this structural perturbation and RET from 6Wd to 4Wc also seems unaffected. Interestingly, mutation of W198, W250 or both does not bring the 5.4 ns fluorescence dynamics to 4Wc, suggesting important structural roles of W302, but not W198 or W250. In WT, although we observed similar time scales of 1.4 ns and 5.5 ns (Fig. 4i), their total spectrum is bluer than the 4Wc emission, clearly indicating that the latter is from Wp. The 5.5 ns is close to the 7.0 ns lifetime measured in 6Wd + 3Wp (Fig. 4g), suggesting Wp-to-Wc RET also has slow components. Energy-transfer rates depend on orientation factors (κ2) and donor–acceptor distances (R), and both are sensitive to protein structural fluctuations.37,38 The flexible loop regions at the dimer interface can lead to broad rate distributions of Wp-to-Wc energy transfer. We further investigated the reason for 4Wc double exponential decay by mutating two noncritical Wc: W94 and W337. Both mutants of W94F and W337F show similar decay dynamics to WT (Fig. 5d), indicating that the 1.4 ns component is not from any individual Wc and may result from structural fluctuations of 4Wc, i.e., the cluster can sample conformations with slower fluorescence quenching.
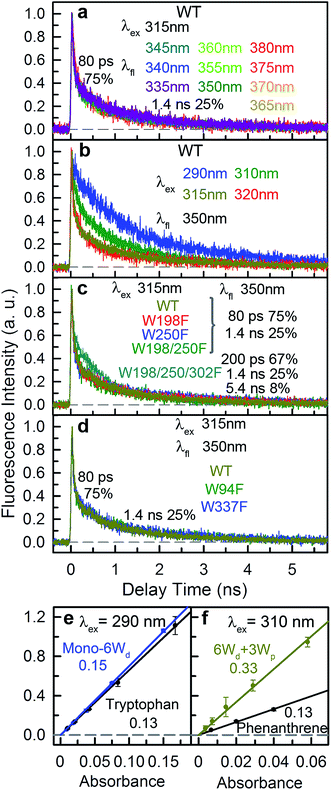 |
| | Fig. 5 Fluorescence lifetime of Wc and fluorescence quantum yields of Wd/Wp. (a) Fluorescence decay transients of 4Wc measured with WT (λex = 315 nm). (b) Decay transients at 350 nm with various excitation wavelengths (λex = 290 nm, 310 nm, 315 nm and 320 nm) for WT. (c) Fluorescence dynamics of the pyramid center measured for WT, W198F, W250F, W198/250F and W198/250/302F (6Wd + 4Wc). All transients are similar except that for 6Wd + 4Wc with an extra 5.4 ns slow decay constant. (d) Fluorescence dynamics of Wc measured by 315 nm excitation for WT, W94F and W337F. (e and f) Fluorescence quantum yields (QF) of (e) Wd and (f) Wp, measured using the tryptophan and phenanthrene standards, respectively. | |
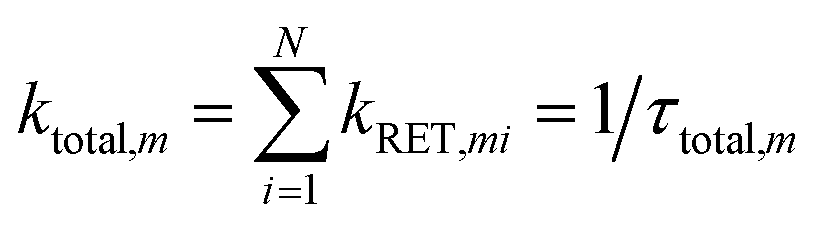
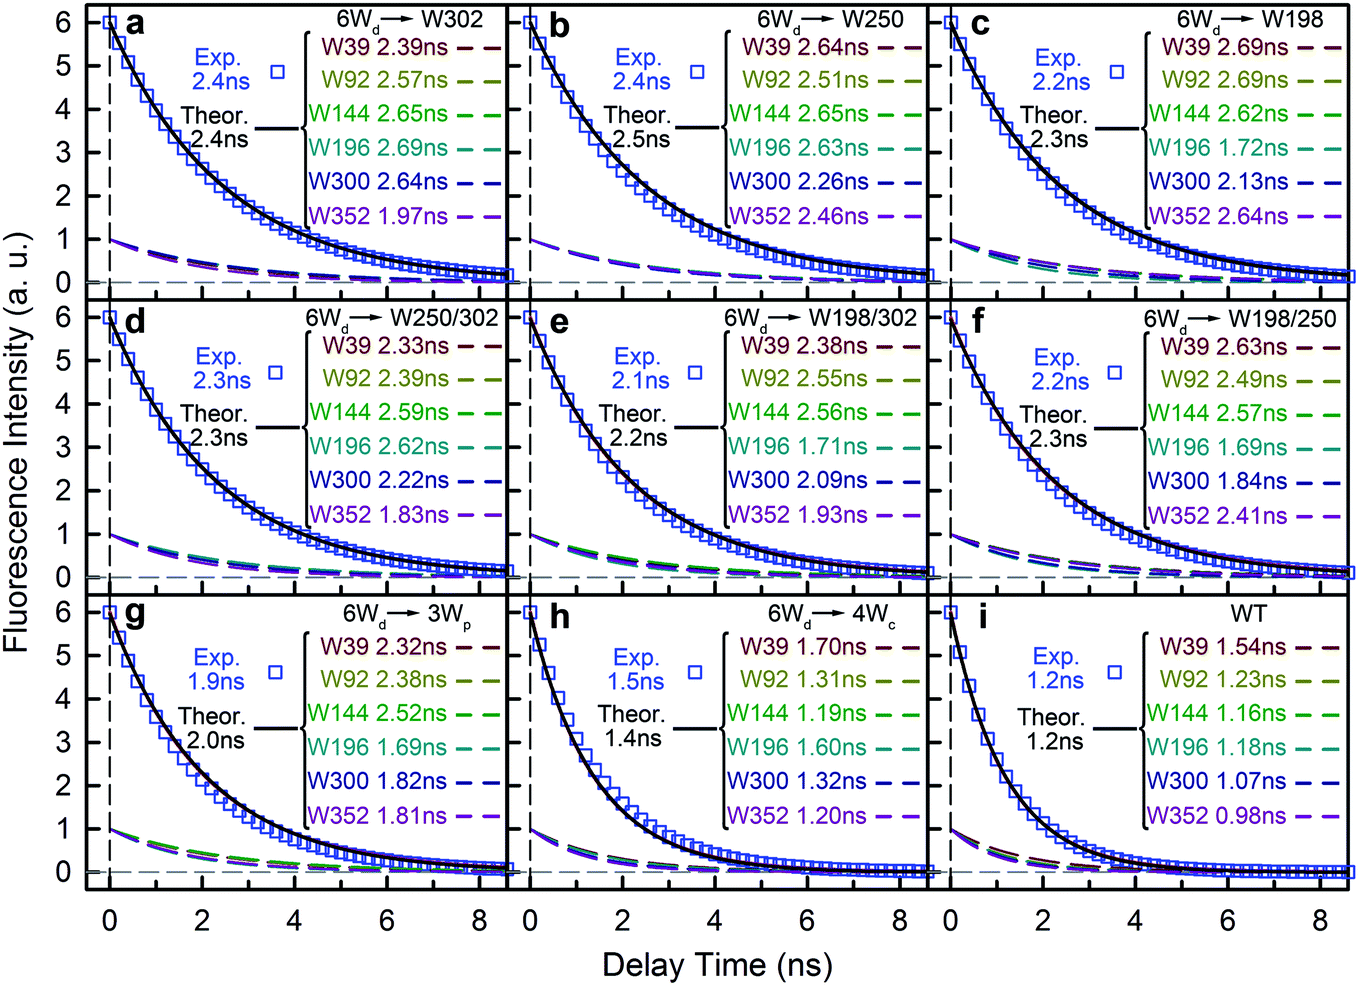
The time resolved experiments determined the overall RET rates of 6Wd but cannot provide energy-transfer time scales for individual donor–acceptor pairs or detailed RET rate distributions from structural fluctuations. To reveal this information, we next applied QM/MM computations and FRET theory to obtain the RET rates for all 84 possible donor acceptor pairs: 6Wd to 14 interfacial Wp/Wc on both subunits. To model both fast and slow protein fluctuations, we conducted a 2 μs MD simulation of UVR8 and evenly took 500 structures from the trajectory (4 ns interval) for RET rate calculations. In each structure, transition dipole moments were calculated with the TDDFT/MM level of theory for all tryptophan residues to obtain orientation factors (κ2). With spectral overlap integrals (J in Fig. 1g), donor lifetimes (τD, Fig. 2), fluorescence quantum yields (QD, Fig. 5e and f), donor–acceptor distances (R) in MD structures and a refractive index of 1.33,39 we obtained RET rate distributions for all 84 RET pathways (Fig. 6a). The energy-transfer rates span from 10−3 to 10−1 ns−1 for different pairs, due to varying κ2/R6 values. For each donor–acceptor pair, we found that R values can fluctuate by 1–2 Å and κ2 values vary significantly from 0 to 4 in different MD structures by protein fluctuations. Importantly, all Wd can transfer energy to interfacial Trp residues on the other subunit, leading to inter-subunit energy transfer. Among the 6Wd, W39, W196, W300 and W352, prefer energy transfer to Trp on the same monomer, whereas W92 and W144 show significant RET to Wp/Wc on both monomers. It is also worth noting that 6Wd prefer direct energy transfer to Wc, especially to W285 and W233. As shown in Fig. 6b, the total RET rates to 4Wc are much faster than to 3Wp, due to more favorable transition dipole moment coupling and greater spectral overlap between Wd and Wc. With the RET rate distributions from 500 MD structures and the 2.7 ns Wd lifetime, we simulated fluorescence decay transients for each Wd in the presence of each individual acceptor (84 transients shown in Fig. S2†) by averaging 500 single exponential decays curves. Since the decay time scales are close in various protein conformations, all 84 simulated transients can be fitted with single exponential decays. Using the difference between these fitting values and the 2.7 ns original decay time, we calculated the effective RET time for each donor–acceptor energy-transfer pathway. We thus simplified broad rate distributions to single effective rates (Table S11†) that give the same Wd excited state decay dynamics and the same RET efficiency. The resultant effective RET times were schematically presented in Fig. 6c, revealing a complicated light-harvesting network. By adding up the rates of 14 parallel RET for each Wd (eqn (8)), total RET time constants (τtotal) were obtained as 3.6 ns, 3.1 ns, 1.7 ns, 3.0 ns, 1.4 ns and 1.8 ns for W39, W92, W144, W196, W300 and W352, respectively. We also calculated the 84 RET rates (Table S11† values in brackets) and τtotal with the static X-ray structure (Fig. 6c) for comparison with values from 500 MD snapshots. The two methods provide very different RET time scales for individual pathways as κ2/R6 is sensitive to tryptophan distances and orientations. But the resultant τtotal values are close because a sum of 14 rates reduces fluctuations, i.e., one conformation that favors one RET pathway may impede another parallel channel, leaving the total rate nearly constant. Although the theoretical studies with fluctuations give very similar results as we obtained, such a picture may not explain an interface energy transfer from Wp to Wc as discussed in the following section of the paper.
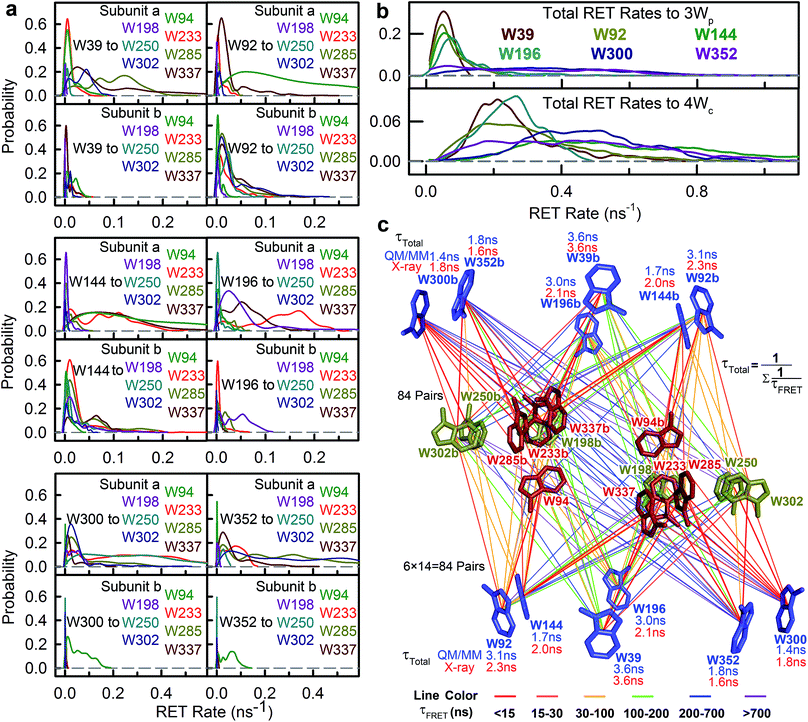 |
| | Fig. 6 RET from Wd to Wp/Wc. (a) RET rate distributions for all 84 donor–acceptor pairs from QM/MM calculations. (b) RET rate distributions for each Wd to total 3Wp (top) and to 4Wc (bottom) based on QM/MM methods. (c) The energy-transfer pathways from all Wd to 14 interfacial W residues (3Wp + 4Wc on both subunits). The total RET time constants based on QM/MM (blue) and on X-ray structure (red) are shown near each Wd. Each line represents one energy-transfer pathway. Colors of the lines are based on effective RET time constants. The dominant paths are shown in red. | |
To further compare the theoretical scheme with experimental data, we conducted numerical simulations of Wd fluorescence decay dynamics. The decay curves of the original 2.7 ns components were simulated for mutants and WT (Fig. 7 dashed lines) using the effective RET times from the theory (eqn (9) and (10)). In the presence of acceptors, the 6Wd donors have distinct RET rates due to asymmetrical locations of Wp/Wc, giving different decay curves (Fig. 7 dashed lines). However, by summing the 6 different single exponential decay curves, the total fluorescence decay of 6Wd can be perfectly described with a single time that agrees extremely well with experimental 6Wd2 lifetimes measured in Fig. 4, showing consistency between theory and experiments. The experimentally determined RET times mentioned above thus represent averaged RET rates of 6Wd. Using the theoretical scheme in Fig. 6c, the overall energy-transfer efficiency for 6Wd was calculated to be 44% (Table S12†), in excellent agreement with the 44 ± 0.6% experimental value. These findings demonstrate that excitation energy flow from Wd to Wp/Wc follows the RET network shown in Fig. 6c, with tens of RET pathways from the buried Wd to the dimer interface.
 |
| | Fig. 7 Model simulations demonstrate that the total fluorescence decay dynamics of the 6Wd in UVR8 can be described with single exponential decays in various UVR8 protein mutants. (a) 4Wc/198/250F (6Wd + W302). (b) 4Wc/198/302F (6Wd + W250). (c) 4Wc/250/302F (6Wd + W198). (d) 4Wc/198F (6Wd + W250/302). (e) 4Wc/250F (6Wd + W198/302). (f) 4Wc/302F (6Wd + W198/250). (g) 6Wd + 3Wp. (h) 6Wd + 4Wc. (i) WT. The simulated total decay dynamics of the 6Wd (black solid lines, sum of the 6 dashed lines) can be fitted with a single decay time constant, which agrees well with experimental time scales. | |
Resonance energy transfer from the peripheral Wp outlier to the central Wc pyramid
To study Wp energy transfer, we applied the ps-TCSPC method to measure the fluorescence lifetimes of the donors alone without RET using seven 6Wd + Wp mutants at 310 nm excitation (shown in Fig. 8), and all transients exhibit typical double exponential decay of tryptophan fluorescence. With three 6Wd + 1Wp mutants (Fig. 8a–c), we determined fluorescence lifetimes of each individual Wp: W302 (1.1 ns, 13% and 8.2 ns, 87%); W250 (1.2 ns, 15% and 6.2 ns, 85%); W198 (1.2 ns, 18% and 6.6 ns, 82%). The second lifetimes in several nanoseconds are dominant and they completely agree with the time scales observed in sub-ns resolved TCSPC data (Fig. 4). The 1.1 ns and 1.2 ns fast components were not noticed in sub-ns data because of their minor percentages (<4%) in the overall signal with Wd, causing them to be mixed with other time scales. Fig. 8d–g show the fluorescence decay dynamics of Wp combinations measured with 6Wd + 2Wp and 6Wd + 3Wp mutants. Using the fitting parameters, we simulated the 2Wp and 3Wp fluorescence decay curves (Fig. 8h and k symbol), and they match the sum of individual Wp lifetime decay dynamics measured in 6Wd + 1Wp mutants (Fig. 8h and k), suggesting no significant RET among the 3Wp.
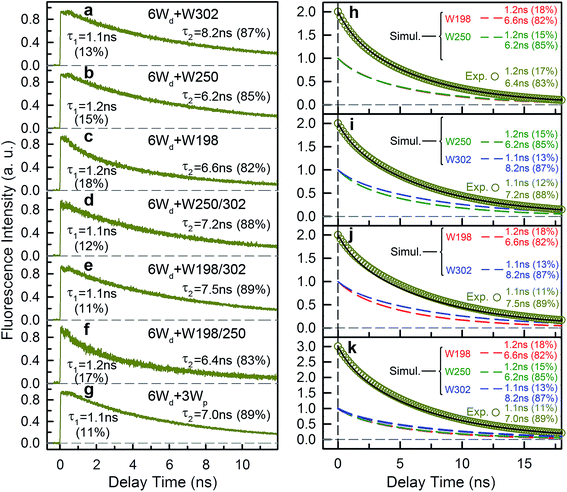 |
| | Fig. 8 Wp fluorescence lifetimes. (a–g) Fluorescence decay transients (λex = 310 nm) at 340 nm fluorescence wavelength for 7 mutants: (a) 4Wc/198/250F (6Wd + W302). (b) 4Wc/198/302F (6Wd + W250). (c) 4Wc/250/302F (6Wd + W198). (d) 4Wc/198F (6Wd + W250/302). (e) 4Wc/250F (6Wd + W198/302). (f) 4Wc/302F (6Wd + W198/250). (g) 6Wd + 3Wp. (h–k) Numerical simulations show that the Wp lifetimes observed in 6Wd + 2Wp mutants and 6Wd + 3Wp mutants match the sum of decay transients of 6Wd + 1Wp. The mutants: (h) 6Wd + W198/250; (i) 6Wd + W250/302; (j) 6Wd + W198/302; (k) 6Wd + 3Wp. For each mutant, decay transients of individual Wp (colored dashed lines, red-W198; green-W250; blue-W302) were simulated using a double exponential decay model experimentally measured parameters from 6Wd + 1Wp mutants, which add up a total decay transient (black solid line). The total transients agree with the simulated curves (dark yellow circles) using time constants and ratios directly measured in 6Wd + 2Wp and 6Wd + 3Wp mutants. | |
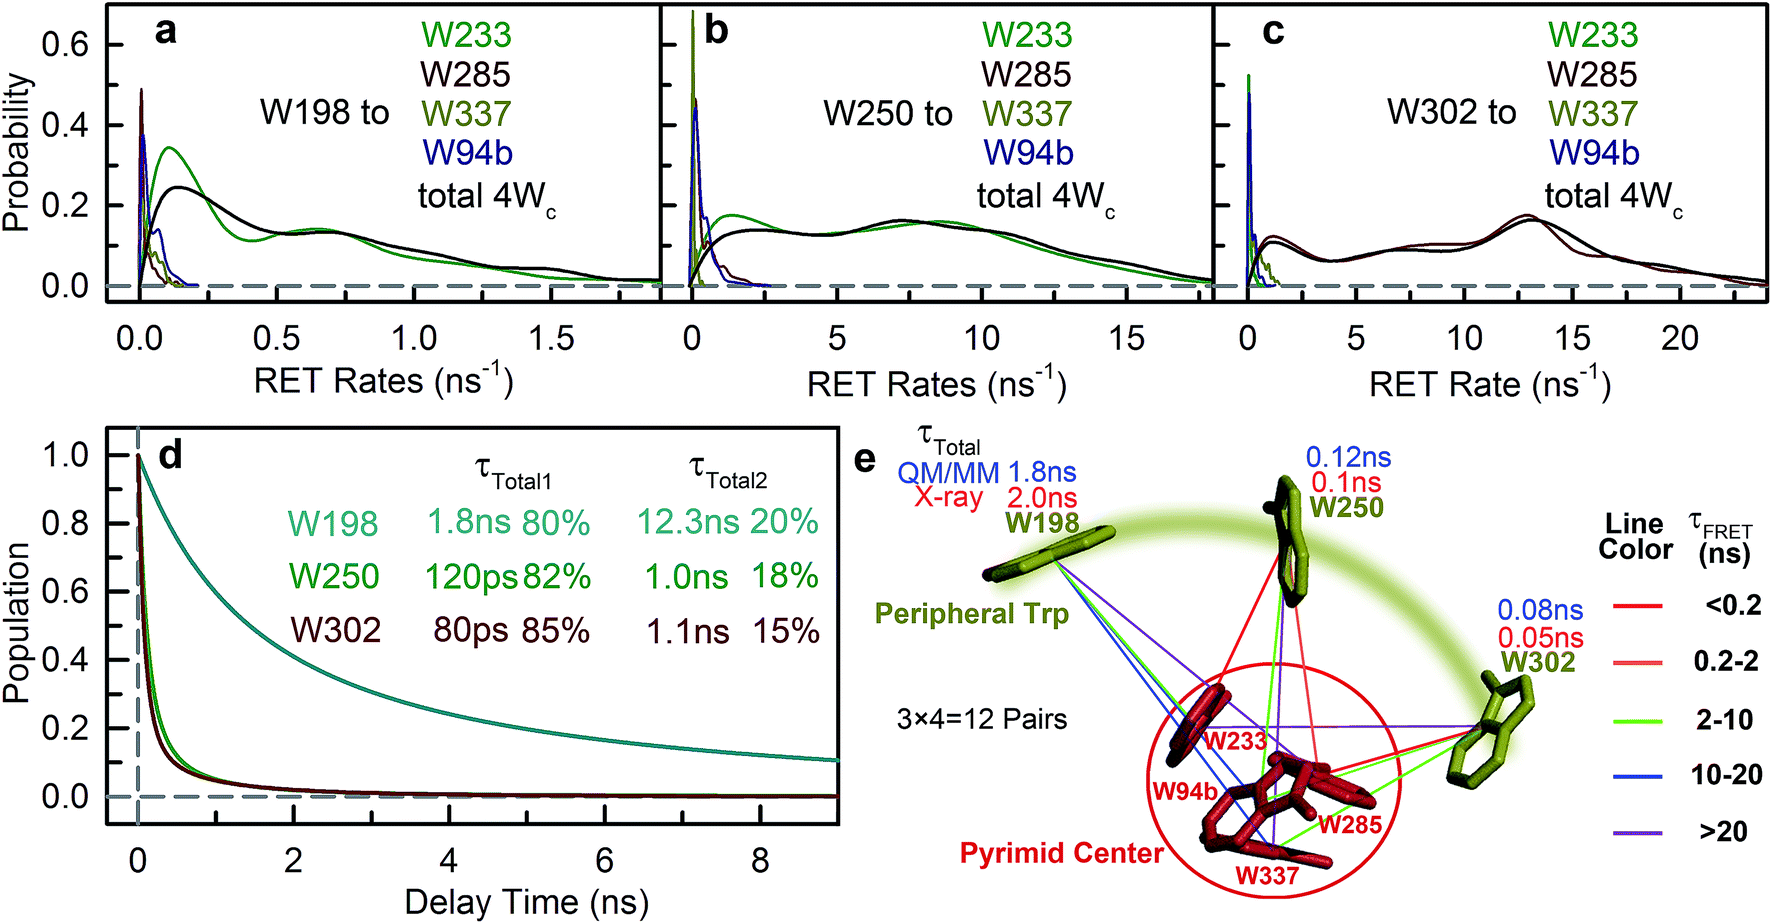
With Wp lifetimes (Fig. 8a–c), the fluorescence quantum yield (Fig. 5f) and other values, we calculated RET rate distributions from Wp to Wc with 500 MD structures, following the procedure described in the previous section. Since Wp RET to the distant pyramid center is negligible, we only show the 12 rate distributions for 3Wp to 4Wc in the nearby cluster (Fig. 9a–c). Due to shorter donor–acceptor distances, RET time scales here fall in the range of tens of picoseconds to nanoseconds, significantly faster than Wd RET. We found that W198, W250 and W302 mainly transfer energy to W233, W233 and W285, respectively, with the rate distributions close to their total RET rates to 4Wc. The RET pathways are consistent with their respective distances and orientation factors. Like Wd, RET dynamics of Wp were obtained by adding 500 different single exponential decay curves based on calculated RET times in 500 MD snapshots (Fig. 9d). For Wd-to-Wp/Wc channels, all 500 RET rates are small, and thus all 500 decay times are in a narrow range between 1.8 ns and 2.7 ns, making the averaged decay dynamics close to single exponential decays. However, for Wp-to-4Wc, the time scales range from tens of picoseconds to nanoseconds, unable to be described with a single decay time. For all 3Wp, the RET dynamics were effectively fitted with two timescales: a dominant fast component (τtotal1) and a slow one (τtotal2) with smaller amplitudes (Fig. 9d). Compared with W250 and W302, which have a τtotal1 of 120 ps and 80 ps, respectively, W198 has a dramatically slower τtotal1 of 1.8 ns, owing to unfavorable orientations and longer distances. τtotal2 are on nanosecond time scales, representing a small fraction of Wp with slow RET to the pyramid center. Because both Wp to Wc are located in the flexible loop regions, UVR8 protein may sample conformations, resulting in distributions of RET. When using the X-ray structure for the calculations, single RET times of 2.0 ns, 100 ps and 50 ps were obtained for W198, W250 and W302, respectively, which are in line with the τtotal1 fast RET times (Fig. 9e).
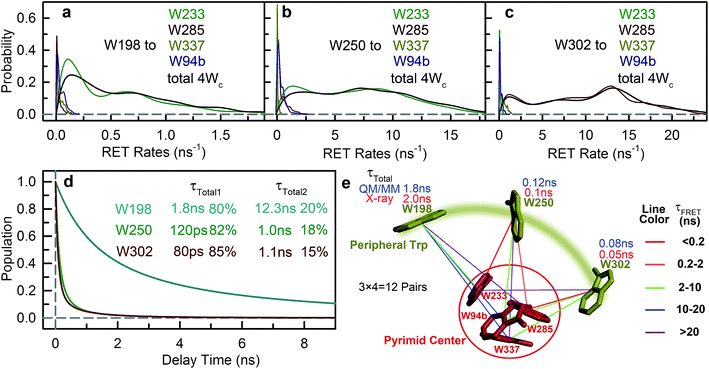 |
| | Fig. 9 RET rate distributions based on QM/MM calculations for each Wp–Wc pair. (a) W198 as the donor. (b) W250 as the donor. (c) W302 as the donor. In each figure, the distribution of the total RET rate to 4Wc is shown in black. (d) Simulation of energy transfer dynamics for 3Wp to 4Wc based on RET rate distributions. For all 3Wp, a fast energy transfer (τtotal1) and a slow energy transfer (τtotal2) are needed to fit the transients. (e) The 12 possible energy-transfer pathways from 3Wp to 4Wc as calculated with the FRET theory. Each line represents one energy-transfer pathway. Colors of the lines are based on calculated RET time constants. The total RET time constants are shown near each Wp. | |
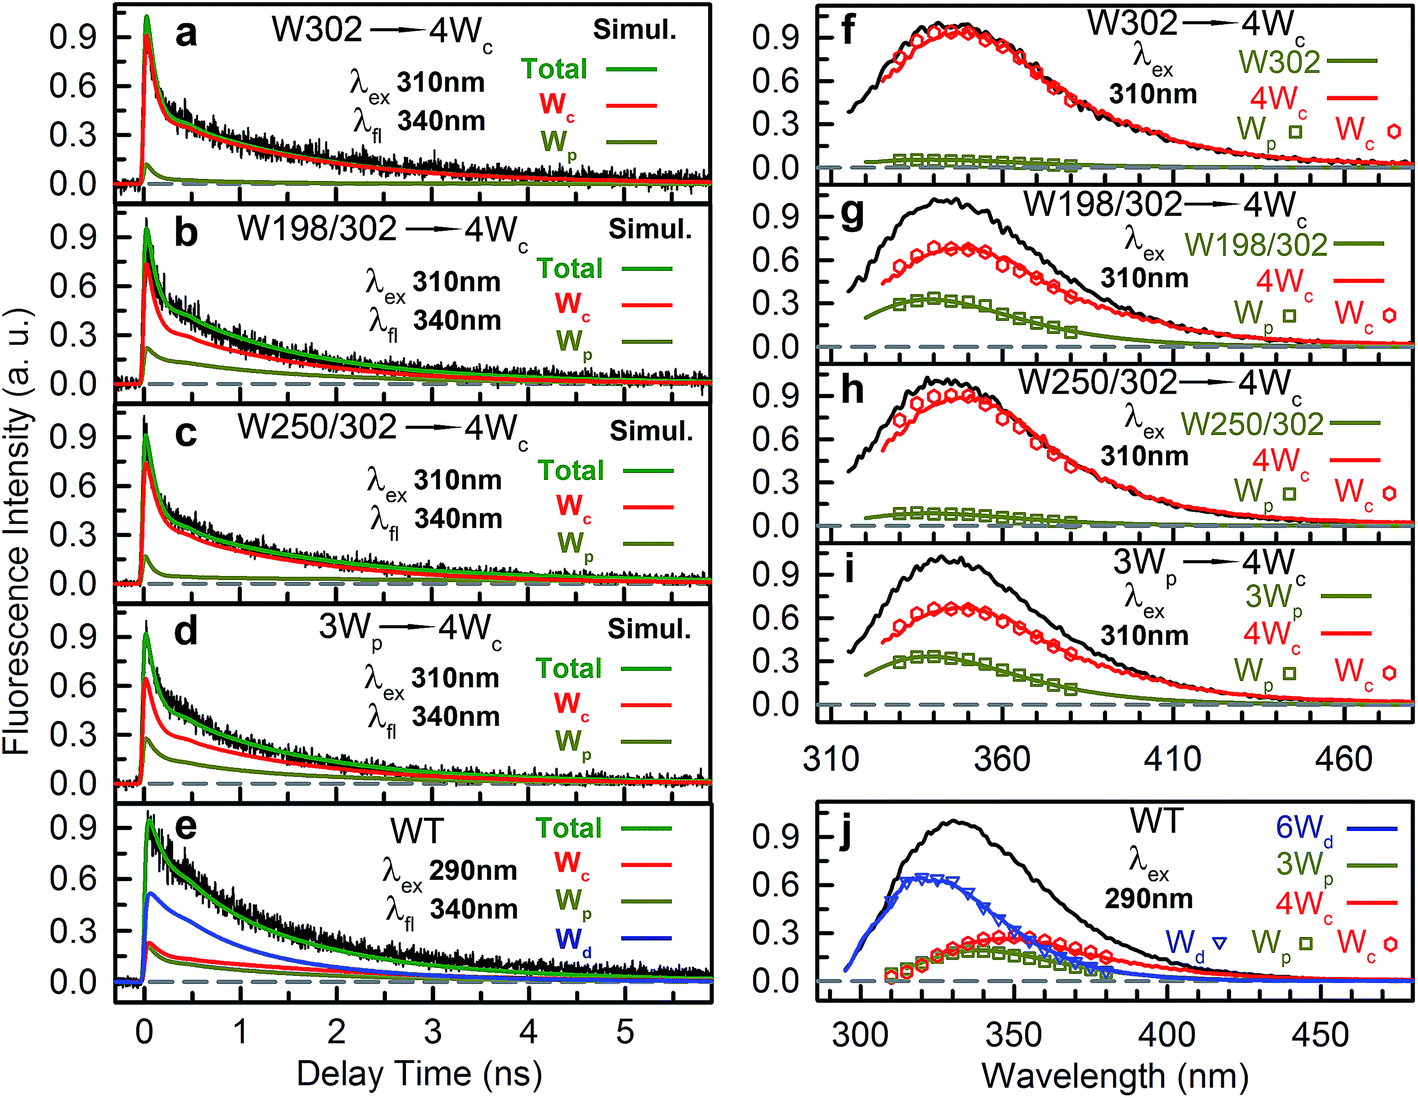
We then experimentally investigated the energy-transfer dynamics from Wp to Wc in various mutants, with ps-resolved TCSPC using 310 nm excitation wavelength to avoid the Wd signal, and then compared the fluorescence decays with theoretical RET model simulations. Since mutation of W302 brings an additional slow decay component to 4Wc that complicates data analysis, W302 was kept in the mutants. Transients measured at various fluorescence wavelengths from 330 nm to 380 nm are shown in Fig. S3–S6† with 340 nm data selected in Fig. 10a–d. Using calculated energy-transfer rate distributions, Wp lifetimes and absorbance values of Wp/Wc, we simulated these 310 nm pump transients, which agree well with experimental data for all different fluorescence wavelengths in all 4 mutants (Fig. 10 and S3–S6†). The total dynamics (green curve) consist of contributions from Wp (dark yellow) and 4Wc (red). Since Wp shows two lifetimes and two RET times, the Wp fluorescence signal is composed of four decay components corresponding to four subpopulations: short lifetime with fast RET (11–14%); long lifetime with fast RET (66–74%, most dominant); short lifetime with slow RET (2–3%, negligible); long lifetime with slow RET (13–16%). For W250/W302, the first two components are close to their τtotal1 in 120/80 ps since they are much faster than lifetimes; the third one is negligible; the last subpopulation decays in about 0.9 ns calculated from the total rate of 6.2/8.2 ns lifetime decay and the 1.0/1.1 ns τtotal2. W198 shows decay components in 0.7 ns (14%), 1.4 ns (66%), 1.1 ns (3%) and 4.3 ns (17%). Signals of 4Wc contain the decays (80 ps and 1.4 ns) of directly excited 4Wc and additional rise/decay components due to RET from Wp. The latter represent RET from the four Wp subpopulations to the two Wc components with complicated rise/decay dynamics, with the most dominant ones from the fast RET to the 80 ps and 1.4 ns 4Wc pools. Because of the slower formation (80–120 ps τtotal1 in W250/W302) and faster decay (for the 80 ps 4Wc component), RET leads to a reverse kinetics of an 80 ps rise with an 80–120 ps decay. On the other hand, fast RET results in substantial accumulation of the 1.4 ns component in 80–120 ps, followed by 1.4 ns decay. The slow RET of W198 only brings negligible accumulation of the fast 80 ps component. By adding all these dynamics, RET causes a rise in 80–120 ps and additional decays in 1.4 ns, making the overall 4Wc fluorescence dynamics apparently slower than 4Wc alone. Fluorescence signals cannot be simulated well using single RET rates calculated for the X-ray structure, especially at long delay times, due to missing of the slow RET of τtotal2. These results suggest that energy-transfer rate distributions from Wp to Wc shown in Fig. 9 are accurate. We obtained RET efficiency of 63%, 94% and 96% for W198, W250 and W302 to 4Wc, respectively, with an average value of 84%.
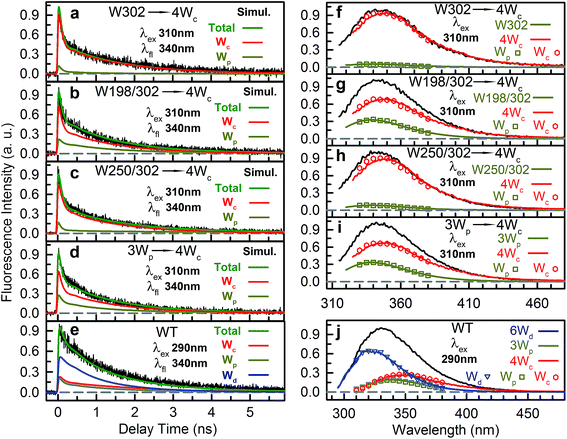 |
| | Fig. 10 Model simulations of fluorescence transients. (a–e) Simulations of typical fluorescence transients at 340 nm for mutants 6Wd + W302 + 4Wc (a), 6Wd + W198/302 + 4Wc (b), 6Wd + W250/302 + 4Wc (c), 6Wd + 3Wp + 4Wc (d) and WT (e). In each figure, the black solid line is the experimental data and the green solid line is the total simulation curve, which is the sum of contributions of W groups. (f–j) Comparison between directly measured and simulation-constructed spectra for 6Wd + W302 + 4Wc (f), 6Wd + W198/302 + 4Wc (g), 6Wd + W250/302 + 4Wc (h), 6Wd + 3Wp + 4Wc (i) and WT (j). In each panel, the black curve is the total emission. The colored symbols represent the spectra of three W groups decomposed from the total emission based on the time integrals of simulation curves. Solid color curves are the directly measured emission spectra of the three W groups. | |
Using all the RET rates, including those from Wd, we simulated the fluorescence decay dynamics in WT at 290 nm excitation with all three Trp groups (Fig. 10e and S7†). 6Wd approximately follows a single-exponential decay in 1.2 ns as discussed above. Besides the four-component decays of the initially excited Wp, due to Wd-to-Wp RET, Wp contains additional dynamics of formation and decay. The 4Wc signal is highly complicated, with directly excited 4Wc, RET from Wp, direct RET from Wd and two-step transfer from Wdvia Wp. Experimental data are consistent with simulation lines, validating our RET mechanism. We then integrated decay curves of different Trp groups and thus decomposed steady-state emission spectra to contributions of individual groups (Fig. 10f–j symbols). These spectra agree well with directly measured fluorescence spectra (Fig. 10f–j solid curves) in WT and all mutants, further confirming our model simulations.
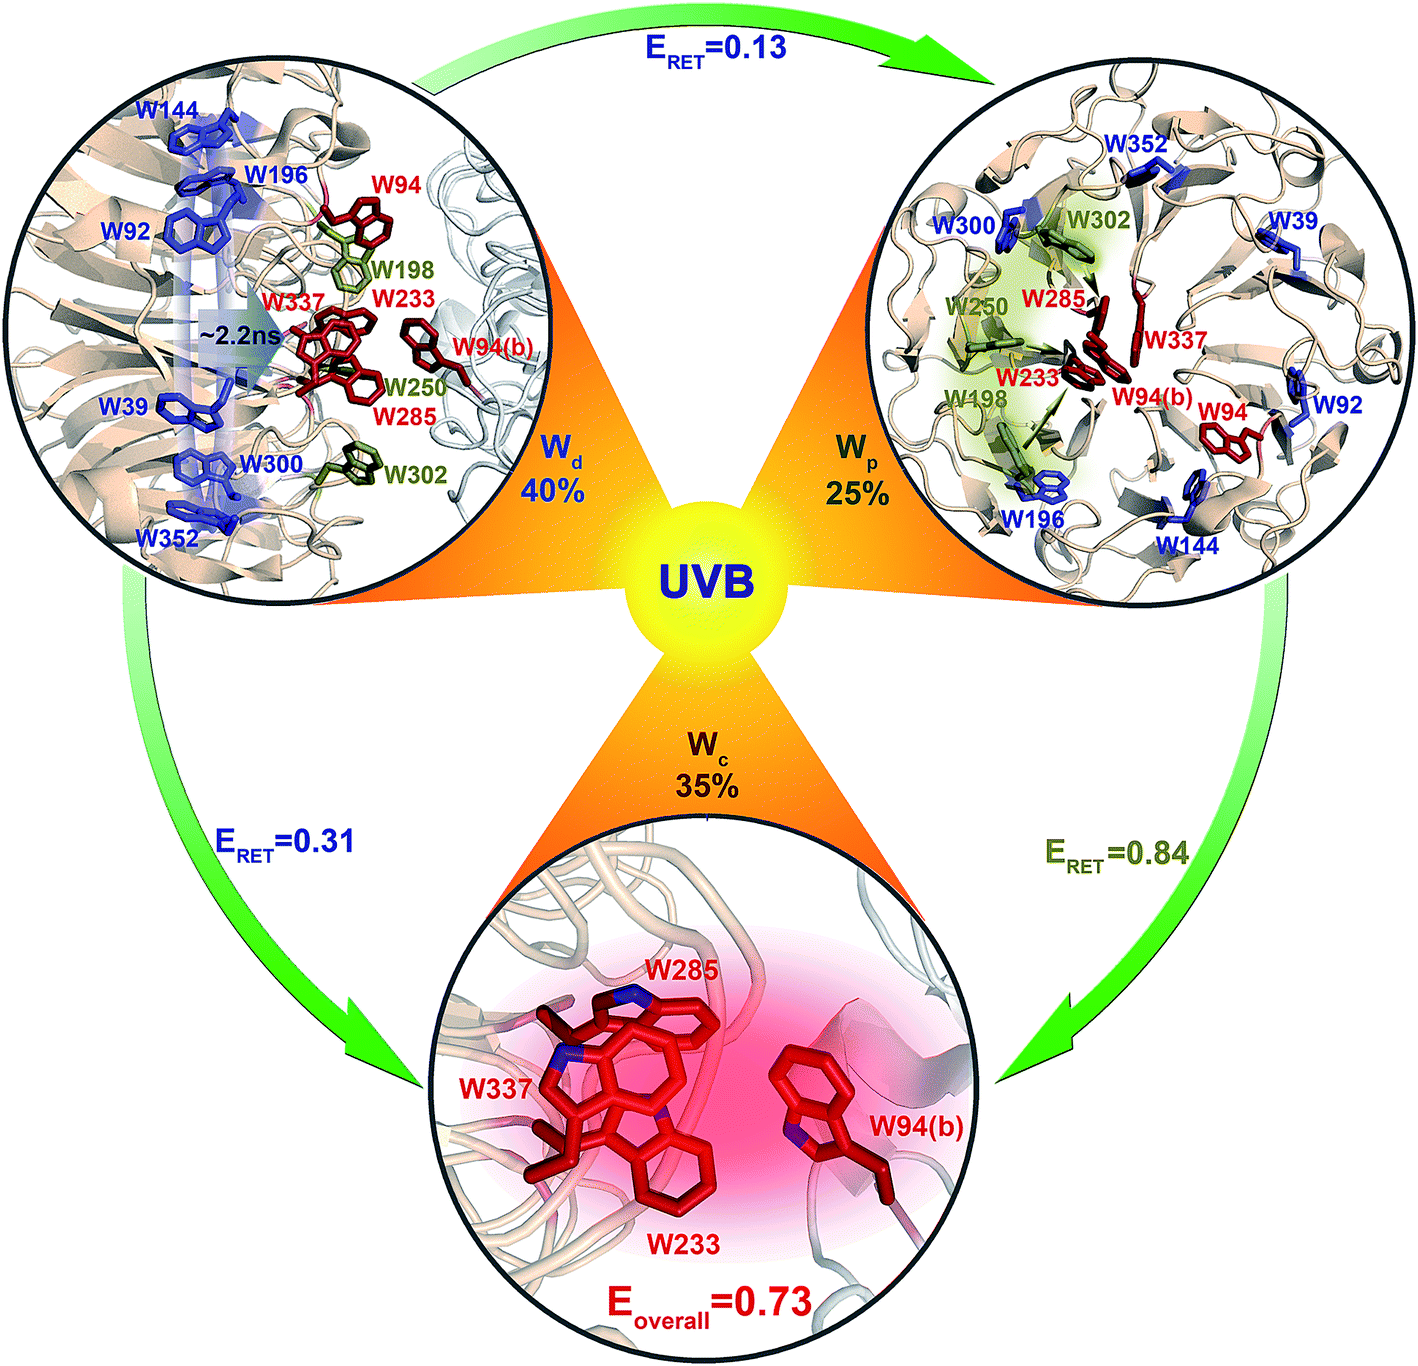
Using all the RET time scales, we finally obtained the overall light sensing efficiency of UVR8. From spectra in Fig. 1e, the absorbance of Wd, Wp and Wc is 0.67, 0.85 and 0.89, respectively, at 290 nm. Using these values, for every 100 UV-B photons absorbed, 40 go to 6Wd, 25 reach 3Wp and 35 excite 4Wc (Fig. 11). 6Wd transfers 31% and 13% of excitation energy to 4Wc and 3Wp, respectively, donating 12.4 (40 × 0.31) photons to Wc and 5.2 (40 × 0.13) photons to Wp. 3Wp shows 84% RET efficiency, funneling additional 25.4 photons ((25 + 5.2) × 0.84) to the cluster. With this delicate light-harvesting network, 4Wc finally perceives 73% (0.35 + 0.124 + 0.254) of the total number photons captured by the protein, more than double the 35% initial direct excitation.
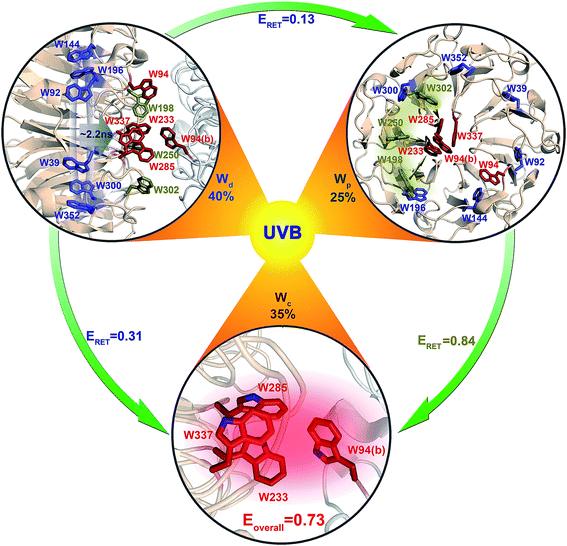 |
| | Fig. 11 A scheme of excitation energy-transfer networks in UVR8. Arrows show excitation-energy flow from the distal ring to the interfacial peripheral outliers and pyramid centers, and from the peripheral outlier to the pyramid center. The corresponding values are the branching fractions for their energy-transfer pathways. | |
Conclusion
Based on our previous brief report and summary,28,40 in this work, we described our detailed studies of the mechanism of light sensing by the UV-B photoreceptor Arabidopsis thaliana UVR8 and reported a striking light-harvesting network that involves all 26 structural tryptophan chromophores in the UVR8 dimer. With site-directed mutagenesis, we found that these Trp residues may be partitioned into three distinctive groups that exhibit significant difference in absorption spectra longer than 300 nm. The distal group of Wd of 6 Trp residues in the interior of UVR8 shows negligible absorbance beyond 310 nm; the absorption spectrum of the three peripheral residues Wp extends to 314 nm; and the absorption red-side tail of a pyramid cluster of four Trp residues, Wc, reaches beyond 320 nm. These differences allow selective excitation of Wd, Wp or Wc, revealing distinct emission spectra with peaks at 320 nm, 340 nm and 350 nm, respectively. This hierarchical arrangement, modulated by local environments, clearly separates the three groups into a ladder of energy landscapes, and allows RET from the highest energy, distal Wd to interfacial Wp/Wc and from Wp to the central, the lowest energy Wc cluster with negligible back energy transfer. The net result is to funnel all excitation energy to the pyramid center (4Wc).
For 6Wd RET to interfacial Wp/Wc, each Wd donor transfers energy to all 14 tryptophan residues on both subunits at the interface, resulting in a complicated network of 84 RET pathways. As investigated with 3 different time-resolved fluorescence methods and QM/MM calculations, these energy-transfer processes are on ns time scales and exhibit distributions of rates, instead of a single rate constant, due to protein structural fluctuations. 6Wd have an overall RET efficiency of 44%, with 31% to 4Wc and 13% to 3Wp.
From time-resolved fluorescence and model simulations, the energy transfer from 3Wp to 4Wc also shows broad rate distributions, on tens of ps to ns time scales. Each Wp effectively contains a major population with dominant fast RET and a small fraction (10–15%) with slow RET, owing to structural flexibility in interfacial loop regions. W198, W250 and W302 have RET efficiency of 63%, 94% and 96%, respectively, with an overall efficiency of 85% for 3Wp.
All the experimental energy-transfer rates perfectly agree with the QM/MM theoretical predictions, indicating that the light harvesting follows the classical excitation energy-transfer mechanism without any coherent energy-transfer character in such long transfer distances. Using the 26 structural tryptophans with a beautiful architecture, the delicate light harvesting network makes the tryptophan pyramid “reaction center” achieve a quantum leap in efficiency of light sensing from 35% by direct exciton absorption to 73% through light harvesting. UVR8 is the only known photoreceptor that has a light-harvesting network, uniquely without the aid of external chromophores. Since UV-B only accounts for a minor portion of solar irradiation on the surface of the earth41 and the extinction coefficient of tryptophan is relatively low, the light harvesting in UVR8 is critical to the sensitive detection of lower intensity in UV-B light for initial signaling to biological functions.
Experiments and methods
Protein sample preparation
The purification of Arabidopsis UVR8 has been reported before.12 Plasmids for mutant expression were constructed using MiniPrep kits (Qiagen) following the manufacturer's protocol. For all experiments, protein samples were kept in the following buffer condition: 150 mM NaCl, 25 mM Tris and pH = 8.0. The dimer/monomer state was determined with a 25 mL Superdex 200 size column (GE) and an AKTA FPLC system (GE). In all proteins, the distal unstructured W400 was mutated to phenylamine and we defined W400F as “the wild type (WT)” throughout this paper.
Steady-state absorption and emission spectra
All absorption spectra were measured using a Cary 50 UV-Vis spectrophotometer (Agilent). The OD at the absorption peak was adjusted to around 1.0 in 5 mm cuvettes for every sample. Absorption spectra were re-normalized to tryptophan numbers and then subtraction was conducted to obtain clean spectra of 3 tryptophan groups. The emission spectra were measured using a Fluoromax-3 spectrofluorometer (Horiba) at 2 μM (290 nm excitation) or 10 μM (310 nm and 315 nm excitation) protein concentrations. For fluorescence quantum yield (QY), fluorescence spectra of proteins at a series of concentrations were measured and integrated, and the integrals were then plotted versus absorbance at 290 nm or 310 nm excitation wavelengths. Tryptophan and phenanthrene standards were dissolved in water and absolute ethanol, respectively.42,43 For phenanthrene, the solution was purged with argon gas until no further increase in fluorescence was observed.43 For each sample, 3 independent measurements were conducted, and the error bars were determined using the standard deviation of the 3 measurements.
Femtosecond-resolved fluorescence up-conversion method
The experimental layout has been detailed elsewhere.44 Briefly, the 290 nm excitation beam was generated by OPA-800 (1 kHz, Spectra-Physics), and its pulse energy was attenuated to ∼100 nJ. The instrument response time under the current noncollinear geometry is about 400 fs, and all data were taken at a magic angle (54.7°). The samples (150 μM) were kept in spinning quartz cells during irradiation to avoid heating and photobleaching. Although this method provides femtosecond (fs) time resolution, the maximum window of measurement is limited by optical delay to 3 ns and a large amount (6–10 mg) of protein sample is required.
Picosecond-resolved time correlated single photon counting (TCSPC)
Fluorescence data were acquired using a commercially available FluoTime 200 system (Picoquant). For the excitation light, a tunable Tsunami laser (80 MHz, Spectra-Physics) was used to generate 100 fs laser pulses at 945 nm, 930 nm and 870 nm wavelengths, followed by third harmonic generation using a tripler (Minioptic) to produce 315 nm, 310 nm and 290 nm excitation pulses (100 fs, 80 MHz, 0.5 μW). The full width at half maximum (FWHF) of the instrument response function (IRF) was 30 ps. All samples (10 μM) were kept in 5 mm quartz cuvettes during measurements. No dissociation was observed after the experiments, as confirmed using the size column. This TCSPC method provides 15 ps time resolution with an exceptional signal-to-noise ratio and negligible sample damage by the weak excitation light. Time window is limited to 12 ns due to the 80 MHz repetition rate of the Tsunami laser. This method only needs a small amount (0.3 mg) of protein samples. The picosecond resolution is enough to investigate the RET dynamics among the three Trp groups. There might be ultrafast processes in UVR8, including the ultrafast energy delocalization in the pyramid center, and such dynamics is beyond the light harvesting reported here.
Sub-nanosecond-resolved time correlated single photon counting (TCSPC)
Fluorescence decay transients were acquired using a commercially available FluoTime 200 system (Picoquant) with PLS-290 pulsed LED (8 MHz, 290 nm, 1 μW, Picoquant) as the excitation source. The FWHM of the IRF was 600–700 ps. All samples (10 μM) were kept in 5 mm quartz cuvettes for measurements. For WT and 6Wd + 4Wc samples, little dissociation was observed after the experiments, as confirmed using a size column. This method provides a large time window up to hundreds of ns, covering the whole fluorescence decay process. But the time resolution is limited to 300 ps and excitation wavelength cannot be adjusted.
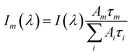
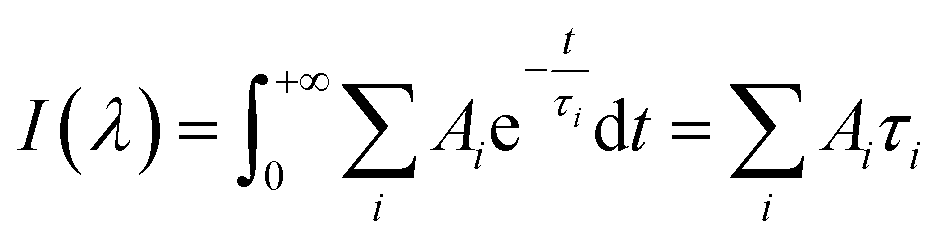
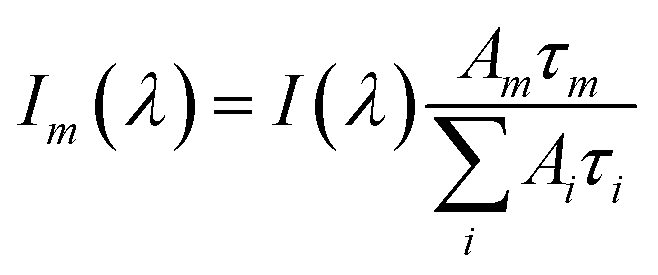
Data fitting and construction of lifetime associated spectra
All TCSPC data were fitted with convoluted multiple-exponential decay models using FluoFit software (Picoquant) and thus the fitting parameters (exponential decay times and their amplitudes) were obtained. Since the steady-state fluorescence spectrum is simply time integrals of exponential decays (eqn (1)), the spectrum of the mth exponential component was given by eqn (2):| | 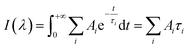 | (1) |
| |  | (2) |
Ai and τi are the amplitude and time constant of the ith exponential component from the transient probed at wavelength λ. I(λ) is the intensity of the steady-state emission.
MD simulations
The X-ray structure of the UVR8 wild type (PDB entry: 4D9S) was solvated using TIP3P water in a cubic box of 104 × 104 × 104 Å3. Counter ions were added to neutralize charge and produce an ion concentration of approximately 0.15 M. The simulation was set up using CHARMM c38a2,45 using the CHARMM27 force field46 with CMAP correction.47 After energy minimization, the system was gradually heated from 10 K to 300 K every 10 K using 100 ps NPT simulations at each temperature. The simulation was first carried out using CHARMM during initial 20 ns equilibration. Then a long-time simulation up to 2 μs was performed using GROMACS-4.6.5 molecular dynamics code48 at 300 K and 1 atm pressure with a 2 fs time step. The non-pair list was updated every 10 steps. The grid neighbor searching method was applied in the simulation with a 10 Å cutoff distance for the short-range neighbor list. Electrostatic interactions were treated by using the Partical–Mesh Ewald (PME) summation method49 with a 14 Å for long range and 10 Å for short-range electrostatic cutoff, respectively. The short-range cutoff for van der Waals interactions during the simulation was 12 Å. The isotropic pressure coupling was achieved by the Parrinello–Rahman method50 with a compressibility of 4.5 × 10⁻⁵ bar−1.
QM/MM calculations
We extracted 500 snapshots (one snapshot in every 4 ns) from the 2 μs simulation for further QM/MM calculations using multistate density functional theory (MSDFT), which has been implemented in a locally modified version of GAMESS51 and CHARMM hybrid. In MSDF calculations, the electron singlet excited state can be written as52| | 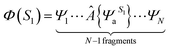 | (3) |
where  specifies an antisymmetric wave function for the locally excited residue a, which is electrostatically embedded in the rest of the system through a Hartree potential. In the present study, the excited state is represented by using time-dependent density functional theory (TDDFT). The remaining N − 1 fragments (amino acid residues, ions and water molecules) are approximated by using the CHARM force field and TIP3P model for water. For every snapshot, the transition dipole moment was calculated for all 13 tryptophan chromophores using the time-dependent range-separated hybrid functional TD-CAM-B3LYP along with the 6-31+G(d) basis set. A total number of 6500 (13 Trp × 500 snapshots) of QM/MM calculations were conducted.
Energy-transfer rate calculations with Förster resonance energy transfer (FRET) theory
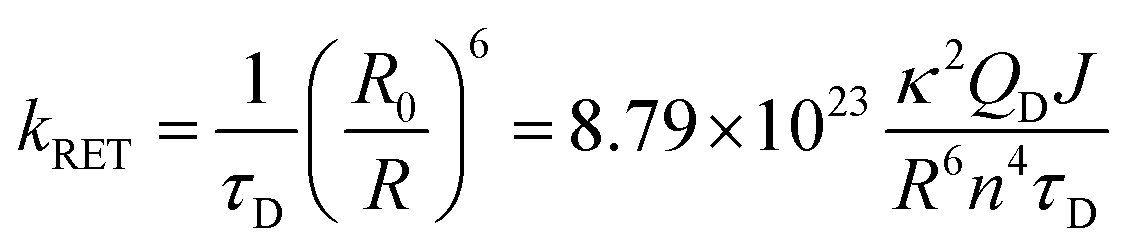
According to Förster theory,37,38 the energy-transfer rate kRET (in ns−1) is given below:| |  | (4) |
where R (in Å) is the center-to-center distance between the donor and acceptor in the 500 MD snapshots. κ2 is the orientation factor defined by| | | κ2 = (μA · μD − 3(μA · R)(μD · R))2 | (5) |
where μA and μD are the normalized transition dipole moments of the acceptor and the donor, respectively, determined from QM/MM calculations. R is the normalized vector connecting centers of donor and acceptor tryptophan residues in each structure. n is the refractive index within protein and was set to 1.33 based on the literature.39QD is the fluorescence quantum yield of the donor without acceptors as determined by experiments. The overlap integral J (in cm3 M−1) was obtained using the following equation:| | 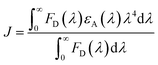 | (6) |
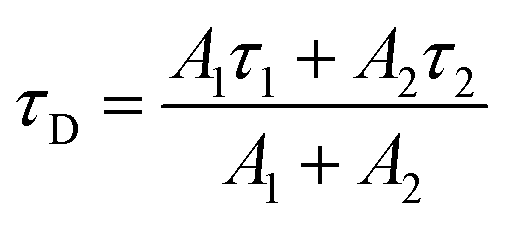
where FD is the emission spectrum of the donor (Wd or Wp). εA is the extinction coefficient of the acceptor (in M−1 cm−1), which is obtained by normalizing the peak extinction coefficient to 5600 M−1 cm−1.53 The unit of wavelength λ was converted to centimeter to give J values in cm3 M−1. τD in eqn (4) is the donor lifetime in nanoseconds. Since tryptophan has two lifetimes, the amplitude weighted average lifetime was used here:| | 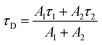 | (7) |
In eqn (7), τ1 and τ2 are the two lifetimes. A1 and A2 are the corresponding amplitudes, respectively.
Finally, by plugging in all values to eqn (4), we obtained RET rates kRET (in ns−1) for all donor–acceptor pairs. Rate distributions were generated using calculated κ2 from the 500 MD snapshots. The corresponding RET time scale τRET (in ns) is simply the reciprocal of kRET.
Total RET rates and simulation of decay dynamics of the original 2.7 ns component
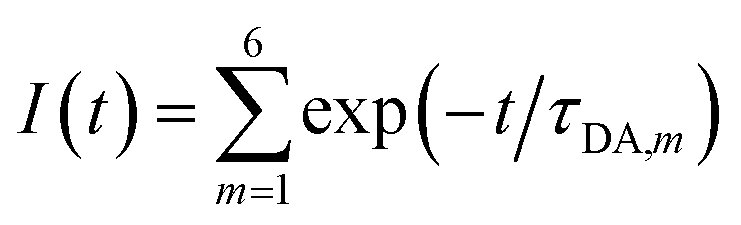
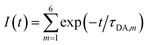
Every Wd transfers energy to all interfacial tryptophan residues on both UVR8 subunits. The total rate of parallel reactions is:| |  | (8) |
kRET,mi is the calculated effective RET rates from the mth Wd to the ith Wp/Wc. N is the number of interfacial tryptophan residues in the protein. The corresponding time constant is the reciprocal of ktotal. Briefly, the RET rate was obtained for each Wp. The 2.7 ns lifetime of the mth Wd in the presence of acceptors will decrease to τDA,m:| | | τDA,m = 1/(1/2.7 + ktotal,m) | (9) |
By summing up the decay dynamics of all the 6Wd, we obtained the total fluorescence dynamics:
| |  | (10) |
Numerical simulations of picosecond-resolved TCSPC transients and spectrum decomposition
The details are shown in the supplemental methods. Briefly, we applied a series of differential equations to simulate temporal evolution of excited state populations of various tryptophan residues and groups, using the energy-transfer model shown in this work. Signal contributions from three tryptophan groups were numerically simulated and added together to give the total simulation curve for comparison with ps-resolved TCSPC data. From time integrations of simulated time-resolved fluorescence curves of 3 tryptophan groups, the total steady-state emission spectra were decomposed to give emission spectra of 3 tryptophan groups.
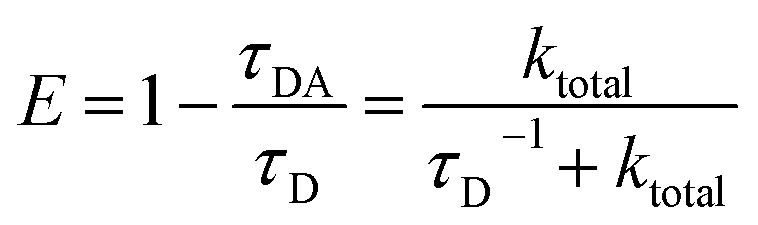
RET efficiency calculations
RET efficiency can be defined with donor fluorescence lifetimes as follows.37,38| | 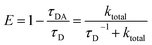 | (11) |
τDA and τD are donor fluorescence lifetimes with and without the acceptors, respectively. τD was directly measured; τDA was calculated with τD and total energy transfer rates ktotal (sum of ktotal and the reciprocal of τD). For tryptophan chromophores, we treated two lifetimes as two different subpopulations and used the population weighted average efficiency:| | | E = R1E1 + R2E2 = (1 − R2)E1 + R2E2 | (12) |
R1 and R2 are the amplitude ratios of the two tryptophan lifetimes; E1 and E2 are the RET efficiencies of the two lifetime components as calculated using eqn (11). The overall light-harvesting efficiency of UVR8 was calculated based on RET efficiency of each Wd or Wp and absorbance values of the three Trp groups, as detailed in the ESI methods.
Author contributions
D. Z. designed the project; J. G. designed the computational studies; X. L., Z. L., M. K. and L. W. conducted the experiments; H. R. conducted MD simulations and QM/MM calculations. X. L., J. G. and D. Z. wrote the paper.
Conflicts of interest
The authors declare no conflict of interest.
Acknowledgements
We thank Prof. Yigong Shi (Tsinghua University) for generously providing the UVR8 plasmid, Prof. Maria-Elisabeth Michel-Beyerle (Nanyang Technological University) for stimulating discussions. This work was supported in part by the National Institute of Health (Grant GM118332 to DZ for experiments and GM46736 to JG for computation) and the National Natural Science Foundation of China (for support of collaboration effort of a visit of XL and DZ to Shanghai Jiao Tong University and Grant No. 21533003 to JG for support of HR to complete computational work).
Notes and references
- S. Ganapathy, G. T. Oostergetel, P. K. Wawrzyniak, M. Reus, A. G. M. Chew, F. Buda, E. J. Boekema, D. A. Bryant, A. R. Holzwarth and H. J. M. de Groot, Alternating Syn-anti Bacteriochlorophylls Form Concentric Helical Nanotubes in Chlorosomes, Proc. Natl. Acad. Sci. U. S. A., 2019, 106, 8525–8530 CrossRef.
- J. Zhang, J. Ma, D. Liu, S. Qin, S. Sun, J. Zhao and S. Sui, Structure of Phycobilisome from the Red Alga Griffithsia Pacifica, Nature, 2017, 551, 57–63 CrossRef.
- E. Thyrhaug, R. Tempelaar, M. J. P. Alcocer, K. Žídek, D. Bína, J. Knoester, T. L. C. Jansen and D. Zigmantas, Identification and Characterization of Diverse Coherences in the Fenna-Matthews-Olson complex, Nat. Chem., 2018, 10, 780–786 CrossRef CAS.
- X. Qin, M. Suga, T. Kuang and J. Shen, Structural Basis for Energy Transfer Pathways in the Plant PSI-LHCI Supercomplex, Science, 2015, 348, 989–995 CrossRef CAS.
- X. Wei, X. Su, P. Cao, X. Liu, W. Chang, M. Li, X. Zhang and Z. Liu, Structure of Spinach Photosystem II-LHCII Supercomplex at 3.2 Å Resolution, Nature, 2016, 534, 69–74 CrossRef CAS.
- A. Möglich, X. Yang, R. A. Ayers and K. Moffat, Structure and Function of Plant Photoreceptors, Annu. Rev. Plant Biol., 2010, 61, 21–47 CrossRef.
- N. C. Rockwell, Y. Su and J. C. Lagarias, Phytochrome Structure and Signaling Mechanisms, Annu. Rev. Plant Biol., 2006, 57, 837–858 CrossRef CAS.
- J. L. Spudich, C. Yang, K. Jung and E. N. Spudich, Retinylidene Proteins: Structures and Functions from Archaea to Humans, Annu. Rev. Cell Dev. Biol., 2000, 16, 365–392 CrossRef CAS.
- Q. Wang, Z. Zuo, X. Wang, L. Gu, T. Yoshizumi, Z. Yang, L. Yang, Q. Liu, W. Liu, Y.-J. Han, J.-I. Kim, B. Liu, J. A. Wohlschlegel, M. Matsui, Y. Oka and C. Lin, Photoactivation and Inactivation of Arabidopsis Cryptochrome 2, Science, 2016, 354, 343–347 CrossRef CAS.
- L. Rizzini, J. J. Favory, C. Cloix, D. Faggionato, A. O'Hara, E. Kaiserli, R. Baumeister, E. Schafer, F. Nagy, G. I. Jenkins and R. Ulm, Perception of UV-B by the Arabidopsis UVR8 Protein, Science, 2011, 332, 103–106 CrossRef CAS.
- J. M. Christie, A. S. Arvai, K. J. Baxter, M. Heilmann, A. J. Pratt, A. O'Hara, S. M. Kelly, M. Hothorn, B. O. Smith, K. Hitomi, G. I. Jenkins and E. D. Getzoff, Plant UVR8 Photoreceptor Senses UV-B by Tryptophan-Mediated Disruption of Cross-Dimer Salt Bridges, Science, 2012, 335, 1492–1496 CrossRef CAS.
- D. Wu, Q. Hu, Z. Yan, W. Chen, C. Yan, X. Huang, J. Zhang, P. Yang, H. Deng, J. Wang, X. W. Deng and Y. Shi, Structural Basis of Ultraviolet-B Perception by UVR8, Nature, 2012, 484, 214–219 CrossRef.
- D. J. Kliebenstein, J. E. Lim, L. G. Landry and R. L. Last, Arabidopsis UVR8 Regulates Ultraviolet-B Signal Transduction and Tolerance and Contains Sequence Similarity to Human Regulator of Chromatin Condensation 1, Plant Physiol., 2002, 130, 234 CrossRef CAS.
- B. A. Brown, C. Cloix, G. H. Jiang, E. Kaiserli, P. Herzyk, D. J. Kliebenstein and G. I. Jenkins, A UV-B-Specific Signaling Component Orchestrates Plant UV Protection, Proc. Natl. Acad. Sci. U. S. A., 2005, 102, 18225–18230 CrossRef CAS.
- J. J. Favory, A. Stec, H. Gruber, L. Rizzini, A. Oravecz, M. Funk, A. Albert, C. Cloix, G. I. Jenkins, E. J. Oakeley, H. K. Seidlitz, F. Nagy and R. Ulm, Interaction of COP1 and UVR8 Regulates UV-B-Induced Photomorphogenesis and Stress Acclimation in Arabidopsis, EMBO J., 2009, 28, 591–601 CrossRef CAS.
- G. I. Jenkins, Signal Transduction in Responses to UV-B Radiation, Annu. Rev. Plant Biol., 2009, 60, 407–431 CrossRef CAS.
- M. Heijde and R. Ulm, UV-B Photoreceptor-Mediated Signalling in Plants, Trends Plant Sci., 2012, 17, 230–237 CrossRef CAS.
- P. V. Demkura and C. L. Ballaré, UVR8 Mediates UV-B-Induced Arabidopsis Defense Responses Against Botrytis Cinerea by Controlling Sinapate Accumulation, Mol. Plant, 2012, 5, 642–652 CrossRef.
- C. Cloix, E. Kaiserli, M. Heilmann, K. J. Baxter, B. A. Brown, A. O'Hara, B. O. Smith, J. M. Christie and G. I. Jenkins, C-terminal Region of the UV-B Photoreceptor UVR8 Initiates Signaling through Interaction with the COP1 Protein, Proc. Natl. Acad. Sci. U. S. A., 2012, 109, 16366–16370 CrossRef CAS.
- L. O. Morales, M. Brosché, J. Vainonen, G. I. Jenkins, J. J. Wargent, N. Sipari, Å. Strid, A. V. Lindfors, R. Tegelberg and P. J. Aphalo, Multiple Roles for UV RESISTANCE LOCUS8 in Regulating Gene Expression and Metabolite Accumulation in Arabidopsis under Solar Ultraviolet Radiation, Plant Physiol., 2013, 161, 744–759 CrossRef CAS.
- X. Huang, X. Ouyang, P. Yang, O. S. Lau, L. Chen, N. Wei and X. W. Deng, Conversion from CUL4-Based COP1-SPA E3 Apparatus to UVR8-COP1-SPA Complexes Underlies a Distinct Biochemical Function of COP1 under UV-B, Proc. Natl. Acad. Sci. U. S. A., 2013, 110, 16669–16674 CrossRef CAS.
- M. Heijde, M. Binkert, R. Yin, F. Ares-Orpel, L. Rizzini, E. Van De Slijke, G. Persiau, J. Nolf, K. Gevaert, G. De Jaeger and R. Ulm, Constitutively Active UVR8 Photoreceptor Variant in Arabidopsis, Proc. Natl. Acad. Sci. U. S. A., 2013, 110, 20326–20331 CrossRef CAS.
- D. P. Fraser, S. Hayes and K. A. Franklin, Photoreceptor Crosstalk in Shade Avoidance, Curr. Opin. Plant Biol., 2016, 33, 1–7 CrossRef CAS.
- A. O'Hara and G. I. Jenkins, In vivo Function of Tryptophans in the Arabidopsis UV-B Photoreceptor UVR8, Plant Cell, 2012, 24, 3755–3766 CrossRef.
- X. Zeng, Z. Ren, Q. Wu, J. Fan, P. P. Peng, K. Tang, R. Zhang, K. H. Zhao and X. Yang, Dynamic Crystallography Reveals Early Signalling Events in Ultraviolet Photoreceptor UVR8, Nat. Plants, 2015, 1, 14006 CrossRef CAS.
- M. Wu, Å. Strid and L. A. Eriksson, Photochemical Reaction Mechanism of UV-B-Induced Monomerization of UVR8 Dimers as the First Signaling Event in UV-B-Regulated Gene Expression in Plants, J. Phys. Chem. B, 2014, 118, 951–965 CrossRef CAS.
- X. Li, L. W. Chung, K. Morokuma and G. Li, Theoretical Study on the UVR8 Photoreceptor: Sensing Ultraviolet-B by Tryptophan and Dissociation of Homodimer, J. Chem. Theory Comput., 2014, 10, 3319–3330 CrossRef CAS.
- Z. Liu, X. Li, F. W. Zhong, J. Li, L. Wang, Y. Shi and D. Zhong, Quenching Dynamics of Ultraviolet-Light Perception by UVR8 Photoreceptor, J. Phys. Chem. Lett., 2014, 5, 69–72 CrossRef CAS.
- A. A. Voityuk, R. A. Marcus and M. E. Michel-Beyerle, On the Mechanism of Photoinduced Dimer Dissociation in the Plant UVR8 Photoreceptor, Proc. Natl. Acad. Sci. U. S. A., 2014, 111, 5219–5224 CrossRef CAS.
- Q. Wu, B. Huang, T. A. Niehaus, X. Yang, J. Fan and R. Q. Zhang, The Role of Tryptophans in the UV-B Absorption of a UVR8 Photoreceptor - A Computational Study, Phys. Chem. Chem. Phys., 2015, 17, 10786–10794 RSC.
- M. Heilmann, J. M. Christie, J. T. M. Kennis, G. I. Jenkins and T. Mathes, Photoinduced Transformation of UVR8 Monitored by Vibrational and Fluorescence Spectroscopy, Photochem. Photobiol. Sci., 2015, 14, 252–257 RSC.
- T. Miyamori, Y. Nakasone, K. Hitomi, J. M. Christie, E. D. Getzoff and M. Terazima, Reaction Dynamics of the UV-B Photosensor UVR8, Photochem. Photobiol. Sci., 2015, 14, 995–1004 RSC.
- E. A. Burstein and V. I. Emelyanenko, Log-Normal Description of Fluorescence Spectra of Organic Fluorophores, Photochem. Photobiol., 1996, 64, 316–320 CrossRef CAS.
- A. Grinvald, J. Schlessinger, I. Pecht and I. Z. Steinberg, Homogeneity and Variability in the Structure of Azurin Molecules Studied by Fluorescence Decay and Circular Polarization, Biochemistry, 1975, 14, 1921–1929 CrossRef CAS.
- A. L. Sobolewski and W. Domcke, Ab Initio Investigations on the Photophysics of Indole, Chem. Phys. Lett., 1999, 315, 293–298 CrossRef CAS.
-
L. O. Björn, Photobiology: The Science of Light and Life, Springer, New York, 3rd edn, 2015 Search PubMed.
-
D. L. Andrews and A. A. Demidov, Resonance Energy Transfer, Wiley, New York, 1999 Search PubMed.
- J. A. Stevens, J. J. Link, C. Zang, L. Wang and D. Zhong, Ultrafast Dynamics of Nonequilibrium Resonance Energy Transfer and Probing Globular Protein Flexibility of Myoglobin, J. Phys. Chem. A, 2012, 116, 2610–2619 CrossRef CAS.
- R. S. Moog, A. Kuki, M. D. Fayer and S. G. Boxer, Excitation Transport and Trapping in a Synthetic Chlorophyllide Substituted Hemoglobin: Orientation of the Chlorophyll S1 Transition Dipole, Biochemistry, 1984, 23, 1564–1571 CrossRef CAS.
- X. Li, H. Ren, M. Kundu, Z. Liu, F. W. Zhong, L. Wang, J. Gao and D. Zhong, A Leap in Quantum Efficiency through Light Harvesting in Photoreceptor UVR8, Nat. Commun., 2020, 11, 4316 CrossRef CAS.
- R. L. McKenzie, P. J. Aucamp, A. F. Bais, L. O. Björn and M. Ilyas, Changes in Biologically-Active Ultraviolet Radiation Reaching the Earth's Surface, Photochem. Photobiol. Sci., 2007, 6, 218–231 RSC.
- R. F. Chen, Fluorescence Quantum Yields of Tryptophan and Tyrosine, Anal. Lett., 1967, 1, 35–42 CrossRef CAS.
- W. R. Dawson and M. W. Windsor, Fluorescence Yields of Aromatic Compounds, J. Phys. Chem., 1968, 72, 3251–3260 CAS.
- L. Zhang, Y.-T. Kao, W. Qiu, L. Wang and D. Zhong, Femtosecond Studies of Tryptophan Fluorescence Dynamics in Proteins: Local Solvation and Electronic Quenching, J. Phys. Chem. B, 2006, 110, 18097–18103 CrossRef CAS.
- B. R. Brooks, C. L. Brooks, A. D. MacKerell, L. Nilsson, R. J. Petrella, B. Roux, Y. Won, G. Archontis, C. Bartels, S. Boresch, A. Caflisch, L. Caves, Q. Cui, A. R. Dinner, M. Feig, S. Fischer, J. Gao, M. Hodoscek, W. Im, K. Kuczera, T. Lazaridis, J. Ma, V. Ovchinnikov, E. Paci, R. W. Pastor, C. B. Post, J. Z. Pu, M. Schaefer, B. Tidor, R. M. Venable, H. L. Woodcock, X. Wu, W. Yang, D. M. York and M. Karplus, CHARMM: The Biomolecular Simulation Program, J. Comput. Chem., 2009, 30, 1545–1614 CrossRef CAS.
- A. D. MacKerell, N. Banavali and N. Foloppe, Development and Current Status of the CHARMM Force Field for Nucleic Acids, Biopolymers, 2000, 56, 257–265 CrossRef CAS.
- A. D. Mackerell, M. Feig and C. L. Brooks, Extending the Treatment of Backbone Energetics in Protein Force Fields: Limitations of Gas-Phase Quantum Mechanics in Reproducing Protein Conformational Distributions in Molecular Dynamics Simulations, J. Comput. Chem., 2004, 25, 1400–1415 CrossRef CAS.
- B. Hess, C. Kutzner, D. van der Spoel and E. Lindahl, GROMACS 4: Algorithms for Highly Efficient, Load-Balanced, and Scalable Molecular Simulation, J. Chem. Theory Comput., 2008, 4, 435–447 CrossRef CAS.
- D. M. York, T. A. Darden and L. G. Pedersen, The Effect of Long-range Electrostatic Interactions in Simulations of Macromolecular Crystals: A Comparison of the Ewald and Truncated List Methods, J. Chem. Phys., 1993, 99, 8345–8348 CrossRef CAS.
- M. Parrinello and A. Rahman, Crystal Structure and Pair Potentials: A Molecular-Dynamics Study, Phys. Rev. Lett., 1980, 45, 1196–1199 CrossRef CAS.
- M. W. Schmidt, K. K. Baldridge, J. A. Boatz, S. T. Elbert, M. S. Gordon, J. H. Jensen, S. Koseki, N. Matsunaga, K. A. Nguyen, S. Su, T. L. Windus, M. Dupuis and J. A. Montgomery, Jr, General Atomic and Molecular Electronic Structure System, J. Comput. Chem., 1993, 14, 1347–1363 CrossRef CAS.
- W. Chan, T. C. Berkelbach, M. R. Provorse, N. R. Monahan, J. R. Tritsch, M. S. Hybertsen, D. R. Reichman, J. Gao and X.-Y. Zhu, The Quantum Coherent Mechanism for Singlet Fission: Experiment and Theory, Acc. Chem. Res., 2013, 46, 1321–1329 CrossRef CAS.
- S. C. Gill and P. H. von Hippel, Calculation of Protein Extinction Coefficients from Amino Acid Sequence Data, Anal. Biochem., 1989, 182, 319–326 CrossRef CAS.
Footnote |
| † Electronic supplementary information (ESI) available: Methods, Fig. S1–S8, and Tables S1–S14. See DOI: 10.1039/d0sc04909c |
|
| This journal is © The Royal Society of Chemistry 2020 |
Click here to see how this site uses Cookies. View our privacy policy here. 
 Open Access Article
 This Open Access Article is licensed under a Creative Commons Attribution-Non Commercial 3.0 Unported Licence
 cd,
Mainak
Kundu
a,
Lijuan
Wang
a,
Jiali
Gao
cd,
Mainak
Kundu
a,
Lijuan
Wang
a,
Jiali
Gao


 specifies an antisymmetric wave function for the locally excited residue a, which is electrostatically embedded in the rest of the system through a Hartree potential. In the present study, the excited state is represented by using time-dependent density functional theory (TDDFT). The remaining N − 1 fragments (amino acid residues, ions and water molecules) are approximated by using the CHARM force field and TIP3P model for water. For every snapshot, the transition dipole moment was calculated for all 13 tryptophan chromophores using the time-dependent range-separated hybrid functional TD-CAM-B3LYP along with the 6-31+G(d) basis set. A total number of 6500 (13 Trp × 500 snapshots) of QM/MM calculations were conducted.