
 Open Access Article
 This Open Access Article is licensed under a
 Creative Commons Attribution 3.0 Unported Licence
2′-O-Trifluoromethylated RNA – a powerful modification for RNA chemistry and NMR spectroscopy†‡
Maximilian
Himmelstoß
a,
Kevin
Erharter
a,
Eva
Renard
b,
Eric
Ennifar
*b,
Christoph
Kreutz
 *a and
Ronald
Micura
*a
*a and
Ronald
Micura
*a
aUniversity of Innsbruck, Institute of Organic Chemistry, Center for Molecular Biosciences (CMBI), Innrain 80-82, 6020 Innsbruck, Austria. E-mail: ronald.micura@uibk.ac.at; christoph.kreutz@uibk.ac.at
bUniversité de Strasbourg, Architecture et Réactivité de l'ARN–CNRS UPR 9002, Institut de Biologie Moléculaire et Cellulaire, 67000 Strasbourg, France. E-mail: e.ennifar@ibmc-cnrs.unistra.fr
First published on 24th September 2020
Abstract
New RNA modifications are needed to advance our toolbox for targeted manipulation of RNA. In particular, the development of high-performance reporter groups facilitating spectroscopic analysis of RNA structure and dynamics, and of RNA–ligand interactions has attracted considerable interest. To this end, fluorine labeling in conjunction with 19F-NMR spectroscopy has emerged as a powerful strategy. Appropriate probes for RNA previously focused on single fluorine atoms attached to the 5-position of pyrimidine nucleobases or at the ribose 2′-position. To increase NMR sensitivity, trifluoromethyl labeling approaches have been developed, with the ribose 2′-SCF3 modification being the most prominent one. A major drawback of the 2′-SCF3 group, however, is its strong impact on RNA base pairing stability. Interestingly, RNA containing the structurally related 2′-OCF3 modification has not yet been reported. Therefore, we set out to overcome the synthetic challenges toward 2′-OCF3 labeled RNA and to investigate the impact of this modification. We present the syntheses of 2′-OCF3 adenosine and cytidine phosphoramidites and their incorporation into oligoribonucleotides by solid-phase synthesis. Importantly, it turns out that the 2′-OCF3 group has only a slight destabilizing effect when located in double helical regions which is consistent with the preferential C3′-endo conformation of the 2′-OCF3 ribose as reflected in the 3J (H1′–H2′) coupling constants. Furthermore, we demonstrate the exceptionally high sensitivity of the new label in 19F-NMR analysis of RNA structure equilibria and of RNA–small molecule interactions. The study is complemented by a crystal structure at 0.9 Å resolution of a 27 nt hairpin RNA containing a single 2′-OCF3 group that well integrates into the minor groove. The new label carries high potential to outcompete currently applied fluorine labels for nucleic acid NMR spectroscopy because of its significantly advanced performance.
Introduction
The attractiveness of fluorine labeling of biomolecules for 19F-NMR spectroscopic applications originates from its unique properties, namely a 100% natural abundance, high NMR sensitivity, and large chemical shift dispersion.1–9 Moreover, fluorine is bio-orthogonal, meaning that it is hardly encountered in native biomolecular systems.10–15 Appropriate probes for ribonucleic acids have mainly focused on single fluorine atoms attached to the 5-position of pyrimidine nucleobases16–20 or at the ribose 2′-position.21–25 To further increase sensitivity, trifluoromethyl labeling approaches have been sought after,26,27 one of them focuses on ribose 2′-trifluoromethylthio (2′-SCF3) modifications.28–30 A drawback of the 2′-SCF3 group, however, is its strong impact on RNA thermodynamic stability when located in base-paired regions.29 Interestingly, the structurally related 2′-O-trifluoromethyl (2′-OCF3) RNA has not been reported thus far. To the best of our knowledge, only one study is available that describes the thermodynamic stabilities of a short DNA containing a single 2′-OCF3 group that is paired to either a complementary DNA or RNA strand.31 We expected the 2′-OCF3 modification highly beneficial for RNA and 19F-NMR spectroscopic applications to analyze structural dynamics and ligand interactions, and therefore, we set out to overcome the underlying challenges in chemical synthesis. In this work, we present synthetic routes toward 2′-OCF3 nucleoside phosphoramidites and their incorporation into oligoribonucleotides by RNA solid-phase synthesis. Furthermore, we describe the impact of the 2′-OCF3 group on thermodynamic stability of RNA double helices which is only slightly destabilizing when located in double helical regions. This finding is consistent with a preferential C3′-endo conformation of the 2′-OCF3 ribose in short single stranded RNA as shown by measurements and interpretation of H1′–H2′ coupling constants. Moreover, we demonstrate the exceptionally high sensitivity of the new label in 19F-NMR analysis of RNA structure equilibria and of RNA–small molecule interactions. The study is complemented by crystal structures of an RNA hairpin including 2′-OCF3 modifications.Results and discussion
The syntheses of 2′-OCF3 nucleoside phosphoramidites followed the previously described route of a 2′-OCF3 adenosine derivative31 and involved a method by Hiyama et al. who reported that methyl xanthates R-OC(S)SMe are converted into trifluoromethyl ethers R-OCF3 by treatment with pyridinium poly(hydrogen fluoride) (HF/pyridine) in the presence of 1,3-di-bromo-5,5-dimethylhydantoin (DBH).32 A drawback however is the low yield of this transformation.Synthesis of 2′-OCF3 cytidine
For building block C7 (Scheme 1), we started the synthesis from cytidine C1, which was simultaneously protected at the 3′ and 5′ oxygen atoms with the tetraisopropyldisiloxane (TIPDS) group (Scheme 1). Compound C2 was then treated with tert-BuLi, carbon disulfide and methyl iodide in tetrahydrofuran at −78 °C to yield the 2′-O-[(methylthio)-thiocarbonyl]cytidine derivative C3. After acetylation of the exocyclic NH2 group to furnish C4a, the desired 2′-O-trifluoromethyl derivative C5a was obtained in low yields by treatment with pyridinium poly(hydrogen fluoride) (HF/pyridine) in the presence of N-bromosuccinimide (NBS) instead of DBH as mentioned above. Finally, C5a was transformed into the dimethoxytritylated compound C6a, and conversion into the corresponding phosphoramidite C7a was accomplished in good yields by reaction with 2-cyanoethyl N,N-diisopropylchlorophosphoramidite. Starting with cytidine C1, our route provides C7a in 4% overall yield in six steps with six chromatographic purifications; in total, 0.5 g of C7a was obtained in the course of this study. We mention that the yields of trifluoromethylation can be increased by switching from N4-acetyl to N4-benzoyl protection (Scheme 1). The higher stability of the latter (compound 4b) against hydrolysis increased the yields by 50% comparing the transformation of 4a into 5a with 4b into 5b. However, one has to be aware that N4-benzoyl cytidine in synthetic RNA can be transaminated to some extent (<10%) when deprotection reagents containing methylamine are applied.33,34 | ||
| Scheme 1 Synthesis of 2′-OCF3 cytidine building block C7. Reaction conditions: (a) 1.1 equiv. TIPDSCl2, in pyridine, room temperature, 5 h, 86%; (b) 1.2 equiv. tBuLi, 9.0 equiv. CS2, 3.0 equiv. CH3I, in THF, −75 °C to room temperature, 18 h, 77%; (c) 3.0 equiv. acetic anhydride, in pyridine, room temperature, 16 h, 90%; (c′) 1.1 equiv. benzoic anhydride, in DMF, room temperature, 16 h, 90%; (d) 5.0 equiv. NBS, in HF pyridine and CH2Cl2, –75 °C to 0 °C, 3 h, 11% for C5a, 16% for C5b; (e) 1.4 equiv. DMTCl, 0.4 equiv. DMAP, in pyridine, room temperature, 16 h, 76% for C6a, 86% for C6b; (f) 2.5 equiv. 2-cyanoethyl N,N-diisopropylchlorophosphoramidite, 7.5 equiv. iPr2NEt, 0.5 equiv. 1-methylimidazole, in CH2Cl2, room temperature, 2 h, 74% for C7a, 92% for C7b. | ||
Synthesis of 2′-OCF3 adenosine
For building block A7 (Scheme 2), we started the synthesis from adenosine A1, which was simultaneously protected at the 3′ and 5′ oxygen atoms with the TIPDS group (Scheme 2). Compound A2 was treated with tert-BuLi, carbon disulfide and methyl iodide in tetrahydrofuran at −78 °C to yield the 2′-O-[(methylthio)-thiocarbonyl]cytidine derivative A3. After benzoylation of the exocyclic NH2 group to furnish A4, the desired 2′-O-trifluoromethyl derivative A5 was obtained by treatment with HF/pyridine in the presence of NBS. Yields were significantly higher compared to the same transformation on cytidine (C4 into C5). Finally, A5 was transformed into the dimethoxytritylated compound A6, and conversion into the corresponding phosphoramidite A7 was accomplished in good yields by reaction with 2-cyanoethyl N,N-diisopropylchlorophosphoramidite. Starting with adenosine A1, our route provides A7 in 12% overall yield in six steps with six chromatographic purifications; in total, 1.2 g of A7 was obtained in the course of this study. | ||
| Scheme 2 Synthesis of 2′-OCF3 adenosine building block A7. Reaction conditions: (a) 1.1 equiv. TIPDSCl2, in pyridine, room temperature, 5 h, 95%; (b) 1.2 equiv. tBuLi, 9.0 equiv. CS2, 3.0 equiv. CH3I, in THF, −75 °C to room temperature, 18 h, 74%; (c) 2.5 equiv. benzoylchloride, 6 equiv. NH3, in pyridine, room temperature, 16 h, 89%; (d) 5.0 equiv. NBS, in HF pyridine and CH2Cl2, –75 °C to 0 °C, 3 h, 26%; (e) 1.5 equiv. DMTCl, 0.5 equiv. DMAP, in pyridine, room temperature, 16 h, 88%; (f) 2.5 equiv. 2-cyanoethyl N,N-diisopropylchlorophosphoramidite, 7.5 equiv. iPr2NEt, 0.5 equiv. 1-methylimidazole, in CH2Cl2, room temperature, 2 h, 82%. | ||
We mention that in an attempt to increase the yields for the 2′-O trifluoromethylation step, we tested silver-mediated oxidative O-trifluoromethylation of a 3′,5′-O protected adenosine derivative using TMSCF3, following a published protocol,65 but unfortunately failed. Currently, we are planning to elaborate routes for 2′-OCF3 uridine and guanosine building blocks via the here described methyl xanthate intermediates. This should be feasible provided proper protection concepts for N3-H and N1-H, respectively, can be identified.
RNA solid-phase synthesis
The solid-phase synthesis of RNA with site-specific 2′-OCF3 modifications was performed following the 2′-O-[(triisopropylsilyl)oxy]methyl (TOM) approach.35,36 Coupling yields of the novel building blocks were higher than 98% according to the trityl assay. Cleavage of the oligonucleotides from the solid support and their deprotection were performed using methylamine in water/ethanol or methylamine/ammonia in water (AMA), followed by treatment with tetra-n-butylammonium fluoride (TBAF) in tetrahydrofuran. Salts were removed by size-exclusion chromatography, and RNAs were purified by anion-exchange chromatography under denaturating conditions (6 M urea, 80 °C; Fig. 1 and ESI Table 1‡). The molecular weights of the purified RNAs were confirmed by liquid-chromatography (LC) electrospray-ionization (ESI) mass spectrometry (MS). The sequences of 2′-OCF3 containing RNAs synthesized in the course of this study are listed in ESI Table 1.‡ | ||
| Fig. 1 Characterization of 2′-OCF3 modified RNA. Anion-exchange HPLC traces (top) of 6 nt RNA (A), 15 nt RNA (B), and 27 nt RNA (C), and corresponding LC-ESI mass spectra (bottom). HPLC conditions: Dionex DNAPac column (4 × 250 mm), 80 °C, 1 mL min−1, 0–60% buffer B in 45 min; buffer A: Tris–HCl (25 mM), urea (6 M), pH 8.0; buffer B: Tris–HCl (25 mM), urea (6 M), NaClO4 (0.5 M), pH 8.0. For LC-ESI MS conditions, see the ESI.‡ | ||
Thermodynamic stability of 2′-OCF3 modified RNA
A single 2′-OCF3 adenosine exhibited only moderate attenuation of RNA double helix stability if the modification was located in the Watson–Crick base-pairing region (Table 1). For instance, UV melting profile analysis37,38 of the hairpin-forming RNA 5′-GA(2′-OCF3-A)GG-GCAA-CCUUCG (Fig. 2A) revealed a decrease of the Tm value by 3 °C determined at micromolar RNA concentrations (Tm 70.3 °C), compared to the unmodified counterpart (Tm 73.3 °C). We remind that the same RNA but with a 2′-SCF3 modification at the same nucleotide position caused a much stronger drop in the Tm value, namely by 14 °C (Table 1).29 As a second example, the palindromic RNA 5′-GGUCG(2′-OCF3-A)CC (Fig. 2B) also suffered from an average Tm value decrease of 3 °C per 2′-OCF3-A modification (micromolar RNA concentrations), compared to the unmodified counterpart.| Sequence (5′ → 3′) | T m [°C] | ΔG°298 [kcal mol−1] | ΔH° [kcal mol−1] | ΔS° [cal mol−1 K−1] |
|---|---|---|---|---|
a ![[A with combining low line]](https://www.rsc.org/images/entities/char_0041_0332.gif) 2′-OCF3 adenosine, 2′-OCF3 adenosine, ![[C with combining low line]](https://www.rsc.org/images/entities/char_0043_0332.gif) 2′-OCF3 cytidine, 2′-OCF3 cytidine,  2′-SCF3 adenosine,30 2′-SCF3 adenosine,30 2′-SCF3 cytidine.29 Buffer: 10 mM Na2HPO4, 150 mM NaCl, pH 7.0. ΔH and ΔS values were obtained by van't Hoff analysis according to ref. 37 and 38. Errors for ΔH and ΔS, arising from non-infinite cooperativity of two-state transitions and from the assumption of a temperature-independent enthalpy, are typically 10–15%. Additional error is introduced when free energies are extrapolated far from melting transitions; errors for ΔG are typically 3–5%. 2′-SCF3 cytidine.29 Buffer: 10 mM Na2HPO4, 150 mM NaCl, pH 7.0. ΔH and ΔS values were obtained by van't Hoff analysis according to ref. 37 and 38. Errors for ΔH and ΔS, arising from non-infinite cooperativity of two-state transitions and from the assumption of a temperature-independent enthalpy, are typically 10–15%. Additional error is introduced when free energies are extrapolated far from melting transitions; errors for ΔG are typically 3–5%.
|
||||
| GGUCGACC | 59.1 | −14.3 | −72.0 | −193 |
GGUCG![[A with combining low line]](https://www.rsc.org/images/entities/b_char_0041_0332.gif) CC CC |
52.7 | −12.6 | −69.1 | −189 |
| GAAGG-GCAA-CCUUCG | 73.3 | −6.0 | −46.0 | −134 |
| GAGG-GCAA-CCUUCG |
70.3 | −5.8 | −46.7 | −137 |
GA GG-GCAA-CCUUCG30 GG-GCAA-CCUUCG30 |
57.4 | −5.5 | −57.9 | −176 |
GAAGG-GCAA-C![[C with combining low line]](https://www.rsc.org/images/entities/b_char_0043_0332.gif) UUCG UUCG |
66.8 | −4.9 | −41.7 | −124 |
GAAGG-GCAA-C UUCG29 UUCG29 |
53.3 | −4.4 | −50.4 | −154 |
| GAAGG-GCA-CCUUCG |
74.0 | −8.3 | −60.9 | −177 |
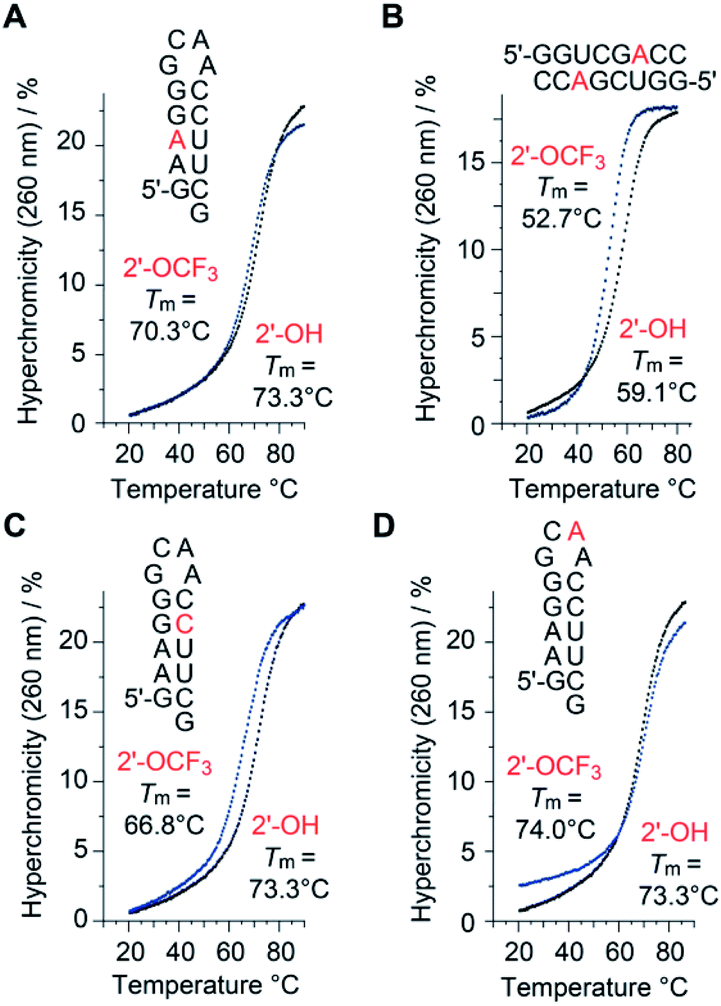 | ||
| Fig. 2 Thermal stabilities of unmodified versus 2′-OCF3 modified oligoribonucleotides. UV-melting profiles of hairpin and self-complementary duplex RNAs with the modification (either at adenosine or cytidine) located in the base-pairing region (A–C), and UV-melting profile of the same hairpin sequence with the modification in the GNRA loop motif (D). Conditions: c(RNA) = 12 μM; 10 mM Na2HPO4, 150 mM NaCl, pH 7.0. Nucleotides in red color indicate the positions for 2′-OCF3 modification. | ||
Next, the same hairpin was analyzed with 2′-OCF3 at cytidine instead of adenosine, 5′-GAAGG-GCAA-C(2′-OCF3-C)UUCG (Fig. 2C). The destabilization was reflected by a 6.5 °C lower Tm value compared to the unmodified hairpin, still significantly less compared to the 2′-SCF3-C modification that caused a Tm reduction by 20 °C of this hairpin (Table 1).29 We point out that the significantly larger destabilization of 2′-SCF3 compared to the 2′-OCF3 modified double helices is of entropic origin (Table 1).
Notably, when the 2′-OCF3 group resides in a single-stranded region, the impact on thermodynamic stability is minor, and in the case of the extra-stable GNRA loop motif even modestly stabilizing, reflected by an increase of the Tm value and a favorable ΔG value for 5′-GAAGG-GC(2′-OCF3-A)A-CCUUCG (Fig. 2D and Table 1). The stabilization is rationalized by the fact that unmodified adenosine in GCA loops preferentially adopts the C3′-endo ribose pucker (70%).39–41 The C3′-endo conformation in this loop becomes locked when the 2′-OCF3 group is attached, as verified by NMR spectroscopic analysis (ESI Fig. 1A‡). The very same hairpin was also used to demonstrate the impressive 19F NMR spectroscopic sensitivity of the 2′-OCF3 label compared to a 2′-F label (ESI Fig. 1B and C‡).
Taken together, our original expectation that the 2′-OCF3 modification compared to 2′-SCF3 is more potent for a broad scope of applications because of being less destabilizing and retaining the high sensitivity, turned out to be correct (Fig. 2, Table 1 and ESI Fig. 1‡).
2′-OCF3 ribose conformation
The inherent preference of a modified nucleoside to adopt either C2′-endo or C3′-endo conformation is crucial for its impact on thermodynamic base pairing stability.42–45 To analyze the ribose conformation of a 2′-OCF3 nucleoside in detail, we synthesized a short, single-stranded RNA, 5′-GGCAG(2′-OCF3-A)GGC, and determined the 3J (H1′–H2′) coupling constant from a 2D 1H,1H double quantum filtered COSY spectrum (DQFCOSY). The coupling constant amounted to 5.9 Hz, which translates into a population of about 60% of C2′-endo ribose conformation in the single strand (Fig. 3A and B; for 1H–13C HSQC spectrum see ESI Fig. 2‡). We then recorded the 1H NMR spectrum of a self-complementary, fully base-paired 8 nt RNA duplex with 2′-OCF3-A modification (Fig. 3C). The 3JH1′–H2′ was clearly smaller than 1 Hz, consistent with the requirement to adopt C3′-endo conformation in an RNA double helix to avoid steric clash. Notably, for the previously investigated 2′-SCF3 adenosine and -cytidine, the 3J (H1′–H2′) coupling constants amount to 9.7 and 10.4 Hz,29,30 respectively, provided they reside in a single-stranded short RNA. This in turn stands for a population of almost 100% of C2′-endo conformation. The strong C2′-endo preference of 2′-SCF3 modified nucleosides likely provides a rationale for the significantly higher thermodynamic destabilization if they are encountered in base paired regions.29,30 Further support for this hypothesis stems from the analysis of 5′-GGCAG(2′-F-A)GGC. For the 2′-F labeled nucleoside, the 3J (H1′–H2′) coupling constant was less than 1 Hz (ESI Fig. 3A‡) which corresponds to a population of almost 100% C3′-endo conformation in the single strand. This ‘pre-folding’ is a rationale for the slight stabilization when 2′-F becomes located in a double helix.25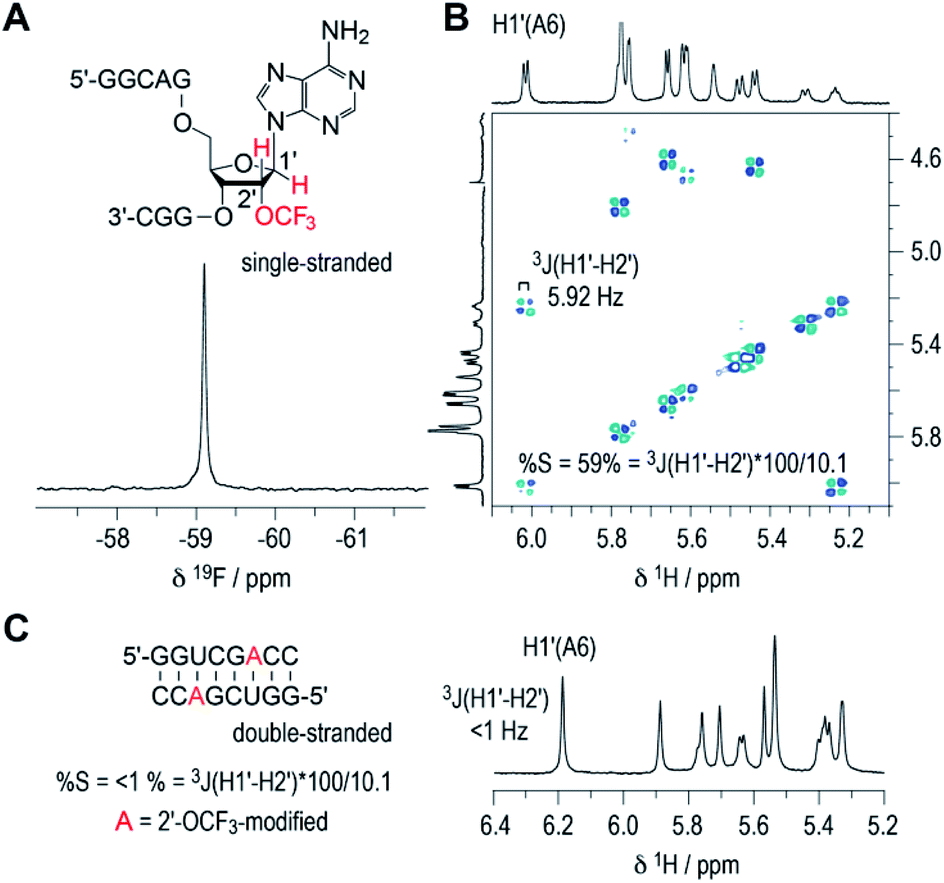 | ||
| Fig. 3 19F (A) and 1H/1H DQFCOSY (B) NMR spectra of single-stranded RNA 5′-GGCAG(2′-OCF3-A)GGC. For the 2′-OCF3 adenosine moiety, the 3-bond scalar coupling constant of H1′ and H2′ (3JH1′-H2′) was extracted from the corresponding crosspeak and amounted to 5.9 Hz. Assuming a pure C2′/C3′-endo equilibrium, this value is correlated to a C2′-endo (South) population of 58%.38,40 (C) 1H NMR spectrum of the self-complementary 8 nt RNA with 2′-OCF3-A group (red); 3JH1′–H2′ is smaller than 1 Hz, consistent with prevalent C3′-endo conformation in the double helix. Conditions: c(RNA) = 0.3 mM; 15 mM Na[AsO2(CH3)2]·3H2O, 25 mM NaCl, 3 mM NaN3, in D2O, pH 6.5, 296 K. | ||
X-ray structures of 2′-OCF3 containing RNA
We set out for the X-ray analysis of a 2′-OCF3 modified RNA (Fig. 4). To this end, we used the 27 nt fragment of E. coli 23 S rRNA sarcin-ricin loop (SRL) region. This sequence is known to be a robust and well-behaved crystallization scaffold that can accommodate small modifications.46,47 For the installation of 2′-OCF3, we deemed nucleotide A2670 appropriate which forms a Watson−Crick base pair with U2650 in the regular A-form double helical region of this RNA, as well as nucleotide C2667 which forms a water-mediated mismatch with U2653. The latter RNA crystallized in the same tetragonal crystal form as the unmodified RNA46 and also diffracted to atomic resolution (0.9 Å). A new monoclinic crystal form was obtained with 2′-OCF3 A2670-modified SRL RNA (relative to former SRL RNA crystal forms), containing three molecules per asymmetric unit and diffracting to 2.4 Å resolution (ESI Table 2‡). The 2′-OCF3 modification did not affect the overall structure (r.m.s.d. ∼0.4 Å for 2′-OCF3–C2667 compared to the unmodified structure; PDB ID 3DVZ), including sugar puckers of modified positions (ESI Fig. 4‡). As previously observed for the 2′-SCF3–C2667 modification,29 a fluorine atom of the 2′-OCF3 group closely approached the oxygen atom of its cytosine nucleobase (O2). It is tempting to assume that the short distance observed (2.9 Å) is indicative of a halogen bond, however, fluorine (as opposed to chlorine, bromine, or iodine) usually retains a strongly electronegative electrostatic potential in biomolecules.63,64 Nevertheless, we note that the trifluoromethyl modification additionally comes also close the O4′ of the next G2668 residue (O–F distance is 3.2 Å, ESI Fig. 5‡) which further fuels speculations on possible stabilizing interactions. | ||
| Fig. 4 X-ray structure of 2′-OCF3 modified RNA at atomic resolution. (A) Secondary structure of the E. coli Sarcin-ricin stem-loop (SRL) RNA used for crystallization. The 2′-OCF3 modified cytidine is labeled in red. Adenosine in green highlights the second 2′-OCF3 modified RNA solved in this study (see ESI Fig. 4 and 5‡) and uridine in blue refers to a previously solved 2′-SCF3 modified SRL RNA for reason of comparison.29 (B) Superimposition of the 2′-OCF3–C2667 modified RNA (PDB ID 6ZYB red) and 2′-SCF3–U2650 modified RNA (PDB ID 4NHX, blue). Trifluoromethyl modifications are visible outside the RNA stem loop (on the center-right for OCF3 and in the bottom-left for SCF3). (C) 2Fobs − Fcalc electron density map contoured at 1.5 σ level showing the U2653/2′-OCF3-C2667 base pair. Water molecules are shown as red spheres (PDB ID 6ZYB). | ||
2′-OCF3 NMR analysis of structure-ambivalent RNA
The biological function of RNA is determined by the secondary and tertiary structure, defining the RNA fold.48 The folding path usually proceeds via intermediates that represent local minima in the RNA folding free energy landscape. When these intermediates are separated by large energy barriers they constitute folding traps and, therefore, the timescale of the folding process may take up to minutes and longer. One of the most prominent examples is a single RNA sequence of 150 nucleotides in length that co-exists in two stable folds harboring distinct ribozyme activities.49 Even for shorter RNA, structure ambivalence is encountered, e.g. hairpin-duplex equilibria of palindromic RNAs or the occurrence of competing secondary structures of the same RNA.50,51 The latter plays a crucial role in bacterial gene regulation by so-called riboswitches which are located in the untranslated leader regions of nascent mRNA where terminator stem versus antiterminator formation during transcription signals ON or OFF.52Fig. 5 illustrates a short bistable RNA that competes between two defined secondary structures. The CF3 label is attached at the adenosine in sequence position 3 and hence resides in the double helical stem of one fold while it is found in the single stranded overhang of the alternative fold (Fig. 5A and ESI Fig. 6‡). At room temperature (and also at slightly increased temperatures), the two folds are in slow exchange with respect to the NMR time scale. Two distinct 19F resonances are obtained (Fig. 5A and B) and assigned by comparison to a short reference hairpin that matches one substructure and adopts a single fold only (Fig. 5A). Interestingly, the line-widths of the two 19F resonances arising from the 2′-OCF3 group in the two folding states exhibit a large difference. The half-height line-width is 7 Hz for the ‘single strand’–19F resonance while it is increased by a factor of almost three for the ‘double helix’–19F resonance (20 Hz). Likely, the rotation of the 2′-OCF3 group in the base-paired stem is sterically hindered leading to signal broadening due to exchange on the μs to ms time scale.
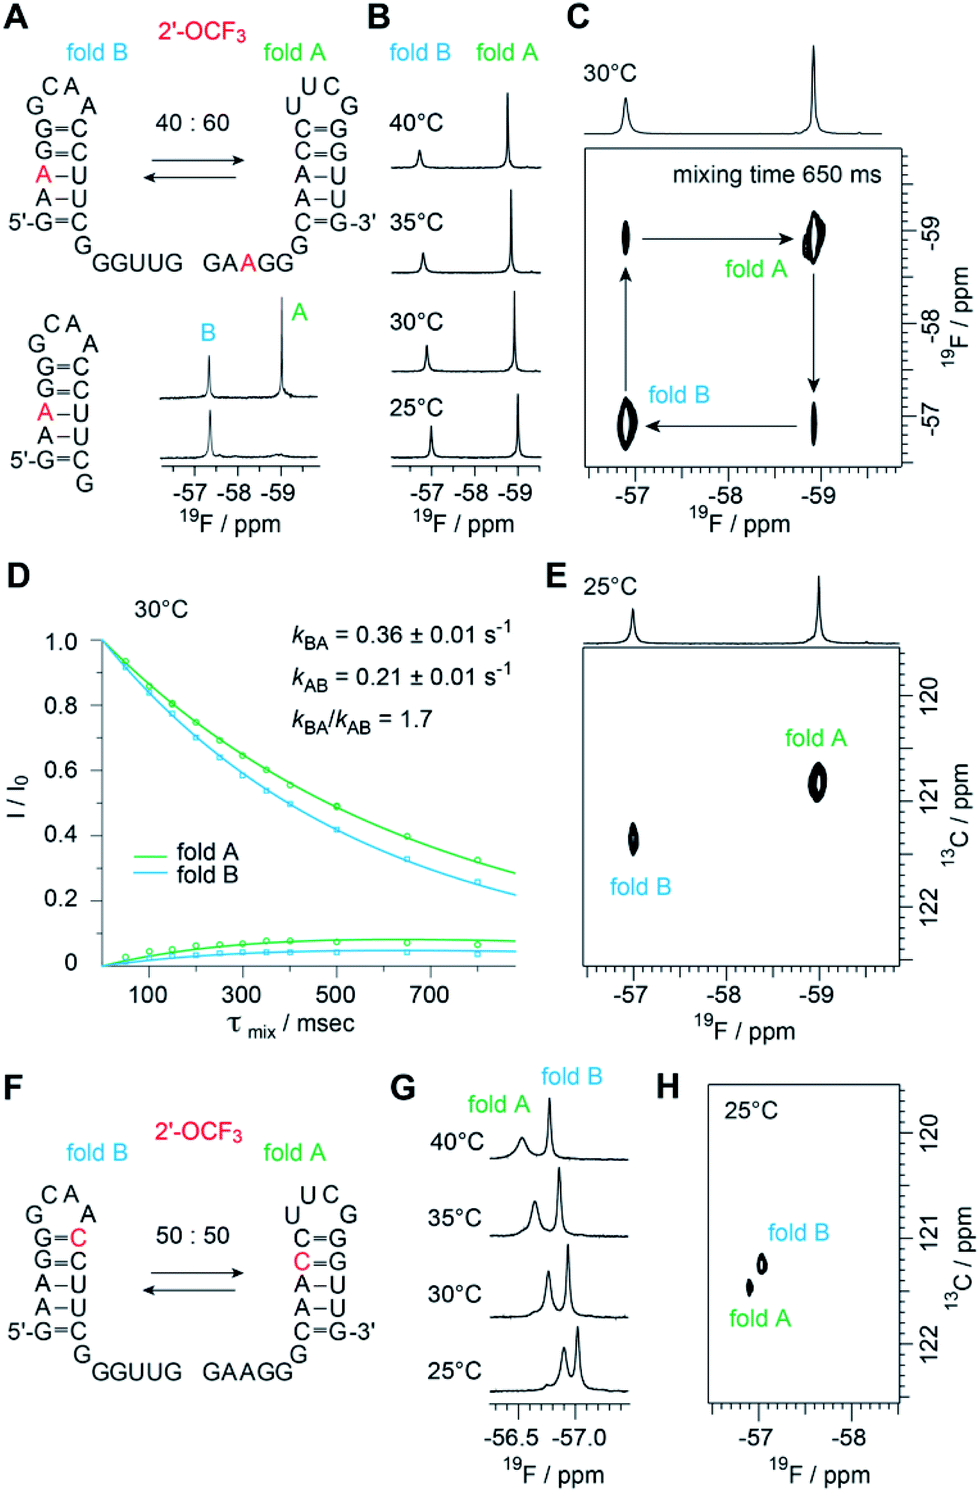 | ||
Fig. 5 Structure probing of a bistable RNA with a single 2′-OCF3 label. (A) Secondary structure of full-length (top left) and reference RNA (bottom left), both with the 2′-OCF3 labeled A3, and 19F-NMR (470 MHz) spectra (bottom right). Conditions: c(RNA) = 0.3 mM, 15 mM sodium cacodylate, 25 mM NaCl, pH 6.5, H2O/D2O = 9![[thin space (1/6-em)]](https://www.rsc.org/images/entities/char_2009.gif) :1, 298 K; (B) temperature-dependent series of 19F-NMR (564 MHz) spectra. (C) 19F/19F-EXSY (564 MHz) spectrum (650 ms mixing time, same conditions as in (A)). The crosspeaks between the 19F resonances assigned to the two folds originate from a chemical exchange process between the two folds at the millisecond time scale. (D) Exchange peaks build-up and R1 decay curves of the exchange experiment for residue A3 for the forward and backward folding event. Exchange rates are indicated, the following longitudinal relaxation rates were obtained: R1A = 1.01 ± 0.11 s−1, R1B = 1.56 ± 0.18 s−1. The experiments were run at mixing times ranging from 50 ms to 800 ms at 303 K. Dots are the experimental data, fits are shown as solid lines. Error rates were determined by Monte Carlo analysis with peak intensities randomly modulated according to noise levels exchange spectra. (E) 19F–13C HSQC spectrum of the RNA shown in panel A. (F) Same RNA but with 2′-OCF3 label at C10. (G) Temperature-dependent series of 19F-NMR spectra. (H) 19F–13C HSQC spectrum of the RNA shown in panel F. :1, 298 K; (B) temperature-dependent series of 19F-NMR (564 MHz) spectra. (C) 19F/19F-EXSY (564 MHz) spectrum (650 ms mixing time, same conditions as in (A)). The crosspeaks between the 19F resonances assigned to the two folds originate from a chemical exchange process between the two folds at the millisecond time scale. (D) Exchange peaks build-up and R1 decay curves of the exchange experiment for residue A3 for the forward and backward folding event. Exchange rates are indicated, the following longitudinal relaxation rates were obtained: R1A = 1.01 ± 0.11 s−1, R1B = 1.56 ± 0.18 s−1. The experiments were run at mixing times ranging from 50 ms to 800 ms at 303 K. Dots are the experimental data, fits are shown as solid lines. Error rates were determined by Monte Carlo analysis with peak intensities randomly modulated according to noise levels exchange spectra. (E) 19F–13C HSQC spectrum of the RNA shown in panel A. (F) Same RNA but with 2′-OCF3 label at C10. (G) Temperature-dependent series of 19F-NMR spectra. (H) 19F–13C HSQC spectrum of the RNA shown in panel F. | ||
The sensitive 2′-OCF3 label was also used to analyze the underlying kinetics of refolding for the bistable RNA. For that purpose, we used 19F longitudinal exchange NMR spectroscopy.53–55 As expected we found two 19F correlation peaks (fold A and fold B) in the 19F NOESY exchange spectrum of the RNA (with a single 2′-OCF3 labeled adenosine) for which exchange peaks could be identified (Fig. 5C). The forward and backward folding rates of the secondary structure equilibrium were determined at 30 °C (Fig. 5D). We found a forward rate constant kBA of 0.36 ± 0.01 s−1 and a rate constant kAB for the folding process from state A to state B of 0.21 ± 0.01 s−1, giving a good agreement with the equilibrium constant obtained from peak integration (KInt,30°CAB = 1.9 and K30°CAB = kBA/kAB = 1.7). Using our 19F labeling approach, we were thus able to characterize the refolding kinetics of the bistable RNA under near physiological conditions.
Furthermore, to analyze the impact of the labeling position we synthesized the same bistable RNA but with 2′-OCF3 at C10. As expected, we observed two distinct 19F NMR resonances for the two folds in slow exchange, albeit the chemical shift difference was smaller, consistent with the label located in double helical regions in both folds (Fig. 5F). The equilibrium position (50:50) (Fig. 5G and ESI Fig. 7‡) was only slightly shifted compared the 2′-OCF3 A3 labeled counterpart (40:60) and confirmed the flexibility for 2′-OCF3 positioning despite of being a non-isosteric label. At this point, we also mention that the native (unmodified) RNA exists in a 50:50 equilibrium as was determined earlier.23
With respect to increasing temperatures, the 19F NMR resonances shifted to lower magnetic field. This shift was more pronounced for the 2′-OCF3–C labeled RNA (Fig. 5G) compared to the 2′-OCF3–A labeled RNA (Fig. 5B), which might be due to fraying of the loop closing base pair of which 2′-OCF3–C is part of (Fig. 5F, fold B).
Finally, we characterized both RNAs by recording 19F–13C HMQC spectra (Fig. 5E and H). We were able to obtain high quality natural abundance 19F 13C correlation spectra for rather dilute samples (ca. 150 μM each fold) overnight. By adding the carbon dimension, better spectral dispersion is obtained, which in principle would allow to apply 13C ZZ exchange spectroscopy in 2′-O13CF3 labeled systems. It will be further highly interesting to explore the TROSY properties of the 2′-O13CF3 methyl group in RNA by combining 19F and 13C stable isotope labeling. In a recent work by Sykes and co-workers no favorable TROSY effect in proteins was found using 3-bromo-1,1,1-trifluoroacetone as labeling reagents. The absence of the TROSY effect was attributed to the dominating CSA relaxation mechanism in the alpha CF3 group suggesting that gains from CF3-HMQC experiments should be only observable at low magnetic fields.62 Nevertheless, it remains to be clarified if the 2′-O13CF3 shows a more beneficial TROSY effect due to the different chemical environment.
2′-OCF3 NMR analysis of RNA-ligand binding
The new 2′-OCF3–label is highly practical for NMR studies of RNA–ligand interactions. In Fig. 6, a comparison of the 7-aminomethyl-7-deazaguanine (preQ1) sensing class-I riboswitches from Thermoanaerobacter tengcongensis (Tte) (Fig. 6A) and Fusobacterium nucleatum (Fn) is illustrated (Fig. 6B).56–58 These RNAs adopt the same overall fold but differ in sequence and ligand affinity, the latter by about an order of magnitude (Kd(Tte) ∼20 nM versus Kd(Fn) ∼260 nmol).57,58 Moreover, for the Tte riboswitch, crystal structures at high resolution exist of both, the free and the preQ1-bound RNA,57 and therefore a solid foundation to explore the underlying conformational adaptions during ligand-induced folding is available.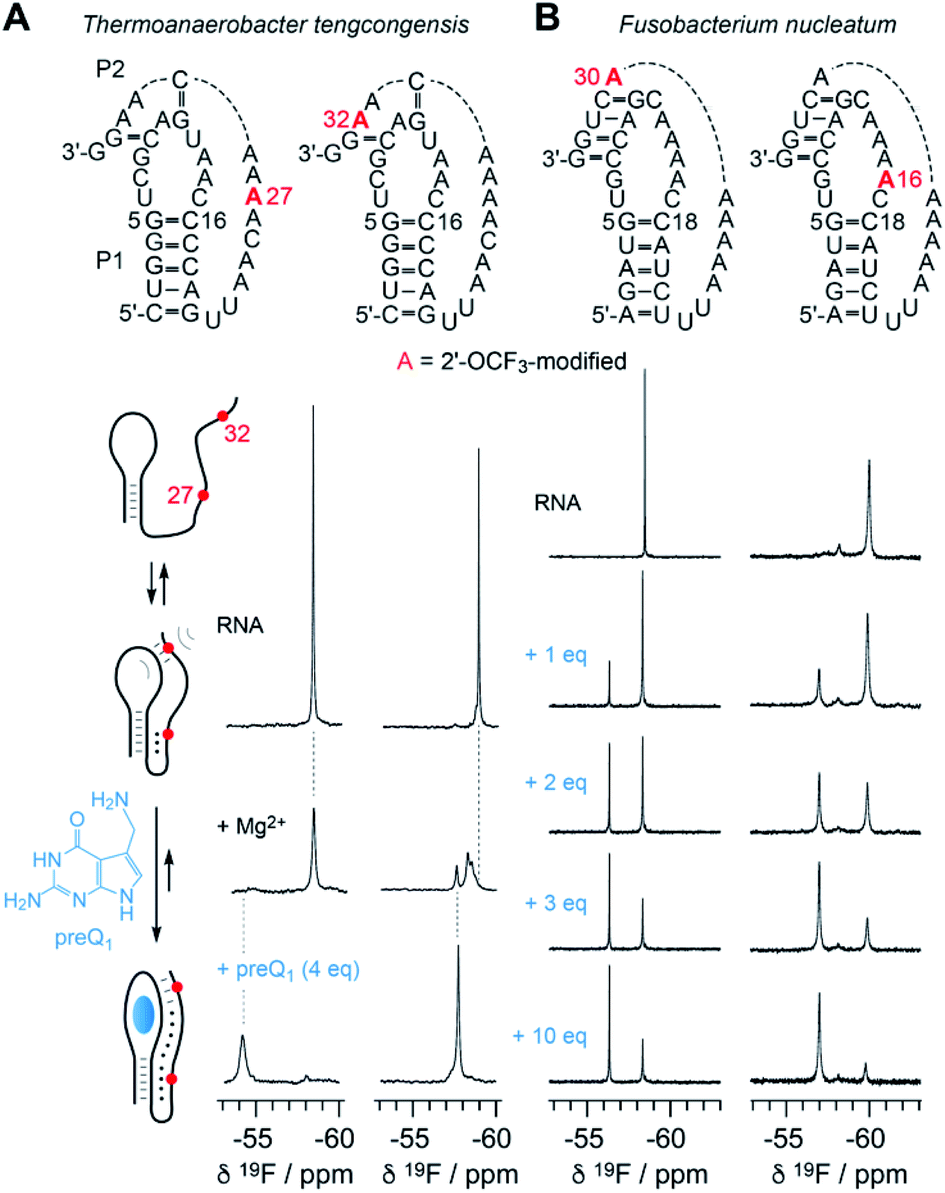 | ||
| Fig. 6 NMR spectroscopic analysis of RNA-ligand binding. (A) Secondary structure of Thermoanaerobacter tengcongensis preQ1-I riboswitch with 2′-OCF3 position indicated in red (top); schematic folding model (left) of aptamer-assisted RNA pseudoknot formation, and stabilization through binding of the small molecule 7-aminomethyl-7-deazaguanine (preQ1) indicated in blue; 19F NMR (564 MHz) spectra of RNA in response to Mg2+ and preQ1 addition (right). Conditions: c(RNA) = 0.14 mM, 15 mM sodium cacodylate, 25 mM NaCl, pH 6.5, 297 K; additions: c(Mg2+) = 2.0 mM; followed by c(preQ1) equivalents as indicated. (B) Secondary structure of Fusobacterium nucleatum preQ1-I riboswitch with two distinct 2′-OCF3 positions in red (top). 19F NMR (564 MHz) spectra of RNA in response to preQ1 titrations (right). Conditions: c(RNA) = 0.3 mM, 25 mM sodium cacodylate, pH 6.5, 298 K; additions: c(Mg2+) = 2.0 mM; followed by c(preQ1) equivalents as indicated. | ||
At the left side of Fig. 6A, a secondary structure folding model for the preQ1 riboswitch is shown. The two RNAs with a single 2′-OCF3 label at either position 27 or 32 give a single 19F resonance in the absence of Mg2+ (Fig. 6A, spectra at top) which is consistent with a stem-loop fold and a conformationally flexible 3′-tail. In the presence of physiological concentrations of Mg2+ and a 3-fold excess of preQ1 ligand, both RNAs again provide a single – albeit broadened – resonance that is significantly shifted to low-field (Fig. 6A, spectra at bottom). This is consistent with a defined conformation of the preQ1–bound state. When only Mg2+ (and no preQ1) is added, the RNA becomes partially preorganized into a pseudoknot. Interestingly, the label at position 32 indicates heterogeneities within (or close to) the loop–tail interaction, reflected by the occurrence of three, partly overlapping 19F-resonances (Fig. 6A, spectrum at middle right). This suggests three distinct conformations in slow exchange, one of them closely resembling the ligand-bound state according to chemical shift comparison. We note that the observation of three states is consistent with a previous NMR study where the formation of individual (15N-labeled) base pairs of the same riboswitch system was tracked.59 We furthermore believe that two of the three folding states likely correspond to the conformational distinction seen in high-resolution crystal structures of free versus preQ1-bound Tte RNA. In the ligand-free pseudoknot form, A14 takes the position of the preQ1 ligand and is stacked between the two base pairs of G11–C30 and G5–C16.57,59 This observation can be rationalized by a conformational rearrangement from a solvent-exposed base C15 to a flipped-in conformation of C15 that becomes the Watson–Crick pairing partner of preQ1 in the ligand-bound pseudoknot RNA.60
Fig. 6B depicts NMR spectra of the titration of the Fn preQ1 riboswitch which binds preQ1 13-fold weaker compared to the Tte counterpart. Furthermore, the loop size of the Fn RNA contains two additional nucleotides and the pseudoknot interaction allows formation of a continuous 4 bp double helix.61 We placed the 2′-OCF3 labels in different positions, one in the tail to sense pseudoknot formation, and the other one in the loop next to the cytosine that can form a Watson–Crick base pair with preQ1. Both labels allow to monitor the binding process. By increasing the concentration of preQ1 stepwise, an increasing fraction of the preQ1-RNA complex is observed, reflected in a second 19F resonance that is shifted to lower field. In contrast to the Tte RNA, the Fn riboswitch shows a significant population of unbound RNA, even at a ten-fold excess of ligand over RNA. Furthermore, a folding intermediate is also indicated by the appearance of a third resonance for the 2′-OCF3 A16 labeled RNA, although existing in a minor population only. Another interesting feature is that the line width of the 19F resonance of the label next to the pseudoknot double helix (A30) is rather small and the OCF3 group seems to be hardly hindered in rotational freedom compared to the other three labeling positions in the two riboswitch systems.
Conclusions
Over the last decades, several 19F labels for nucleic acids NMR spectroscopy have been introduced, among them are single fluorine labels (such as pyrimidine 5-F,16–20 ribose 2′-F,21–25 and 4′-F,3), trifluoromethyl labels (such as pyrimidine 5-CF3,26 4′-C-[(4-trifluoromethyl-1H-1,2,3-triazol-1-yl)methyl] ribose,27 2′-SCF3,28–30 and very recently 8-CF3 guanine,66), and a nine-fluorine-atom label (in form of 5-[4,4,4-trifluoro-3,3-bis(trifluoromethyl)but-1-ynyl] 2′-deoxyuridine).4 Comparing them, the first subgroup is superior with respect to steric demands but suffers from low sensitivity and the need for proton decoupling;21–25 the opposite is true for the nine-fluorine-atom label which is highly sensitive but sterically demanding.4 Therefore, trifluoromethyl labels appear to be a good compromise.26–30 The pyrimidine 5-CF3 group, however, has been described to be chemically unstable during deprotection of synthetic nucleic acids, resulting in low yields and length limitation.26 Differently, the 2′-SCF3 group – although synthetically well accessible – strongly affects thermodynamic base pairing strength which is a drawback for applications that aim at the elucidation of folding pathways.28–30 All critical aspects and requirements are very well satisfied by the new 2′-OCF3 label as shown in this study; it therefore has potential to advance to the most broadly applicable fluorine label in NMR spectroscopy of nucleic acids. The 2′-OCF3 group possesses pronounced sensitivity and exhibits large chemical shift dispersion so that it is possible to distinguish distinct base sequences in double helical regions. Moreover, the ribose 2′ position guarantees principal synthetic accessibility to all of the four nucleosides. Additionally, the size of the OCF3 label matches the naturally occurring and widespread 2′-OCH3 group. For the investigation of naturally occurring 2′-OCH3 modification patterns in biologically meaningful settings, the 2′-OCF3 group will be an ideal candidate.Conflicts of interest
There are no conflicts to declare.Acknowledgements
We thank Ulrike Rieder (Innsbruck) for initial 19F-NMR measurements of the Fn preQ1 riboswitch, Martin Tollinger (Innsbruck) for advice in data fitting, and Vincent Olieric for help during data collection at SLS, Villigen. This work was supported by the Austrian Science Fund FWF (P27947, P31691, F8011-B to R. M; P32773 to C. K.), the Austrian Research Promotion Agency FFG [West Austrian BioNMR 858017], and the Wiener Wissenschafts-, Forschungs-und Technologiefonds (WWTF LS17-003).Notes and references
- S. Cobb and C. Murphy, J. Fluorine Chem., 2009, 130, 132 CrossRef CAS.
- F. Guo, Q. Li and C. Zhou, Org. Biomol. Chem., 2017, 15, 9552 RSC.
- Q. Li, J. Chen, M. Trajkovski, Y. Zhou, C. Fan, K. Lu, P. Tang, X. Su, J. Plavec, Z. Xi and C. Zhou, J. Am. Chem. Soc., 2020, 142, 4739 CrossRef CAS.
- A. Kiviniemi and P. Virta, J. Am. Chem. Soc., 2010, 132, 8560 CrossRef CAS.
- F. Sochor, R. Silvers, D. Müller, C. Richter, B. Fürtig and H. Schwalbe, J. Biomol. NMR, 2016, 64, 63 CrossRef CAS.
- R. Moumné, M. Pasco, E. Prost, T. Lecourt, L. Micouin and C. Tisné, J. Am. Chem. Soc., 2010, 132, 13111 CrossRef.
- W. Huang, G. Varani and G. P. Drobny, J. Am. Chem. Soc., 2010, 132, 17643 CrossRef CAS.
- L. Liu, I. J. Byeon, I. Bahar and A. M. Gronenborn, J. Am. Chem. Soc., 2012, 134, 4229 CrossRef CAS.
- D. Graber, H. Moroder and R. Micura, J. Am. Chem. Soc., 2008, 130, 17230 CrossRef CAS.
- M. Egli and M. Manoharan, Acc. Chem. Res., 2019, 52, 1036 CrossRef CAS.
- P. Wadhwani, E. Strandberg, N. Heidenreich, J. Bürck, S. Fanghanel and A. S. Ulrich, J. Am. Chem. Soc., 2012, 134, 6512 CrossRef CAS.
- H. L. Bao, T. Ishizuka, T. Sakamoto, K. Fujimoto, T. Uechi, N. Kenmochi and Y. Xu, Nucleic Acids Res., 2017, 45, 5501 CrossRef CAS.
- S. Purser, P. R. Moore, S. Swallow and V. Gouverneur, Chem. Soc. Rev., 2008, 37, 320 RSC.
- C. Li, G.-F. Wang, Y. Wang, R. Creager-Allen, E. A. Lutz, H. Scronce, K. M. Slade, R. A. S. Ruf, R. A. Mehl and G. J. Pielak, J. Am. Chem. Soc., 2010, 132, 321 CrossRef CAS.
- E. Malek-Adamian, D. C. Guenther, S. Matsuda, S. Martínez- Montero, I. Zlatev, J. Harp, M. Burai Patrascu, D. J. Foster, J. Fakhoury, L. Perkins, N. Moitessier, R. M. Manoharan, N. Taneja, A. Bisbe, K. Charisse, M. Maier, K. G. Rajeev, M. Egli, M. Manoharan and M. Damha, J. Am. Chem. Soc., 2017, 139, 14542 CrossRef CAS.
- M. Hennig, L. G. Scott, E. Sperling, W. Bermel and J. R. Williamson, J. Am. Chem. Soc., 2007, 129, 14911 CrossRef CAS.
- B. Puffer, C. Kreutz, U. Rieder, M. O. Ebert, R. Konrat and R. Micura, Nucleic Acids Res., 2009, 37, 7728 CrossRef CAS.
- M. Hennig, M. L. Munzarova, W. Bermel, L. G. Scott, V. Sklenar and J. R. Williamson, J. Am. Chem. Soc., 2006, 128, 5851 CrossRef CAS.
- L. G. Scott and M. Hennig, Methods Enzymol., 2016, 566, 59 CAS.
- M. Olejniczak, Z. Gdaniec, A. Fischer, T. Grabarkiewicz, L. Bielecki and R. W. Adamiak, Nucleic Acids Res., 2002, 30, 4241 CrossRef CAS.
- B. Luy and J. P. Merino, J. Biomol. NMR, 2001, 20, 39 CrossRef CAS.
- B. Reif, V. Wittmann, H. Schwalbe, C. Griesinger, K. Wörner, K. Jahn-Hofmann, J. W. Engels and W. Bermel, Helv. Chim. Acta, 1997, 80, 1952 CrossRef CAS.
- C. Kreutz, H. Kählig, R. Konrat and R. Micura, J. Am. Chem. Soc., 2005, 127, 11558 CrossRef CAS.
- C. Kreutz, C. H. Kählig, R. Konrat and R. Micura, Angew. Chem., Int. Ed., 2006, 45, 3450 CrossRef CAS.
- A. Patra, M. Paolillo, K. Charisse, M. Manoharan, E. Rozners and M. Egli, Angew. Chem., Int. Ed., 2012, 51, 11863 CrossRef CAS.
- L. Granqvist and P. Virta, J. Org. Chem., 2014, 79, 3529 CrossRef CAS.
- W. H. Gmeiner, R. T. Pon and J. W. Lown, J. Org. Chem., 1991, 56, 3602 CrossRef CAS.
- K. Fauster, C. Kreutz and R. Micura, Angew. Chem., Int. Ed., 2012, 51, 13080 CrossRef CAS.
- M. Košutić, L. Jud, C. Da Veiga, M. Frener, K. Fauster, C. Kreutz, E. Ennifar and R. Micura, J. Am. Chem. Soc., 2014, 136, 6656 CrossRef.
- L. Jud, M. Košutić, V. Schwarz, M. Hartl, C. Kreutz, K. Bister and R. Micura, Chem.–Eur. J., 2015, 21, 10400 CrossRef CAS.
- N. Nishizono, Y. Sumita, Y. Ueno and A. Matsuda, Nucleic Acids Res., 1998, 26, 5067 CrossRef CAS.
- M. Kuroboshi, K. Suzuki and T. Hiyama, Tetrahedron Lett., 1992, 33, 4173 CrossRef CAS.
- R. A. Johnsson, J. J. Bogojeski and M. J. Damha, Bioorg. Med. Chem. Lett., 2014, 24, 2146 CrossRef CAS.
- M. P. Reddy, N. B. Hanna and F. Farooqui, Tetrahedron Lett., 1994, 35, 4311 CrossRef CAS.
- S. Pitsch, P. A. Weiss, J. Jenny, A. Stutz and X. Wu, Helv. Chim. Acta, 2001, 84, 3773 CrossRef CAS.
- F. Wachowius and C. Höbartner, ChemBioChem, 2010, 11, 469 CrossRef CAS.
- L. A. Marky and K. J. Breslauer, Biopolymers, 1987, 26, 1601 CrossRef CAS.
- M. Petersheim and D. H. Turner, Biochemistry, 1983, 22, 256 CrossRef CAS.
- F. M. Jucker, H. A. Heus, P. F. Yip, E. H. Moors and A. Pardi, J. Mol. Biol., 1996, 264, 968 CrossRef CAS.
- J. E. Johnson and C. G. Hoogstraten, J. Am. Chem. Soc., 2008, 130, 16757 CrossRef CAS.
- A. J. DePaul, E. J. Thompson, S. S. Patel, K. Haldeman and E. J. Sorin, Nucleic Acids Res., 2010, 38, 4856 CrossRef CAS.
- L. Li and J. W. Szostak, J. Am. Chem. Soc., 2014, 136, 2858 CrossRef CAS.
- J. Plavec, W. Tong and J. Chattopadhyaya, J. Am. Chem. Soc., 1993, 115, 9734 CrossRef CAS.
- A. I. Haziri and C. J. Leumann, J. Org. Chem., 2012, 77, 5861 CrossRef CAS.
- C. Altona and M. J. Sundaralingam, J. Am. Chem. Soc., 1973, 95, 2333 CrossRef CAS.
- V. Olieric, U. Rieder, K. Lang, A. Serganov, C. Schulze-Briese, R. Micura, P. Dumas and E. Ennifar, RNA, 2009, 15, 707 CrossRef CAS.
- C. C. Correll, I. G. Wool and A. Munishkin, J. Mol. Biol., 1999, 292, 275 CrossRef CAS.
- P. Brion and E. Westhof, Annu. Rev. Biophys. Biomol. Struct., 1997, 26, 113 CrossRef CAS.
- E. A. Schultes and D. P. Bartel, Science, 2000, 289, 448 CrossRef CAS.
- R. Micura, C. Höbartner and C., ChemBioChem, 2003, 4, 984 CrossRef CAS.
- C. Höbartner and R. Micura, J. Mol. Biol., 2003, 325, 421 CrossRef.
- W. C. Winkler and R. R. Breaker, Chembiochem, 2003, 4, 1024 CrossRef CAS.
- K. Kloiber, R. Spitzer, M. Tollinger, R. Konrat and C. Kreutz, Nucleic Acids Res., 2011, 39, 4340 CrossRef CAS.
- C. H. Wunderlich, R. Spitzer, T. Santner, K. Fauster, M. Tollinger and C. Kreutz, J. Am. Chem. Soc., 2012, 134, 7558 CrossRef CAS.
- R. Spitzer, K. Kloiber, M. Tollinger and C. Kreutz, Chembiochem, 2011, 12, 2007 CrossRef CAS.
- A. Roth, W. C. Winkler, E. E. Regulski, B. W. Lee, J. Lim, I. Jona, J. E. Barrick, A. Ritwik, J. N. Kim, R. Welz, D. Iwata-Reuyl and R. R. Breaker, Nat. Struct. Mol. Biol., 2007, 14, 308 CrossRef CAS.
- J. L. Jenkins, J. Krucinska, R. M. McCarty, V. Bandarian and J. E. Wedekind, J. Biol. Chem., 2011, 286, 24626 CrossRef CAS.
- U. Rieder, C. Kreutz and R. Micura, Proc. Natl. Acad. Sci. U. S. A., 2010, 107, 10804 CrossRef CAS.
- S. Neuner, T. Santner, C. Kreutz and R. Micura, Chem.–Eur. J., 2015, 21, 11634 CrossRef CAS.
- T. Santner, U. Rieder, C. Kreutz and R. Micura, J. Am. Chem. Soc., 2012, 134, 11928 CrossRef CAS.
- U. Rieder, K. Lang, C. Kreutz, N. Polacek and R. Micura, Chembiochem, 2009, 10, 1141 CrossRef CAS.
- B. A. Klein and B. D. Sykes, J. Biomol. NMR, 2019, 73, 519 CrossRef CAS.
- P. Auffinger, F. A. Hays, E. Westhof and P. S. Ho, Proc. Natl. Acad. Sci. U. S. A., 2004, 101, 16789 CrossRef CAS.
- D. Bulfield and S. M. Huber, Chem. - Eur. J., 2016, 22, 14434 CrossRef CAS.
- J.-B. Liu, X.-H. Xu and F.-L. Qing, Org. Lett., 2015, 17, 5048 CrossRef CAS.
- H.-L. Bao, T. Masuzawa, T. Oyoshi and Y. Xu, Nucleic Acids Res., 2020, 48, 7041 Search PubMed.
Footnotes |
| † R. M. dedicates this paper to Prof. Karl Grubmayr, who has been a wonderful mentor, on the occasion of his 70th birthday. |
| ‡ Electronic supplementary information (ESI) available: Synthetic procedures and analysis data for the synthesis of phosphoramidite A7, C7a and C7b; table of 2′-OCF3 RNAs synthesized; 1H, 13C and 19F-NMR spectroscopic analysis of 2′-OCF3 RNAs; table of X-ray data collection and refinement statistics; additional views and overlays of X-ray structures of 2′-OCF3 SRL RNA and hydration patterns. See DOI: 10.1039/d0sc04520a |
| This journal is © The Royal Society of Chemistry 2020 |