
 Open Access Article
 This Open Access Article is licensed under a Creative Commons Attribution-Non Commercial 3.0 Unported Licence
A photocleavable peptide-tagged mass probe for chemical mapping of epidermal growth factor receptor 2 (HER2) in human cancer cells†
Liang
Liu‡
ac,
Yuqiong
Kuang‡
ad,
Zhongcheng
Wang
a and
Yun
Chen
 *ab
*ab
aSchool of Pharmacy, Nanjing Medical University, Nanjing, 211166, China. E-mail: ychen@njmu.edu.cn
bState Key Laboratory of Reproductive Medicine, Key Laboratory of Cardiovascular & Cerebrovascular Medicine, Nanjing, 210029, China
cDepartment of Pharmacy, Zhongnan Hospital of Wuhan University, Wuhan, 430071, China
dDepartment of Pharmacy, The First Affiliated Hospital with Nanjing Medical University, 210029, China
First published on 30th September 2020
Abstract
Human epidermal growth factor receptor 2 (HER2) testing has great value for cancer diagnosis, prognosis and treatment selection. However, the clinical utility of HER2 is frequently tempered by the uncertainty regarding the accuracy of the methods currently available to assess HER2. The development of novel methods for accurate HER2 testing is in great demand. Considering the visualization features of in situ imaging and the quantitative capability of mass spectrometry, integration of the two components into a molecular mapping approach has attracted increasing interest. In this work, we reported an integrated chemical mapping approach using a photocleavable peptide-tagged mass probe for HER2 detection. The probe consists of four functional domains, including the recognition unit of an aptamer to catch HER2, a fluorescent dye moiety (FITC) for fluorescence imaging, a reporter peptide for mass spectrometric quantification, and a photocleavable linker for peptide release. After characterization of this novel probe (e.g., conjugation efficiency, binding affinity and specificity, and photolysis release efficiency), the probe binding and photolysis release conditions were optimized. Then, fluorescence images were collected, and the released reporter peptide after photolysis was quantified by liquid chromatography-tandem mass spectrometry (LC-MS/MS). A limit of quantification (LOQ) of 25 pM was obtained, which very well meets the requirements for clinical laboratory testing. Finally, the developed assay was applied for HER2 testing in four breast cancer cell lines and 42 pairs of human breast primary tumors and adjacent normal tissue samples. Overall, this integrated approach based on a photocleavable peptide-tagged mass probe can provide chemical mapping including both quantitative and visual information of HER2 reliably and consistently, and may pave the way for clinical applications in a more accurate manner.
Introduction
There is much evidence indicating that human epidermal growth factor receptor 2 (HER2), a transmembrane receptor tyrosine kinase, plays a critical role in the physiological and pathologic processes of cancers.1 Thus, the detection of HER2, among a relatively small number of biomarkers approved by the Food and Drug Administration (FDA)2 and recommended by the American Society of Clinical Oncology/College of American Pathologists (ASCO/CAP), is essential for the molecular diagnosis and stratification of various cancers, such as breast cancer.3 More importantly, analysis of the levels and distribution of HER2 has great clinical value for both cancer prognosis and the identification of patients who will benefit from HER2-targeted therapy.4 However, the clinical utility of HER2 is frequently tempered by the uncertainty regarding the accuracy of HER2 testing. Recent studies have suggested that method-related variables are significant influencing factors of testing accuracy.5Currently, there are several techniques available to detect HER2. The most common techniques for clinical tissue specimens are in situ imaging techniques, such as immunohistochemistry (IHC) as a primary technique to detect protein overexpression, and fluorescence in situ hybridization (FISH) as a reflex test to detect gene amplification.6 Both IHC and FISH are morphologically driven and can directly image target distribution, thus permitting correlations between the target protein/gene expression and morphological features in tissue sections.7 As the primary method of diagnosis, IHC is highly susceptible to many factors, one of which is the involvement of antibodies. In general, antibodies may lose activity during chemical modification or inappropriate storage.8 More importantly, various commercially available antibodies display different specificity and sensitivity, leading to the difficulty of standardization across different studies and different laboratories.9 Moreover, interpretation of IHC results is normally based on scoring chemical staining on a semi-quantitative scale, which may cause a substantial discrepancy in the verdict of pathologists, especially for the cases scored as equivocal (2+) cases.10 Even though FISH reflex testing is recommended (not affirmatively required) for equivocal cases, FISH is more expensive and time-consuming, and interpretation of FISH assays needs well-trained personnel.11 In addition, for many genes, DNA/mRNA measurements are poor predictors of protein abundance,12 which is more closely aligned with clinical outcomes. Nevertheless, there are still a certain percentage of cases showing an equivocal score even after reflex testing.13 Therefore, novel assays are urgently needed to offer more comprehensive and accurate information for reliable and consistent HER2 detection.
In this context, the integration of novel techniques into HER2 testing to improve accuracy has gained increasing interest.14 In the past decade, liquid chromatography-tandem mass spectrometry (LC-MS/MS)-based targeted proteomics has become a useful tool for protein quantification due to its high sensitivity, high selectivity, and quantitative capability.15–17 In addition, MS/MS is one of the only two FDA-approved mass spectrometers as medical devices for clinical testing,18 which are achieving prominence in laboratory medicine.19 Moreover, a previous study succeeded in indirectly quantifying membrane proteins via a peptide-tagged mass probe, which circumvented the difficulty of membrane protein extraction and digestion.20 To date, the combination of LC-MS/MS quantification with imaging analysis for biomarker detection in clinical testing has been rarely reported. If this method can be combined with IHC, better HER2 mapping and greater testing accuracy may be achieved. Inspired by this conception, we attempted to build an integrated mapping assay by applying a novel peptide-tagged mass probe (i.e., HB5-FITC-PL-Peptide) for the visualization and quantification of HER2 by fluorescence imaging and LC-MS/MS. This probe consists of four functional domains, including the aptamer HB5 to specifically catch HER2, a fluorescent dye moiety (FITC) for fluorescence imaging, a reporter peptide for mass spectrometric quantification, and a photocleavable o-nitrobenzyl derivative linker for peptide release. The fundamental principle of this approach is illustrated in Fig. 1. In brief, a fluorescence image was obtained after the peptide-tagged mass probe was bound to HER2 via aptamer-specific recognition. After that, photolysis was initiated to rapidly release the reporter peptide, which was ultimately quantified by LC-MS/MS. In this way, the distribution and levels of HER2 can be acquired sequentially. After characterization of the probe (e.g., conjugation efficiency, binding affinity and specificity, and photolysis release efficiency), the new assay was optimized for parameters such as probe binding and photolysis release. Finally, this HER2 mapping assay was applied to four breast cancer cell lines, including HER2-positive cells (BT474 and SK-BR-3) and HER2-negative cells (MDA-MB-231 and MCF-7), as well as to 42 pairs of human breast primary tumors and adjacent normal tissue specimens.
 | ||
| Fig. 1 Schematic representation of the photocleavable peptide-tagged mass probe for chemical mapping of HER2. The probe consists of four functional domains (i.e., the aptamer HB5 capable of targeting the HER2 protein, a fluorophore for fluorescence imaging, a photocleavable linker to release the reporter peptide and a reporter peptide as the target of mass spectrometry detection). The probe was prepared by a Michael addition reaction of the maleimide labeled at the C-terminus of AVLGVDPFR-PL-K(FITC)FK-Mal with a disulfide at the 5′ end of the aptamer HB5. Then, the newly synthesized probe was incubated with cells and tissue samples. Afterward, we performed in situ fluorescence imaging based on the FITC fluorophore. After that, photolysis was initiated to rapidly release the reporter peptide, and the reporter peptide was ultimately quantified by LC-MS/MS. In this way, the distribution and levels of HER2 could be acquired sequentially. | ||
Results and discussion
Design of a photocleavable peptide-tagged mass probe for HER2 mapping
To achieve both imaging and quantification of HER2, the system used for targeting, peptide cleavage and imaging was first designed.In recent years, aptamers have emerged as a successful alternative to antibodies. Traditionally, aptamers consist of single stranded DNA or peptides that may serve as targeting molecules by folding into distinct tertiary structures.23 In addition to their high affinity and good specificity, aptamers also exhibit other advantages, such as convenient synthesis, easy chemical modification, high stability over a wide range of storage conditions, and good reproducibility.24 Therefore, an aptamer was chosen as the targeting ligand in this study. Another factor considered for the probe design was the use of enzymes. There are two potential steps accessible to make use of enzymes: (1) chromogenic detection in imaging. Traditional IHC normally relies on chemical reactions triggered by enzymes conjugated with antibodies. Specifically, after the addition of an enzyme substrate, the substrate reacts with the enzyme and forms a solid, color-marking the target site at once.25 (2) Enzymatic cleavage to release the reporter peptide. To date, enzymatic reactions are the most common method employed in this field. However, a variety of factors, such as pH, buffer constituents and temperature, could easily affect the activity of enzymes.26 Moreover, enzyme reactions experience great challenges due to their long incubation time, normally requiring overnight incubation in most protocols for trypsin digestion.27 Analysis time is one of the most important factors restraining the development of rapid diagnosis.28 For the release of reporter peptides, enzyme-free methods such as photolysis are of more interest. The photolysis system, which is usually employed for drug release or as a protecting group in chemical synthesis, is rapid and inexpensive, and can be externally controlled. Therefore, this system has the potential for controlled release.29,30 On the other hand, fluorescence detection is emerging as an alternative to chromogen-based methods.31 This imaging branch does not require enzymatic incubation and has fewer optimization constraints. Furthermore, the generation of high-resolution images for protein localization becomes possible.32 With few references to these types of probes, several aspects of the photocleavable peptide-tagged mass probe-based HER2 mapping approach deserve careful design and evaluation to achieve good performance and high quality, including the selection of an appropriate aptamer, fluorophore, photocleavable linker and reporter peptide, and further integration of all these components into a probe molecule.
Preparation and characterization of a photocleavable peptide-tagged mass probe
Binding affinity and specificity are critical for aptamer selection. Recent studies have shown that HB5, an 86-nucleotide single-stranded DNA aptamer, has the ability to bind to HER2-positive breast cancer cells with high affinity by recognizing the extracellular domain of the HER2 protein.33,34 In this experiment, the dissociation constant (Kd) of HB5 to the HER2 epitope peptide INCTHSCVDLDDKGCPAEQR was valued as 34.7 nM by HPLC detection, implying high affinity of this aptamer. Our previous study also showed that HB5 had a relatively higher binding affinity to HER2-positive cells (SK-BR-3 and BT474) than HER2-negative cells (MCF-7 and MDA-MB-231).20The criteria for the selection of a suitable reporter peptide have been comprehensively presented.21,22 In accordance with in silico predictions and our empirical rules, AVLGVDPFR was selected as the reporter peptide tag in this study. Different from previous studies,21,22 this reporter peptide should avoid containing lysine residues. Theoretically, extra lysine residues could result in byproduct formation during peptide decoration with FITC or linkage to photocleavable groups, which will be discussed in the following section. Specifically, the most abundant form of AVLGVDPFR in the mass spectrum was afforded by its doubly charged ion. The product ion spectrum and LC-MS/MS chromatogram are presented in Fig. S1.†
As mentioned above, photolytic cleavage offers a mild method for reporter peptide release. Recently developed and commercially available o-nitrobenzyl represents a valuable tool for user-dictated spatial and temporal control in the release of diverse chemical groups, such as bioactive ligands and protecting groups.35 Moreover, the nitro group, together with two alkoxy groups on the benzene ring, facilitates photolytic cleavage with >350 nm UV light, which is less harmful for biological systems than UV light of shorter wavelengths.36
Notably, the reporter peptide can ligate to both the R1 and R2 positions of the benzene ring, as illustrated in Fig. S2.† Our results demonstrated that several products containing the reporter peptide were generated if the peptide was bound at the R2 position. In comparison, if added to the R1 position, the reporter peptide was the dominant product and could be released almost completely.37 As shown in Fig. S3,† we monitored the photolytic peptide and the reporter peptide by photolysis using multiple reaction monitoring (MRM). The mass responses of the photolysis product and the equimolar synthetic reporter peptide standard were detected, and the photolysis efficiency was calculated to be 99.9%. This result indicated that this photolysis system could be used for subsequent mass spectrometry-based target detection. Thus, we chose the R1 position for reporter peptide ligation in the present work. FITC was thus labeled at the R2 position of the benzene ring. It was not relatively less difficult to introduce FITC labeling with the o-nitrobenzyl group after we added three amino acid residues, KFK, at the R2 position. Specifically, the first lysine was FITC-labeled. The primary amine in the side chain of the lysine residue can be routinely conjugated with FITC using a standard chemical labeling method.38 Phenylalanine was used to decrease the overall polarity of the peptide for solid-phase synthesis. The second lysine modification with maleimide at the C-terminus was used for subsequent conjugation of the entire peptide sequence (AVLGVDPFR-PL-K(FITC)FK-Mal, Fig. 2A) to the aptamer HB5 as described below.
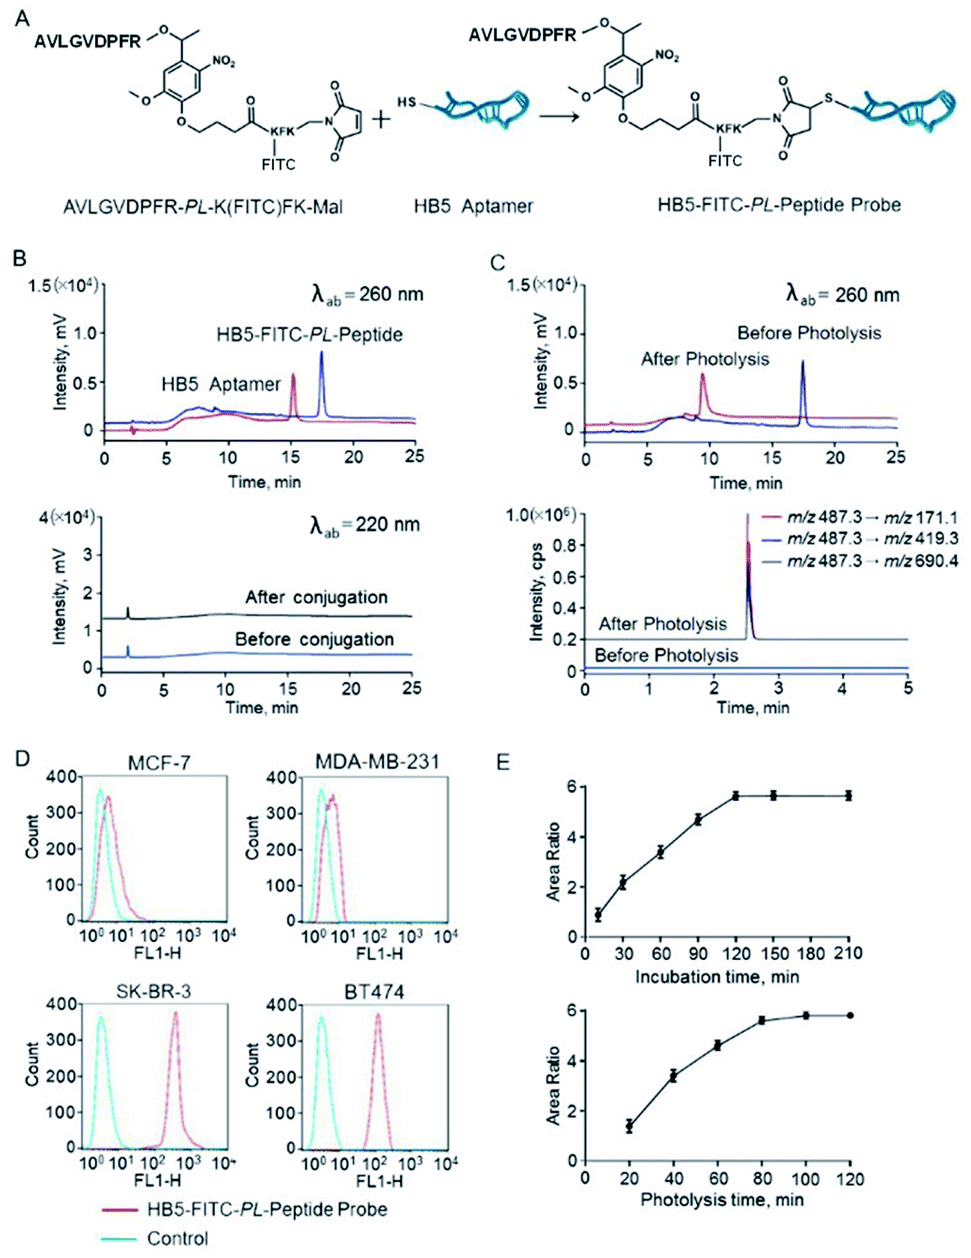 | ||
| Fig. 2 Characterization of the photocleavable peptide-tagged mass probe HB5-FITC-PL-Peptide. (A) The structure of the HB5-FITC-PL-Peptide probe and a schematic representation of probe synthesis by the Michael addition reaction. (B) HPLC chromatograms before and after conjugation of the aptamer HB5 and AVLGVDPFR-PL-K(FITC)FK at the wavelengths of DNA (260 nm) and peptide (220 nm). The HPLC conditions are described in the ESI.† As is shown, almost all HB5 can be exhausted in the presence of excess peptides. The peptide does not coelute under these HPLC conditions and affect the purity of the product (i.e., HB5-FITC-PL-Peptide). (C) HPLC chromatograms of the probe before and after photolysis at the wavelength of DNA (260 nm) and the corresponding LC-MS/MS chromatogram. (D) Specificity evaluation of HB5-FITC-PL-Peptide by flow cytometry. HB5-FITC-PL-Peptide has relatively strong binding to HER2-positive cells (BT474 and SK-BR-3) and negligible binding to HER2-negative cells (MDA-MB-231 and MCF-7), using random DNA as a control. (E) Optimization of the incubation time and photolysis time. Cells were incubated with HB5-FITC-PL-Peptide for 0.25 h to 3.5 h. The amount of bound probes reached a maximum at approximately 2 h. Cells were incubated with the probe for 20 min to 120 min. The peptide release reached a plateau at ∼100 min. | ||
Conjugation to the aptamer HB5 was achieved via a Michael addition reaction (Fig. 2A). Specifically, reduction of the disulfide at the 5′ terminus of HB5 was first applied before conjugation. Then, a conjugation reaction was carried out between the thiol and the maleimide at the C-terminus of AVLGVDPFR-PL-K(FITC)FK-Mal by thiol–maleimide coupling. The reactant HB5 before reduction and the product probe HB5-FITC-PL-Peptide were monitored by HPLC at 260 nm for DNA detection (Fig. 2B). The retention times of HB5 and HB5-FITC-PL-Peptide were 15.2 min and 17.5 min, respectively. In the presence of excess peptides, almost all HB5 can be exhausted. After the conjugation reaction, the reaction product was immediately purified and prepared using preparative HPLC.
The ligation product was further analyzed using MALDI-TOF/TOF mass spectrometry to provide solid evidence for the formation of HB5-FITC-PL-Peptide. The ion signal at 28![[thin space (1/6-em)]](https://www.rsc.org/images/entities/char_2009.gif) 706.65 Da was in agreement with the theoretical mass value of HB5-FITC-PL-Peptide (Fig. S4†). Photolysis of the probe was also evaluated by HPLC and LC-MS/MS, and the nucleotide and peptide fragments after photolysis were monitored. As expected, a new peak appeared, and its mass spectrum and retention time were consistent with those of the synthetic reporter peptide (Fig. 2C).
706.65 Da was in agreement with the theoretical mass value of HB5-FITC-PL-Peptide (Fig. S4†). Photolysis of the probe was also evaluated by HPLC and LC-MS/MS, and the nucleotide and peptide fragments after photolysis were monitored. As expected, a new peak appeared, and its mass spectrum and retention time were consistent with those of the synthetic reporter peptide (Fig. 2C).
Theoretically, chemical modification of aptamers may decrease the target binding affinity of aptamers.39,40 Thus, we determined the Kd of the HB5-FITC-PL-Peptide probe using the HER2 epitope peptide as the aptamer recognition site. The obtained value (67.4 nM) had an approximately 2-fold increase in comparison with that of the aptamer alone. In order to further confirm the binding specificity of the probe, flow cytometric analysis was carried out. The results showed that the probe had a relatively strong binding capacity to HER2-positive breast cancer cells (BT474 and SK-BR-3) but a weak binding affinity for HER2-negative breast cancer cells (MDA-MB-231 and MCF-7) (Fig. 2D). Correspondingly, the addition of HB5 to the peptide sequence with an o-nitrobenzyl photolinker also did not have a significant impact on the photolysis efficiency (99.8%), which was close to that of the unconjugated sequence.
Optimization of the labeling conditions of the photocleavable peptide-tagged mass probe
To achieve efficient labeling, the probe incubation time and photolysis time were then examined and optimized. First, the cells were incubated with the probe with increasing incubation time ranging from 15 min to 210 min. As shown in Fig. 2E, the amount of bound probes increased from the beginning and reached a maximum at approximately 2 h. Therefore, an incubation time of 2 h was used in the following experiments. Subsequently, the effect of irradiation time was studied in the range of 20 min to 120 min. The results indicated that the peptide release was initially rapid and reached a plateau at ∼100 min (Fig. 2E). Thus, a photolysis time of 100 min was selected in this work to guarantee complete photolysis. Following these optimized conditions, the overall assay time was only ∼1/10 that of conventional enzymatic assays.HER2 mapping by fluorescence imaging and mass spectrometric quantification
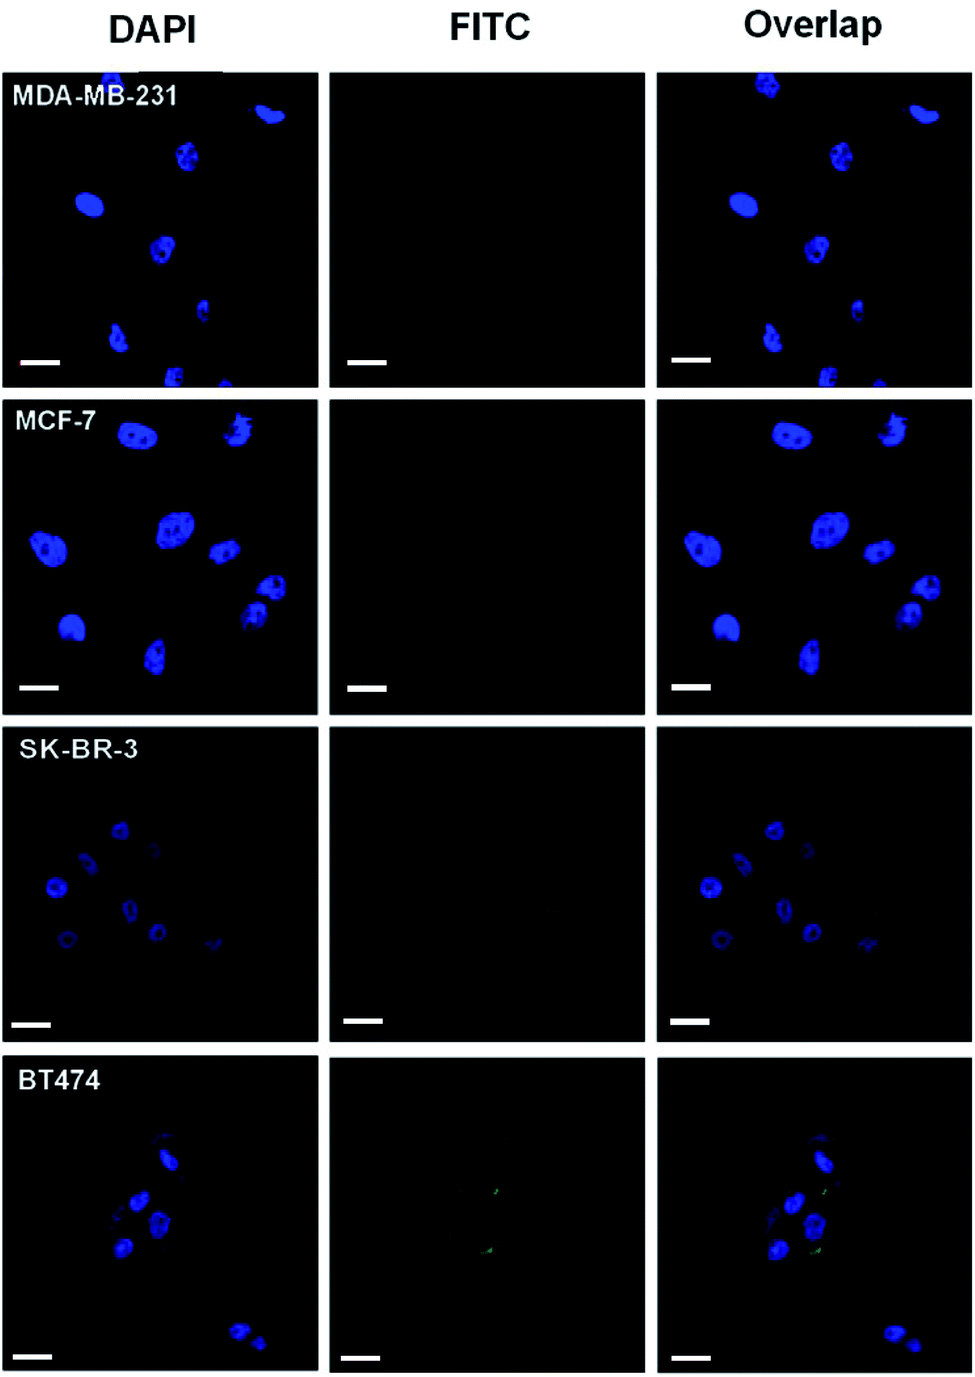 | ||
| Fig. 3 Fluorescence images of cells treated with the probe HB5-FITC-PL-Peptide, including the HER2-positive breast cancer cells BT474 and SK-BR-3 and HER2-negative breast cancer cells MDA-MB-231 and MCF-7. First, enzyme-free cell dissociation buffer was used in cell collection to prevent damage to surface proteins. Before incubation with the probe, the cells were blocked by treatment with binding buffer. The cells were first stained with DAPI. After washing with PBS, the probe was incubated with the cell suspension with gentle shaking. Finally, the cells were washed with PBS and NH4HCO3 to remove the unbound probe. A greater fluorescence signal was observed for HER2-positive cells. Blue fluorescence represents the nucleus and green fluorescence represents the HER2 protein. The images were taken under a 40× objective and at a resolution of 1024 × 1024 with confocal microscopy. Scale bar: 20 μm. | ||
Furthermore, fluorescence imaging of tissue in situ was accomplished. Forty-two matched pairs of breast tissue sections were involved. These tissue sections were tested by IHC in advance. Among them, 14 (33.3%), 13 (31.0%), 8 (19.1%) and 7 (16.7%) cases were scored as HER2 0, 1+, 2+ and 3+, respectively. The equivocal cases (HER2 2+) were further subjected to FISH analysis, and 5 cases were positive and 3 cases were negative. All of the analyses followed the 2018 ASCO/CAP updated guideline.6 In this study, both the IHC and fluorescence images of the representative tissue samples are shown in Fig. 4. The green fluorescence signal increased with an increase in the IHC score of HER2. In the plot of FITC fluorescence vs. DAPI fluorescence (Fig. 5A), the clusters of HER2 IHC subgroups can be easily discerned. The greater the slope, the higher the HER2 IHC score. Moreover, the distribution and localization of fluorescence were in good agreement with the dark brown color of IHC. The ratio of fluorescence intensity to dark brown staining intensity was consistent across the samples (Fig. 5B), demonstrating that fluorescence detection can be a reliable alternative to IHC.
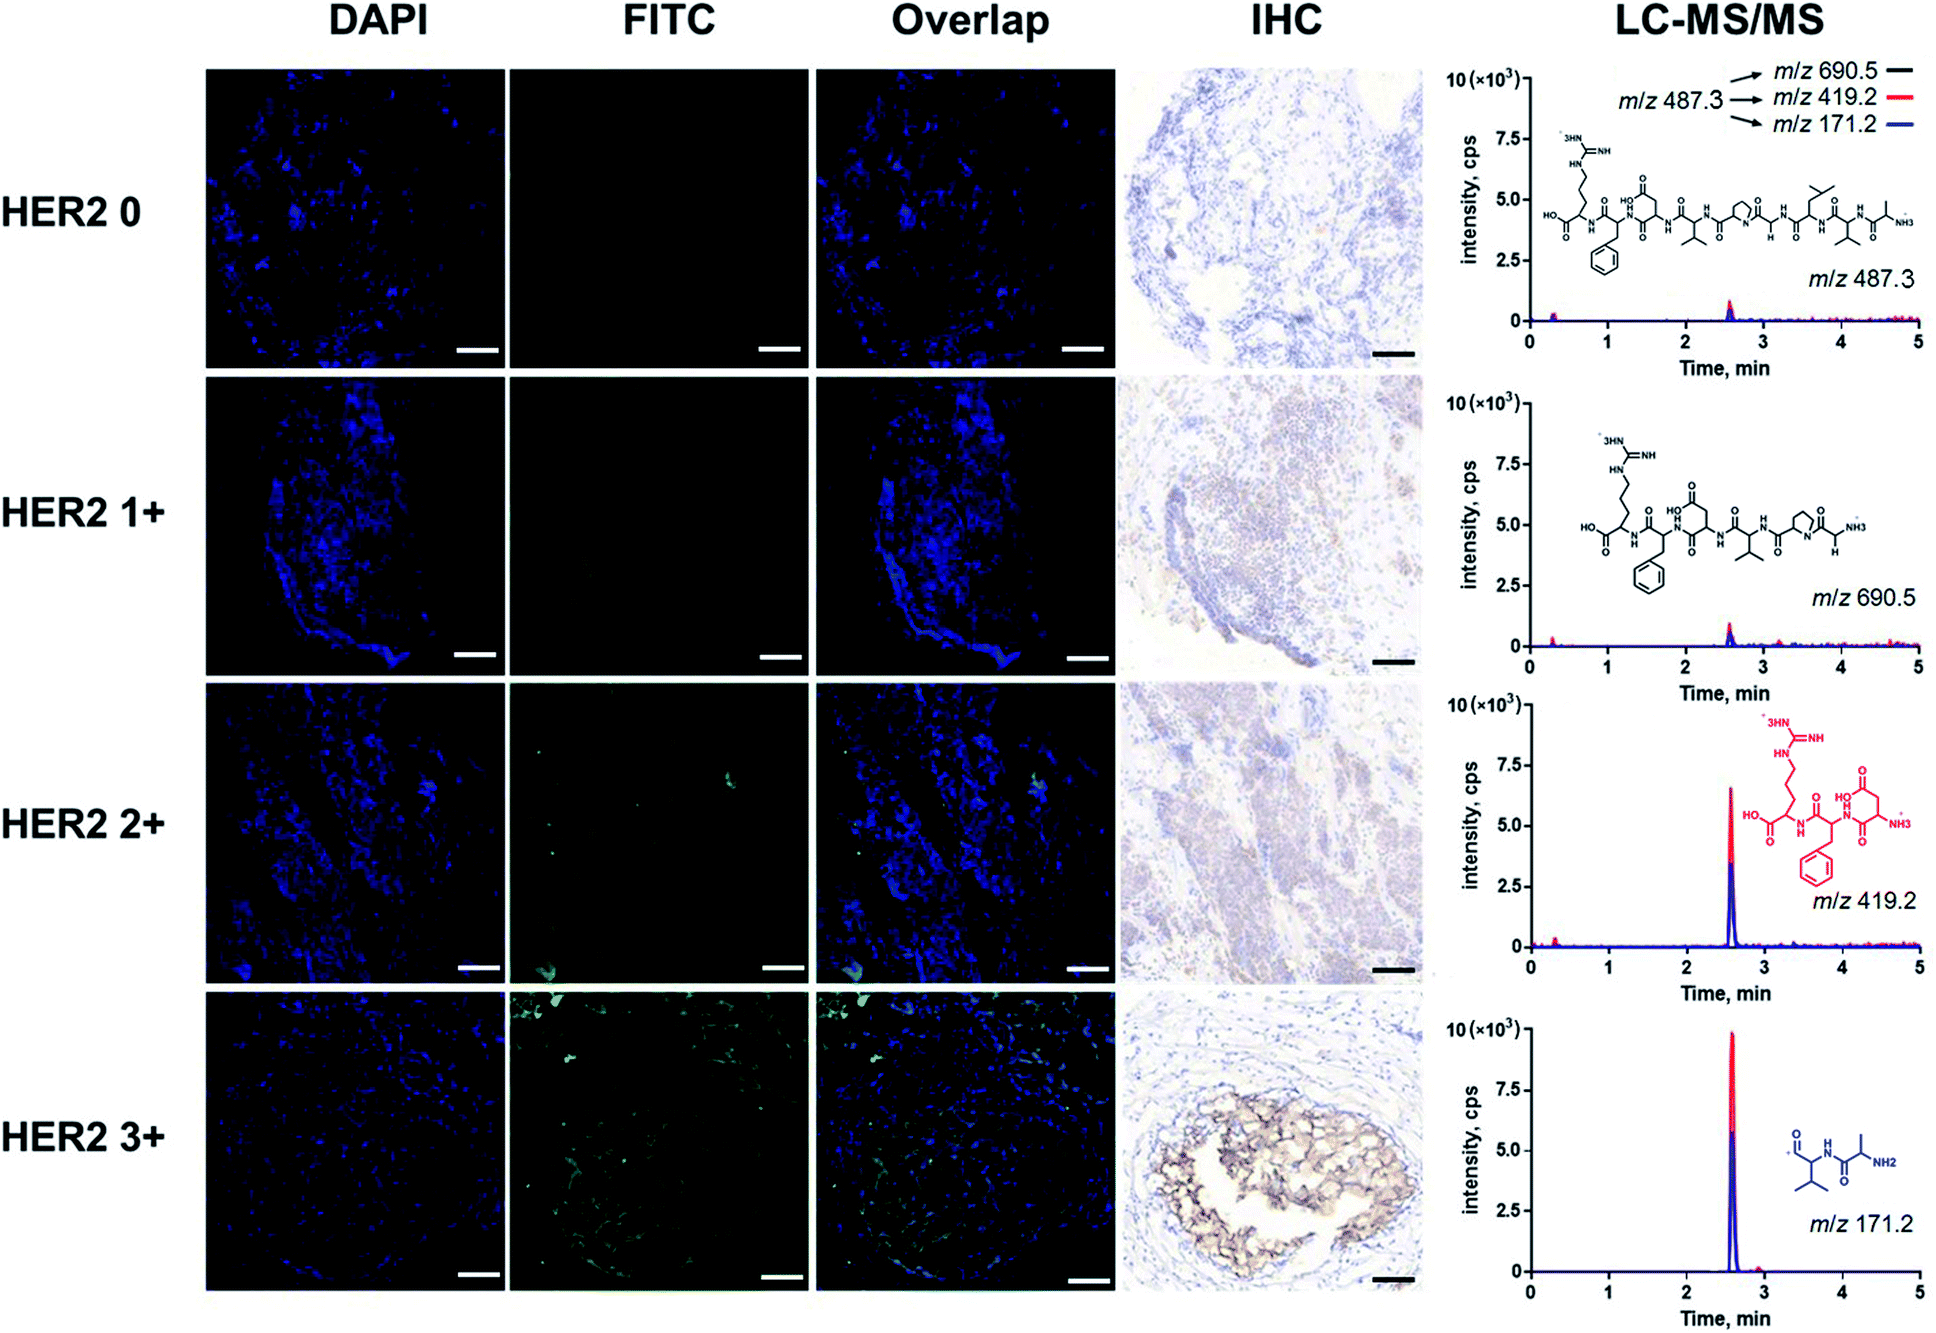 | ||
| Fig. 4 Fluorescence images, IHC images and the corresponding LC-MS/MS chromatograms of representative breast tumors classified as HER2 0, HER2 1+, HER2 2+ and HER2 3+. We selected four breast tumors with different scores identified by clinical pathologists and cut them into tissue sections. The tissues were first stained with DAPI. After washing the sample with PBS, the probe was added, and the mixture was incubated. Finally, the tissues were washed with PBS and NH4HCO3 to remove the excess probe. Fluorescence images were obtained immediately after incubation to avoid quenching. The blue fluorescence and green fluorescence represent the nucleus and the HER2 protein, respectively. These fluorescence signals also correspond to the blue and dark brown staining in IHC images. In order to confirm the consistency between the fluorescence images and traditional IHC images, we used adjacent tissue sections for both fluorescence imaging and IHC analysis. As a result, there was no significant difference between the fluorescence and IHC images. After fluorescence imaging, we performed mass spectrometric quantification of the HER2 protein. The peak area of the LC-MS/MS chromatogram represents the amount of protein expression, which was also in agreement with the score grade of tumors. The fluorescence images were taken under a 10× objective at a resolution of 1024 × 1024 by confocal microscopy. Scale bar for fluorescence image: 100 μm, scale bar for IHC: 100 μm. Three product ions m/z 171.2, m/z 419.2 and m/z 690.5 generated from the double charged precursor ion m/z 487.3 were used for quantification. The corresponding ion structures and MRM transitions were listed. | ||
 | ||
| Fig. 5 Correlations between (A) FITC fluorescence of the probe vs. DAPI fluorescence and (B) FITC fluorescence intensity vs. dark brown staining intensity in IHC of breast tumors. We collected 42 breast tumors with different scores, including 7 tumors with a score of 3+, 8 tumors with a score of 2+, 13 tumors with a score of 1+, and 14 tumors with a score of 0. The FITC fluorescence intensity increased with the scores. The clusters of HER2 IHC subgroups can be easily discerned. Then, we selected 20 breast tumors (5 tumors with each score) to confirm the consistency of fluorescence staining and IHC staining. Additionally, both the fluorescence intensity and IHC chromogenic intensity increased with increasing score. In addition, the levels of fluorescence were in good agreement with those of dark brown staining. | ||
Then, we quantified HER2 in the above tissue samples (Fig. 6). A Mann–Whitney test showed a significant difference between IHC subgroups. In particular, the HER2 expression level of the IHC 2+/FISH− group was different from that of the IHC 2+/FISH+ group (P = 0.014). However, there was no significant difference between the IHC 2+/FISH+ group and the IHC 3+ group. This result implied that the HER2 mapping approach here has similar accuracy to the combination of IHC and FISH in the determination of HER2 positivity. Finally, the HER2 reference interval was calculated to be 3.52 (90% CI, 1.31–5.74) nmol m−2 to 19.9 (90% CI, 17.7–22.2) nmol m−2 using MedCalc® software (version 12.6.3) and the data from normal tissue samples. Thus, there were 14 (IHC 0, 100%), 13 (IHC +, 100%), and 3 (IHC 2+/FISH−, 60%) tumor samples having HER2 concentrations below the estimated upper limit. The other samples, including 2 (IHC 2+/FISH−), 3 (IHC 2+/FISH+), and 7 (IHC 3+), could be defined as HER2 overexpression. This result was highly consistent with that of IHC with respect to FISH (κ = 0.877). Notably, the disagreement between IHC & FISH analysis and our integrated assay in equivocal cases could result from various factors. In addition to the issues owned by IHC and FISH analysis, our assay can provide the quantitative information of HER2 in a more accurate manner, which may eventually improve clinical decision making in equivocal cases. The results indicated that the photocleavable peptide-tagged mass probe-based HER2 mapping approach may be used instead of IHC and FISH after comprehensive validation for clinical use in the future.
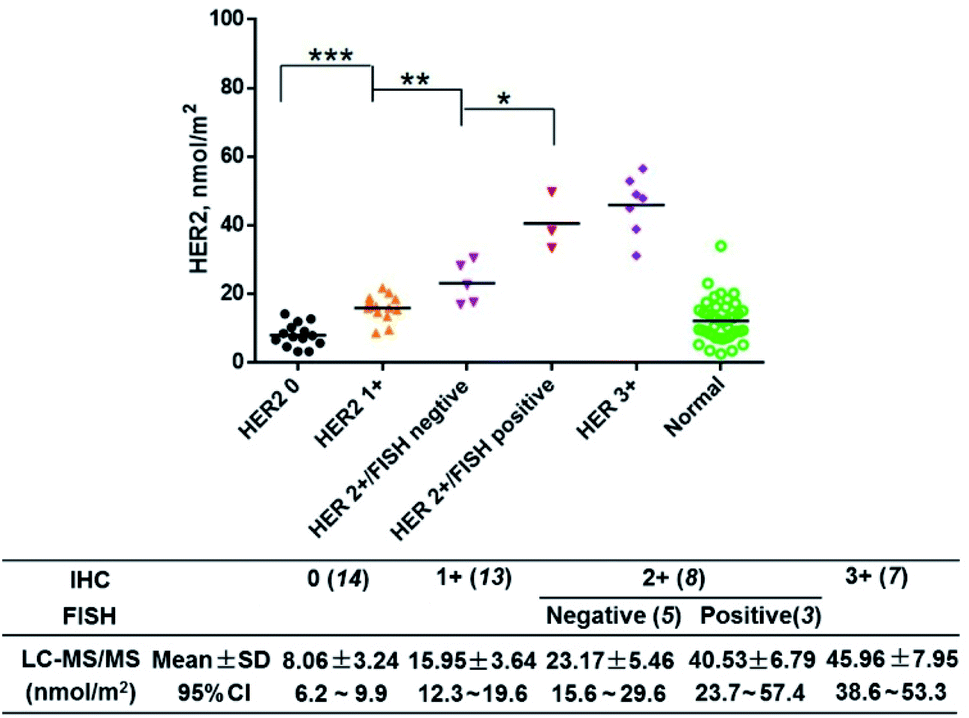 | ||
| Fig. 6 HER2 expression levels in 42 matched pairs of breast tissue samples. IHC testing gave a score of HER2 0 to 3+ for each sample, and these scoring groups had 14, 13, 8 and 7 samples (numbers in brackets), respectively. Among the HER2 2+ group, FISH was positive in 3 cases and negative in 5 cases. A Mann–Whitney test showed significant differences among the IHC subgroups. In particular, the HER2 expression level of the IHC 2+/FISH− group was different from that of the IHC 2+/FISH+ group (P = 0.014). However, there was no significant difference between the IHC 2+/FISH+ group and the IHC 3+ group. The table lists the expression levels of HER2 in each HER2 group. The mean (±standard deviation (SD)) and the 95% confidence interval (CI) of each group were also provided. The samples were classified according to the 2018 ASCO/CAP updated guideline. *P < 0.05, **P < 0.01, ***P < 0.001. | ||
Conclusions
In this paper, we developed an integrated assay for HER2 protein mapping using a photocleavable peptide-tagged mass probe functionalized with imaging and quantification tags. In addition to FITC serving as a fluorescence label for HER2 imaging, a rapid photolysis system was designed for the release of the quantitative reporter peptide for mass spectrometric quantification. The simple and novel design of the peptide-tagged mass probe made use of the virtues of each detection technology and provided more comprehensive and complementary chemical mapping information on the target protein. In this way, qualitative imaging and quantitative mass spectrometry detection can be bridged, and the accuracy of clinical target testing can be improved. This accuracy improvement may be essential to reduce the number of false positives and false negatives in laboratory testing and ultimately enhance the clinical management of cancer patients.Experimental section
Synthesis of the HB5-FITC-PL-Peptide probe
The procedure for the preparation of the HB5-FITC-PL-Peptide probe was analogous to the description of other probes, which have been reported in our previous studies.19,20 First, reduction of the disulfide at the 5′ end of the synthetic aptamer HB5 was needed before conjugation. In brief, tris(2-carboxyethyl)-phosphine (TCEP) was selected to reduce the disulfide, and 100 μL of 10 μM disulfide-modified HB5 was mixed with 50 μL of TCEP reducing beads (Thermo Fisher Scientific, Chicago, IL, USA) under powerful shaking at 37 °C for 2 h. Then, the mixture was centrifuged at a speed of 1000 × g for 5 min. Subsequently, an equal volume of 100 μM FITC-PL-Peptide modified with maleimide was added to the supernatant to react with the reduced HB5. After adding ammonium hydroxide as the catalyst, the Michael addition reaction was conducted at 37 °C for 4 h with vigorous shaking. The whole process was performed in the dark. After the reaction was complete, we purified the HB5-FITC-PL-Peptide probe to avoid interference from excess nonconjugated peptides and reduced HB5 by immediately using semi-preparative high-performance liquid chromatography (HPLC). Finally, we confirmed the purity of the collected product by HPLC and quantified the concentration of the product by its external calibration peak area.Characterization of the HB5-FITC-PL-Peptide probe
The detailed experimental procedures and methods to characterize the newly prepared probe are provided in the ESI,† including its conjugation efficiency, binding affinity and specificity between the probe and HER2 and the efficiency of photolysis release.Loading the HB5-FITC-PL-Peptide into cells and tissue samples
Four cell lines, SK-BR-3, MDA-MB-231, BT474 and MCF-7 (approximately 1 × 10⁵ cells each), were seeded onto slides (24 × 24 mm, Corning) after digestion. Enzyme-free cell dissociation buffer was used to collect cells to avoid damage to membrane proteins such as HER2. Then, the cells were cultured at 37 °C with 5% CO2 for 24–48 h under a humidified atmosphere. After washing three times with PBS, the cells were immobilized by using 4% paraformaldehyde. Next, the cells were blocked by incubation with 200 μL of binding buffer at 37 °C for 30 min with gentle shaking. Then, we added the prepared HB5-FITC-PL-Peptide probe at a concentration of 200 nM to the slides and reacted with cells for 2 h. Finally, the samples were washed three times with PBS and another two times with 50 mM NH4HCO3 to remove the unbound probe.Tissue samples were processed similarly to the cells. First, 200 μL of binding buffer was added followed by incubation with tissues at 37 °C for 1 h. Then, the tissues were washed three times with PBS. Next, 200 μL of 200 nM probe was added and incubated at 37 °C for 2 h. The washing procedure to remove the excess unbound probe from the tissues was consistent with the procedure for the cells.
Photolysis of the probe and release of the reporter peptide
The probe-bound samples were placed under a UV light source at a distance of 20 cm to release the reporter peptide. The UV spot light source (Photocure 200, Hamamatsu Photonics, Hamamatsu, Japan) was equipped with a condenser lens and a 362 ± 30 nm bandpass filter to obtain homogeneous irradiation. The time of photolysis was optimized. Subsequently, we added 10 μL of internal standard solution (200 pM) to the supernatant, which was collected after the sample was exposed to UV light. Then, the mixture was added to a MicroSpin C18 column (The Nest Group, Inc., MA, USA). The column was pretreated by applying 100 μL of ACN and 100 μL of water prior to sample loading. To isolate the reporter peptide efficiently, we washed the column with 100 μL of 5% ACN containing 0.1% TFA and eluted the reporter peptide with 100 μL of 80% ACN containing 0.1% FA.Confocal microscopy and LC-MS/MS
The cells and tissue samples were stained with 10 μg mL−1 DAPI for 5 min in the dark. After washing three times with PBS, the samples were incubated with HB5-FITC-PL-Peptide for 2 h. Then, we immediately performed fluorescence imaging to avoid fluorescence quenching, followed by mass spectrometry analysis. The excitation wavelength and emission wavelength of the FITC channel were 488 nm and 520 nm, respectively, and the excitation wavelength and emission wavelength of the DAPI channel were 358 nm and 460 nm, respectively. The images were obtained by using a Zeiss LSM 800 confocal microscope and were analyzed using relevant confocal microscopy software (ZEN 2012).We used an Agilent SB C18 (2.7 μm, 30 mm × 2.1 mm, Agilent, USA) to achieve the liquid chromatography separation with an injection volume of 5 μL. Solvent A (0.1% FA in water) and solvent B (ACN) jointly composed the mobile phase with a flow rate of 0.3 mL min−1. The linear gradient of the mobile phase was set to the following program: B 10% (0 min) → 10% (1 min) → 90% (4 min) → 90% (8 min) → 10% (9 min) → stop (10 min).
An Agilent Series 1290 UPLC system (Waldbronn, Germany) combined with an Agilent 6460 Triple Quad LC-MS mass spectrometer (Santa Clara, USA) was applied to analysis. The reporter peptide was ionized by the electrospray ion source and was analysed in positive MRM mode. Q1 and Q3 modes were detected on the basis of unit resolution. The drying gas flowed at a flow rate of 10 L min−1 and its temperature was 350 °C. The nebulizer pressure was optimized to 35 psi. After optimization, the nebulizer pressure was set as 35 psi, and the voltage of the electrospray capillary was set as 4000 V. Data generated by the mass spectrometer were analysed by using relevant software named Agilent MassHunter Workstation Software (version B.06.00).
Ethical approval
This study was approved by the Institutional Review Board of Nanjing Medical University, Nanjing, China.Conflicts of interest
The authors declare no competing financial interests.Acknowledgements
National Natural Science Foundation of China (21722504, 21675089, 21605086), SEU-NJMU Cooperation Project (2242017K3DN12), SEU-NJMU-CPU Cooperation Project (2242019K3DNZ2), Primary Research & Development Plan of Jiangsu Province (BE2018725), Science and Technology Development Fund of NJMU (NMUD2019009), Open Foundation of State Key Laboratory of Reproductive Medicine (SKLRM-GA201804), Natural Science Fund Project of Colleges in Jiangsu Province (16KJB150028) and Fundamental Research Funds for the Central Universities (2042019kf0129) are gratefully acknowledged.References
- C. Gutierrez and R. Schiff, Arch. Pathol. Lab. Med., 2011, 135, 55–62 Search PubMed.
- FDA-NIH Biomarker Working Group, BEST (biomarkers, Endpoints, and other tools) Resource, Food and Drug Administration (US), Silver Spring (MD), 2016, accessed August 10, 2020, http://www.ncbi.nlm.nih.gov/books/NBK326791/ Search PubMed.
- D. Wong, J. Lim and W. Ang, Chem. Sci., 2015, 6, 3051–3056 RSC.
- Y. Tang, Z. Wang, X. Yang, J. Chen, L. Liu, W. Zhao, X. C. Le and F. Li, Chem. Sci., 2015, 6, 5729–5733 RSC.
- Y. Chen, L. Liu, R. Ni and W. Zhou, Adv. Clin. Chem., 2019, 91, 123–162 CAS.
- A. C. Wolff, M. E. H. Hammond, K. H. Allison, B. E. Harvey, P. B. Mangu, J. M. Bartlett, M. Bilous, I. O. Ellis, P. Fitzgibbons and W. Hanna, Arch. Pathol. Lab. Med., 2018, 142, 1364–1382 CrossRef.
- D. G. Hicks and R. R. Tubbs, Hum. Pathol., 2005, 36, 250–261 CrossRef CAS.
- X. Wu, Z. Zhao, H. Bai, T. Fu, C. Yang, X. Hu, Q. Liu, C. Champanhac, I. T. Teng and M. Ye, Theranostics, 2015, 5, 985–994 CrossRef CAS.
- A. M. Waters, I. Ozkan-Dagliyan, A. V. Vaseva, N. Fer, L. A. Strathern, G. A. Hobbs, B. Tessier-Cloutier, W. K. Gillette, R. Bagni and G. R. Whiteley, et al. , Sci. Signaling, 2017, 10, eaao3332 CrossRef.
- J. Laudadio, D. I. Quigley, R. Tubbs and D. J. Wolff, Expert Rev. Mol. Diagn., 2007, 7, 53–64 CrossRef CAS.
- D. Furrer, F. Sanschagrin, S. Jacob and C. Diorio, Am. J. Clin. Pathol., 2015, 144, 686–703 CrossRef CAS.
- B. Zhang, J. R. Whiteaker, A. N. Hoofnagle, G. S. Baird, K. D. Rodland and A. G. Paulovich, Nat. Rev. Clin. Oncol., 2019, 16, 256–268 CrossRef.
- V. Martin, A. Valera, M. De Joffrey, S. Banfi and L. Mazzucchelli, Arch. Pathol. Lab. Med., 2019, 143, 411–412 CrossRef.
- M. C. Lynch, J. H. Lee and D. A. Mankoff, Diagnostic Applications of Nuclear Medicine: Breast Cancer, 2016 Search PubMed.
- M. Bantscheff, S. Lemeer, M. M. Savitski and B. Kuster, Anal. Bioanal. Chem., 2012, 404, 939–965 CrossRef CAS.
- U. Kusebauch, D. S. Campbell, E. W. Deutsch, C. S. Chu, D. A. Spicer, M. Y. Brusniak, J. Slagel, Z. Sun, J. Stevens and B. Grimes, et al. , Cell, 2016, 166, 766–778 CrossRef CAS.
- A. Doerr, Nat. Methods, 2011, 8, 202 CrossRef.
- J. T. Lathrop, D. A. Jeffery, Y. R. Shea, P. F. Scholl and M. M. Chan, Clin. Chem., 2016, 62, 41–47 CrossRef CAS.
- T. M. Annesley, R. G. Cooks, D. A. Herold and A. N. Hootnagle, Clin. Chem., 2016, 62, 1–3 CrossRef CAS.
- W. Zhou, F. Xu, D. Li and Y. Chen, Clin. Chem., 2018, 64, 526–535 CrossRef CAS.
- F. Xu, T. Yang and Y. Chen, Anal. Chem., 2016, 88, 754–763 CrossRef CAS.
- L. Liu, Q. Xu, S. Hao and Y. Chen, Sci. Rep., 2017, 7, 1–12 CrossRef.
- M. You, Y. Chen, L. Peng, D. Han, B. Yin, B. Ye and W. Tan, Chem. Sci., 2011, 2, 1003–1010 RSC.
- F. Tolle and G. Mayer, Chem. Sci., 2013, 4, 60–67 RSC.
- E. A. Perez, J. Cortés, A. M. Gonzalez-Angulo and J. M. Bartlett, Cancer Treat. Rev., 2014, 40, 276–284 CrossRef CAS.
- H. K. Hustoft, H. Malerod, S. R. Wilson, L. Reubsaet, E. Lundanes and T. Greibrokk, Integr. Proteomics, 2012, 1, 73–92 Search PubMed.
- J. L. Proc, M. A. Kuzyk, D. B. Hardie, J. Yang, D. S. Smith, A. M. Jackson, C. E. Parker and C. H. Borchers, J. Proteome Res., 2010, 9, 5422–5437 CrossRef CAS.
- C. Liu, Z. Zhao, J. Fan, C. J. Lyon and Y. Hu, Proc. Natl. Acad. Sci. U. S. A., 2017, 114, 3969–3974 CrossRef CAS.
- R. S. Rock and S. I. Chan, J. Org. Chem., 1996, 61, 1526–1529 CrossRef CAS.
- E. R. Ruskowitz and C. A. DeForest, Nat. Rev. Mater., 2018, 3, 1–17 CrossRef.
- X. Fang, Y. Zheng, Y. Duan, Y. Liu and W. Zhong, Anal. Chem., 2019, 91, 482–504 CrossRef CAS.
- U. Seitzer, E. Endl, J. Gerdes and C. Hollmann, Methods Microbiol., 2002, 32, 751–765 CAS.
- Z. Liu, J. H. Duan, Y. M. Song, J. Ma, F. D. Wang, X. Lu and X. D. Yang, J. Transl. Med., 2012, 10, 148 CrossRef CAS.
- M. Chu, J. Kang, W. Wang, H. Li, J. Feng, Z. Chu, M. Zhang, L. Xu and Y. Wang, Cell. Mol. Immunol., 2017, 14, 398–400 CrossRef.
- Y. Lin, M. Mazo, S. Skaalure, M. Thomas, S. Schultz and M. Stevens, Chem. Sci., 2019, 10, 1158–1167 RSC.
- T. Solomek, S. Mercier, T. Bally and C. G. Bochet, Photochem. Photobiol. Sci., 2012, 11, 548–555 RSC.
- M. Rinnová, M. Nováková, V. Kašička and J. Jiráček, J. Pept. Sci., 2000, 6, 355–365 CrossRef.
- M. S. Gonçalves, Chem. Rev., 2009, 109, 190–212 CrossRef.
- F. Tolle and G. Mayer, Chem. Sci., 2013, 4, 60–67 RSC.
- R. Wang, D. Lu, H. Bai, C. Jin, G. Yan, M. Ye, L. Qiu, R. Chang, C. Cui, H. Liang and W. Tan, Chem. Sci., 2016, 7, 2157–2161 RSC.
- K. Chughtai, L. Jiang, H. Post, P. T. Winnard, T. R. Greenwood, V. Raman, Z. M. Bhujwalla, R. M. A. Heeren and K. Glunde, J. Am. Soc. Mass Spectrom., 2013, 24, 711–717 CrossRef CAS.
- R. M. Schoenherr, J. R. Whiteaker, L. Zhao, R. G. Ivey, M. Trute, J. Kennedy, U. J. Voytovich, P. Yan, C. Lin and A. G. Paulovich, Proteomics, 2012, 12, 1253–1260 CrossRef CAS.
- A. Aubé, S. Campbell, A. R. Schmitzer, A. Claing and J.-F. Masson, Analyst, 2017, 142, 2343–2353 RSC.
Footnotes |
| † Electronic supplementary information (ESI) available. See DOI: 10.1039/d0sc04481d |
| ‡ These authors contributed equally to this work. |
| This journal is © The Royal Society of Chemistry 2020 |