 Open Access Article
Quantum-mechanical transition-state model combined with machine learning provides catalyst design features for selective Cr olefin oligomerization†
Steven M.
Maley‡
 a,
Doo-Hyun
Kwon‡
 a,
Nick
Rollins
a,
Johnathan C.
Stanley
a,
Orson L.
Sydora
a,
Nick
Rollins
a,
Johnathan C.
Stanley
a,
Orson L.
Sydora
 b,
Steven M.
Bischof
 *b and
Daniel H.
Ess
 *a
*a
aDepartment of Chemistry and Biochemistry, Brigham Young University, Provo, Utah 84602, USA. E-mail: dhe@chem.byu.edu
bResearch and Technology, Chevron Phillips Chemical Company LP, 1862, Kingwood Drive, Kingwood, Texas 77339, USA. E-mail: bischs@cpchem.com
First published on 21st August 2020
Abstract
The use of data science tools to provide the emergence of non-trivial chemical features for catalyst design is an important goal in catalysis science. Additionally, there is currently no general strategy for computational homogeneous, molecular catalyst design. Here, we report the unique combination of an experimentally verified DFT-transition-state model with a random forest machine learning model in a campaign to design new molecular Cr phosphine imine (Cr(P,N)) catalysts for selective ethylene oligomerization, specifically to increase 1-octene selectivity. This involved the calculation of 1-hexene![[thin space (1/6-em)]](https://www.rsc.org/images/entities/char_2009.gif) :
:![[thin space (1/6-em)]](https://www.rsc.org/images/entities/char_2009.gif) 1-octene transition-state selectivity for 105 (P,N) ligands and the harvesting of 14 descriptors, which were then used to build a random forest regression model. This model showed the emergence of several key design features, such as Cr–N distance, Cr–α distance, and Cr distance out of pocket, which were then used to rapidly design a new generation of Cr(P,N) catalyst ligands that are predicted to give >95% selectivity for 1-octene.
1-octene transition-state selectivity for 105 (P,N) ligands and the harvesting of 14 descriptors, which were then used to build a random forest regression model. This model showed the emergence of several key design features, such as Cr–N distance, Cr–α distance, and Cr distance out of pocket, which were then used to rapidly design a new generation of Cr(P,N) catalyst ligands that are predicted to give >95% selectivity for 1-octene.
Introduction
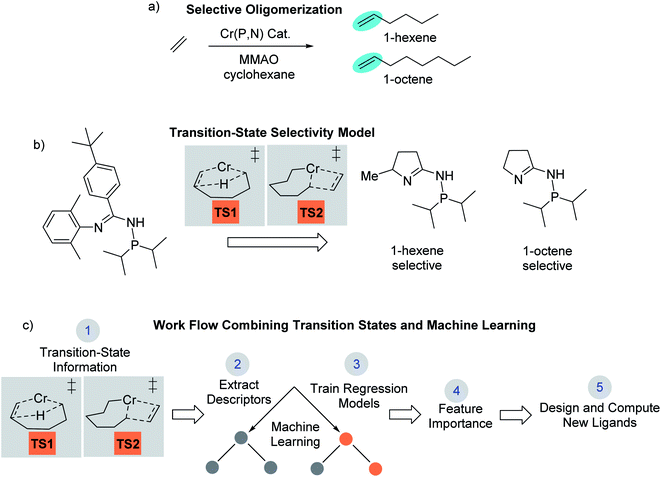
Computational chemistry now plays an active role in molecular catalyst design and optimization by either testing chemical hypotheses or directly evaluating catalyst candidates.1 However, no general strategy for virtual catalyst design or optimization has emerged,2–14 and there are only a few cases of specific catalyst prediction followed by experimental realization.15–20 Due to the complex electronic structure of metal centers and ligands, one strategy for computational, homogeneous, molecular catalyst design is to use quantum-mechanical methods to model transition states.21–27 While quantum-mechanical transition states can often replicate experiment and be used for catalyst prediction, it is not always straightforward to identify simple chemical features that control catalysis,28,29 especially for selectivity where small energy quantities can impart significant influence. In this type of scenario, a catalyst design workflow that combines quantum-mechanical transition state modeling with machine learning has the potential to reveal critical catalyst design features not readily identified through other means.We recently reported the development and use of a density functional theory (DFT) transition-state model that provided quantitative prediction of molecular Cr catalysts for controllable selective ethylene trimerization and tetramerization (Scheme 1).30 This selective catalyst design effort is important because the ubiquity of polyethylene resulting from robust Phillips31 and Ziegler–Natta catalysts32,33 has led to an increase in global need for linear α-olefin (LAO) polymerization comonomers.34 Additionally, these short-chain LAOs, specifically 1-hexene and 1-octene, are used in the manufacture of plasticizers, lubricants, detergents, and plastomers/elastomers. Prior to our work, Sydora and co-workers reported a series of aryl and benzyl substituted phosphine imine (P,N) catalysts that experimentally produced ∼30% 1-octene.35 In our computational catalyst design effort, we used the cationic high-spin transition-states TS1 and TS2 shown in Scheme 1b to develop a linear correlation model between DFT computed values and experimental 1-hexene![[thin space (1/6-em)]](https://www.rsc.org/images/entities/char_2009.gif) :
:![[thin space (1/6-em)]](https://www.rsc.org/images/entities/char_2009.gif) 1-octene ratios (see later Scheme 2 for complete catalytic cycle). This allowed using transition-state calculations to computationally design a new general class of phosphine monocyclic imine Cr(P,N) catalysts where changes in the ligand structure control 1-hexene versus 1-octene selectivity (Scheme 1b). Experimental ligand and catalyst synthesis, and reaction testing, quantitatively confirmed our transition-state predictions.
1-octene ratios (see later Scheme 2 for complete catalytic cycle). This allowed using transition-state calculations to computationally design a new general class of phosphine monocyclic imine Cr(P,N) catalysts where changes in the ligand structure control 1-hexene versus 1-octene selectivity (Scheme 1b). Experimental ligand and catalyst synthesis, and reaction testing, quantitatively confirmed our transition-state predictions.
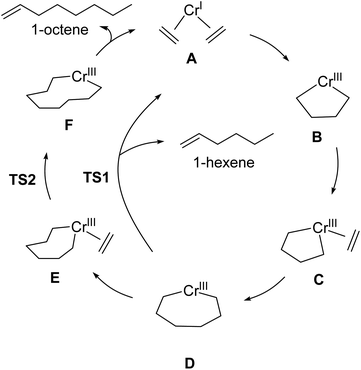 | ||
| Scheme 2 Outline of Cr-catalyzed metallacycle mechanism for selective ethylene oligomerization to 1-hexene and 1-octene. | ||
While our DFT transition-state model is practical, accurate, and successfully identified new ligands that were experimentally validated, it did not offer general or specific catalyst design guidance to further enhance 1-octene selectivity. Moreover, the interpretation of singular controlling transition-state features is unobvious since the energy difference between 1-hexene and 1-octene selectivity is relatively small. Therefore, we decided to combine our transition-state model with data science methods that can potentially provide the emergence of chemical features to enhance 1-octene selectivity. While machine learning and related multi-dimensional methods are beginning to be used for molecular catalyst design,36 there are currently no examples of an experimentally verified quantum-mechanical transition state model merged with machine learning methods for catalyst selectivity. Contemporary to our work, Balcells and Azpuru-Guzik very recently reported combining machine learning and transition states for analysis of stoichiometric H2 oxidative addition reactivity by Vaska-type complexes.37 Currently, our work reported here and the work of Balcells and Azpuru-Guzik represent the only reports of uniquely combining transition states and machine learning. Generally, data science approaches to molecular catalyst design emphasize ground-state properties of either pre-catalysts or ligands without metal centers. For example, Fey and Pringle developed databases of ground-state ligand properties38–43 that enabled the prediction and experimental verification of new fluorophosphine ligands for hydroformylation and hydrocyanation.44 Recently, Denmark reported a workflow where a subset of a library of synthetically accessible catalysts are selected and tested. The data obtained was then used to train statistical learning models to optimize a chiral catalyst for thiol addition to N-acylimines.45 Machine learning methods have also been used to predict reaction barrier heights in heterogeneous catalyst applications.46–48
Outlined in Scheme 1c, our approach reported here involves using DFT-computed transition-state features and selectivities for machine learning analysis. The analysis of >100 Cr(P,N) catalysts and 14 molecular descriptors through machine learning regression algorithms with multifold cross validation resulted in a low root mean square error (RMSE) and emergence of three critical design elements to enhance 1-octene selectivity. The utility of these machine-learning identified selectivity features was demonstrated by the design and calculation of several new ligands that are predicted to give >90% 1-octene selectivity.
Results and discussion
Companies such as Shell, Ineos, Idemitsu, SABIC, and Chevron Phillips Chemical Company LP (Chevron Phillips Chemical) use metal-catalyzed ethylene oligomerization to produce a wide distribution of LAOs from 1-butene to 1-eicosene (C20).49 Chevron Phillips Chemical was the first to commercialize a selective ethylene trimerization to 1-hexene system using Cr(III) 2-ethylhexanoate along with 2,5-dimethylpyrrole and aluminum co-activators.50 Sasol later developed selective ethylene oligomerization technology that produces both 1-hexene and 1-octene using a Cr-diphosphinoamine catalyst.51 However, an important and major unsolved challenge is to develop a general set of molecular catalysts and catalyst design principles that result in highly selective ethylene tetramerization to 1-octene.As discussed in the introduction, in our recent computational campaign, we developed a DFT transition-state model that provided quantitative prediction of molecular Cr(P,N) catalysts (Scheme 1).30 This resulted in the computational design and experimental verification of a new general class of phosphine monocyclic imine Cr(P,N) catalysts where slightly more than 50% 1-octene was formed. Importantly, this DFT transition-state model is accurate and relatively fast to use. New ligands can be virtually screened by calculating the energies of transition-state conformation ensembles for TS1 and TS2 (Scheme 1b),52–63 which can then be used in our linear correlation model to provide a predicted 1-hexene![[thin space (1/6-em)]](https://www.rsc.org/images/entities/char_2009.gif) :
:![[thin space (1/6-em)]](https://www.rsc.org/images/entities/char_2009.gif) 1-octene ratio for given set of reaction conditions. Our transition-state selectivity model was based on our DFT mechanistic calculations, and studies by Britovsek and McGuinness, Cheon, Liu and others.52,53,56–63 Briefly, pre-catalyst activation results in a bis-ethylene CrI species A and oxidative C–C bond formation then results in chromacyclopentane B (Scheme 2). A third ethylene coordination gives C and migratory insertion leads to the chromacycloheptane intermediate D where 1-hexene and 1-octene pathways diverge. Through β-hydrogen transfer TS1 there is formation of 1-hexene and Cr catalyst reduction. The 1-octene pathway requires a fourth ethylene coordination and intermediate E followed by migratory insertion TS2 to give the chromacyclononane intermediate F that leads to 1-octene.
1-octene ratio for given set of reaction conditions. Our transition-state selectivity model was based on our DFT mechanistic calculations, and studies by Britovsek and McGuinness, Cheon, Liu and others.52,53,56–63 Briefly, pre-catalyst activation results in a bis-ethylene CrI species A and oxidative C–C bond formation then results in chromacyclopentane B (Scheme 2). A third ethylene coordination gives C and migratory insertion leads to the chromacycloheptane intermediate D where 1-hexene and 1-octene pathways diverge. Through β-hydrogen transfer TS1 there is formation of 1-hexene and Cr catalyst reduction. The 1-octene pathway requires a fourth ethylene coordination and intermediate E followed by migratory insertion TS2 to give the chromacyclononane intermediate F that leads to 1-octene.
While our DFT transition-state model is extremely useful, because it is a correlation model with small energy differences, it did not reveal general catalyst design principles that would easily lead to the design of extremely high 1-octene selectivity. Because our transition-state selectivity model is accurate, this provided a platform for combining it with machine learning data science methods that can provide the emergence of general chemical features to enhance 1-octene selectivity for Cr(P,N) catalysts. To our knowledge, there has not been a previous report of combining an experimentally verified quantum mechanical transition-state model for selectivity with machine learning analysis as a workflow to design new catalysts.
While machine learning is beginning to find significant application as a tool to aid organic synthesis,64–74 there are relatively few examples of machine learning applied to inorganic or organometallic reactions, especially heterogeneous46,75–87 and homogeneous catalysis.88,89 Kulik trained an artificial neural network to predict the high-spin to low-spin splitting energies of ∼2700 transition metal complexes.90 They also demonstrated the usage of a kernel ridge regression model for predicting spin-splitting, bond lengths, and redox potentials for a relatively large collection of transition metal complexes.91 Related, Corminbouef trained machine learning models to screen over 18![[thin space (1/6-em)]](https://www.rsc.org/images/entities/char_2009.gif) 000 potential homogeneous catalysts for the Suzuki–Miyaura C–C cross-coupling reaction.92 Sunoj used a combination of a neural network and random forest model to identify the regioselectivity of catalytic difluorination of alkenes.93 Brgoch screened over 100
000 potential homogeneous catalysts for the Suzuki–Miyaura C–C cross-coupling reaction.92 Sunoj used a combination of a neural network and random forest model to identify the regioselectivity of catalytic difluorination of alkenes.93 Brgoch screened over 100![[thin space (1/6-em)]](https://www.rsc.org/images/entities/char_2009.gif) 000 compounds using a support vector machine regression to identify novel highly compressible metal materials,94 and Buehler used convolutional neural networks to search for new composite metal materials.95 Xin used artificial neural networks to identify heterogeneous metallic catalysts for CO capture and reduction.96 Most directly related to our work, a recent and important contribution by Balcells and Azpuru-Guzik demonstrated the use of machine learning for reactivity to screen ligands of Vaska-type complexes to identify optimal ligands for H2 oxidative addition. This work showed that machine learning identified atom size and electronegativity as key features impacting H2 oxidative addition reactivity.37
000 compounds using a support vector machine regression to identify novel highly compressible metal materials,94 and Buehler used convolutional neural networks to search for new composite metal materials.95 Xin used artificial neural networks to identify heterogeneous metallic catalysts for CO capture and reduction.96 Most directly related to our work, a recent and important contribution by Balcells and Azpuru-Guzik demonstrated the use of machine learning for reactivity to screen ligands of Vaska-type complexes to identify optimal ligands for H2 oxidative addition. This work showed that machine learning identified atom size and electronegativity as key features impacting H2 oxidative addition reactivity.37
With the success of previous machine learning studies predicting spin-splitting energies and redox potentials,90,91 we were relatively confident that one or more machine learning algorithms would perform well for our workflow. Similar to our previous computational studies,30 and computational assessments by McGuinness suggesting the good performance of M06L,52,53 we used the unrestricted M06L density functional97 for describing the electronic structure of Cr(P,N) catalysts. The UM06L/Def2-TZVPP//UM06L/6-31G**[LANL2DZ] level of theory was combined with the SMD continuum model98 for cyclohexane to estimate the free energies of TS1 and TS2 (see ESI† for computational details). In this transition state model, the relative free energies of TS1 and TS2 provide selectivity under the assumption of Curtin–Hammett type conditions. All transition-state structures were optimized, and vibrational frequencies were computed to verify the stationary points as first-order saddle points. Normal rigid-rotor harmonic oscillator approximations were applied with free energies at 1 atm and 298 K. Because the transition-state model is a linear correlation scheme, no temperature or pressure corrections were applied. All DFT calculations were performed using Gaussian 09.99 Machine learning analyses were performed using scipy,100 numpy,101 pandas102 and scikit-learn103 in Python 2.7. A detailed description of the machine learning analysis along with the source code are available in the ESI.†
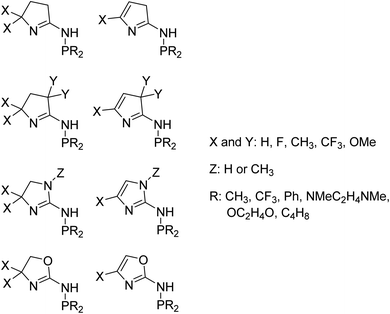
We used 105 unique (P,N) ligands in our transition-state training data set, which included 14 experimentally measured ligands. Scheme 2 outlines these (P,N) ligands, which have a variety of different functional groups, but retain the phosphine and imine, or imine-like, ligand coordination for which the DFT transition-state model was developed. A major motivation in the selection of these 105 ligands was to further optimize the five-membered imine ring system we previously designed and to stay within the bounds of predictability for our correlation model. As shown in Scheme 3, this set includes a variety of substituted heterocycles such as pyrroles, imidazoles, and oxazoles. In each of these cases we also examined their combination with alkyl, fluoroalkyl, aryl, and amido phosphines as well as phospholanes.
Fourteen atomic and molecular descriptors/features were extracted from TS1 and TS2 for each of the 105 ligands shown in Scheme 3. Described in Fig. 1, extracted features included geometric parameters such as bond lengths, angles, dihedrals, percent volume buried, and Cr metal center distance out pocket. Several electronic features were also harvested, such as electrostatic-based atomic charges. Percent volume buried describes the extent to which the first coordination sphere of the Cr metal center is occupied by a (P,N) ligand.104 The distance out of pocket describes the how far the Cr metal is situated from the (P,N) ligand.
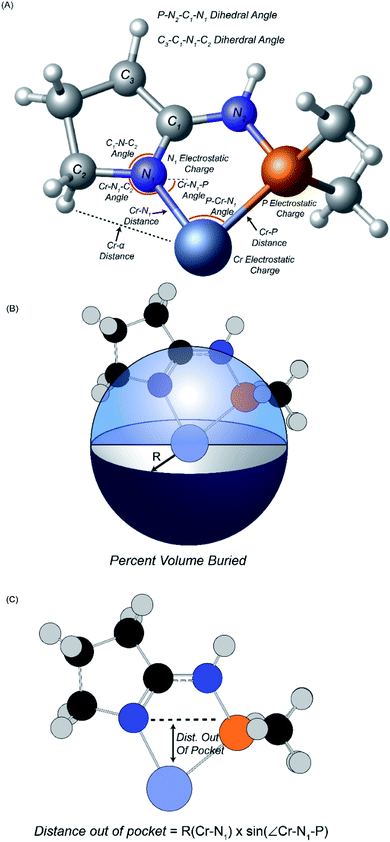 | ||
| Fig. 1 Descriptors extracted for machine learning analysis. (A) Geometric descriptors and electrostatic charges. (B) Definition of percent volume buried. (C) Definition of distance out of pocket. | ||
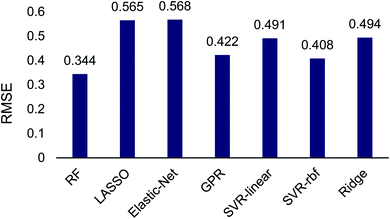
The Scikit-Learn python library was used to set up and train regressors on this transition-state data set, which was split into 25% training and 75% testing sets. Seven regression algorithms were tested including: random forest, Gaussian process regression, LASSO, elastic-net, ridge regression and support vector regression with both a linear and radial basis function kernel. Multifold cross validation was performed to protect against model overfitting common in small datasets. This random sampling was performed 10 times and 20-fold cross validation was used at each iteration to determine regression accuracy. A brief test of different amounts of random sampling and cross validation was also performed (see ESI†). The RMSE of each model determined using cross validation averaged across iterations is shown in Fig. 2.
The machine learning regression algorithms were used to evaluate the use of the 14 atomic and molecular features to quantitatively correlate with the DFT calculated energy differences between TS1 and TS2. The RMSE of the regression algorithms ranged from 0.344 to 0.568 (Fig. 2). The best performing model was random forest (RMSE = 0.344) and the poorest performing model was elastic-net (RMSE = 0.568). Unsurprisingly the LASSO and ridge algorithms, which are related to elastic-net, also performed poorly with RMSEs of 0.565 and 0.494, respectively. The performance of support vector regression improved by almost 10% when changing from a linear (RMSE = 0.491) to a radial basis function (RMSE = 0.408) kernel. Gaussian process regression performed comparable to SVR-rbf.
Related to the top performance of random forest for our correlation of 1-hexene![[thin space (1/6-em)]](https://www.rsc.org/images/entities/char_2009.gif) :
:![[thin space (1/6-em)]](https://www.rsc.org/images/entities/char_2009.gif) 1-octene ratios, Doyle reported that random forest outperformed linear models, SVR, k-nearest neighbor, and artificial neural networks at predicting yields of Pd-catalyzed Buchwald–Hartwig cross-coupling of aryl halides with 4-methylaniline.70 Also, for spin-splitting energies and bond lengths of transition metal complexes, Kulik achieved exceptionally low mean unsigned errors using random forest.91 Palmer et al. showed that random forest outperforms SVR and artificial neural networks in predicting the aqueous solubility of organic molecules.105
1-octene ratios, Doyle reported that random forest outperformed linear models, SVR, k-nearest neighbor, and artificial neural networks at predicting yields of Pd-catalyzed Buchwald–Hartwig cross-coupling of aryl halides with 4-methylaniline.70 Also, for spin-splitting energies and bond lengths of transition metal complexes, Kulik achieved exceptionally low mean unsigned errors using random forest.91 Palmer et al. showed that random forest outperforms SVR and artificial neural networks in predicting the aqueous solubility of organic molecules.105
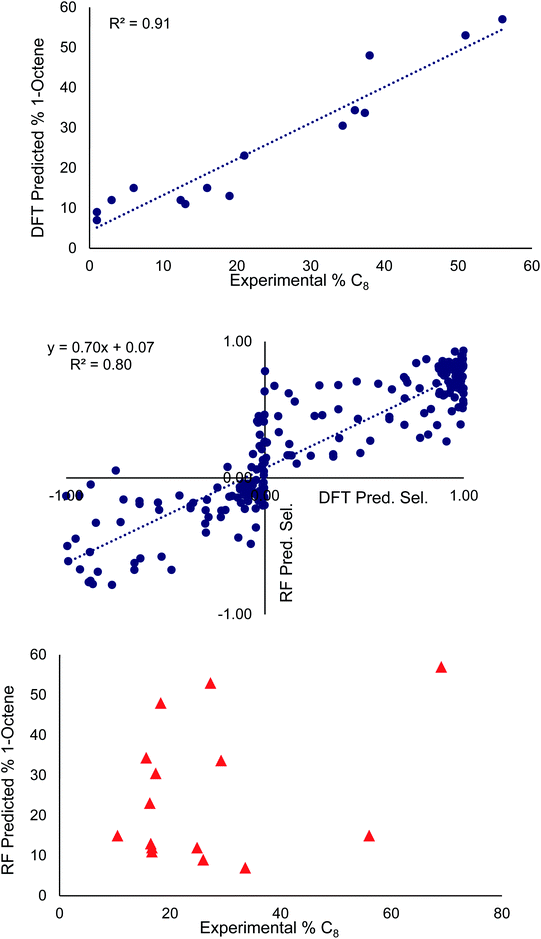
Because the random forest algorithm performed well in our case, and the applications mentioned above, this algorithm was chosen for further hyperparameter optimization using the GridSearch CV method from SciKit-Learn. Different permutations of hyperparameters and five-fold cross validation were tested in order to determine the set of hyperparameters that maximized the performance of the model. The number of trees in each forest was varied from 20 to 210 and the trees were split from 5 to 125 times. Both mean signed error and mean absolute error were considered when determining the quality of each split and between three and 14 features were examined when considering the best split. The optimized random forest model was then re-fit to the training data to validate the hyperparameter optimization. The RMSE of the random forest model decreased from 0.344 to 0.272 after optimization. The RMSE of the 1-hexene to 1-octene selectivities are 0.275 and 0.269, respectively.
The middle of Fig. 3 plots the selectivities determined from the optimized random model against those determined from the DFT selectivity model. In our data set, overall 1-hexene selective (i.e. >50% 1-hexene vs. 1-octene) is labeled as a negative value and overall 1-octene selective is labeled as a positive value (i.e. >50% 1-octene vs. 1-hexene). The random forest model correctly predicted the overall 1-hexene versus 1-octene selectivity for 83 ligands and incorrectly predicted the overall selectivity for 22 ligands. This incorrect assignment occurs in cases where the DFT computed 1-hexene selectivity of a ligand is less than 1%. The random forest model tends to perform best for ligands ranging from 20![[thin space (1/6-em)]](https://www.rsc.org/images/entities/char_2009.gif) :
:![[thin space (1/6-em)]](https://www.rsc.org/images/entities/char_2009.gif) 80 to 50
80 to 50![[thin space (1/6-em)]](https://www.rsc.org/images/entities/char_2009.gif) :
:![[thin space (1/6-em)]](https://www.rsc.org/images/entities/char_2009.gif) 50 1-hexene
50 1-hexene![[thin space (1/6-em)]](https://www.rsc.org/images/entities/char_2009.gif) :
:![[thin space (1/6-em)]](https://www.rsc.org/images/entities/char_2009.gif) 1-octene selectivity (see ESI-Fig. 1†). Importantly, the majority of ligands in our data set are overall 1-octene selective, which is useful for our goal of improving the percentage of 1-octene, but it is likely that the RMSE of the random forest model would be reduced if the data set were more evenly distributed between overall 1-hexene and overall 1-octene selective.
1-octene selectivity (see ESI-Fig. 1†). Importantly, the majority of ligands in our data set are overall 1-octene selective, which is useful for our goal of improving the percentage of 1-octene, but it is likely that the RMSE of the random forest model would be reduced if the data set were more evenly distributed between overall 1-hexene and overall 1-octene selective.
At the top and the bottom of Fig. 3, the 1-octene selectivities calculated using the DFT selectivity model and the optimized random forest model are plotted against the experimentally determined selectivities. The DFT selectivity model agreed with experiment very well (R2 = 0.91, mean absolute deviation = 4.4%). The DFT model underestimates the experimental selectivity, however, this is overall advantageous with the goal to increase 1-octene production. In contrast to the DFT calculated values, the random forest model, not unexpectedly, is unable to quantitatively reproduce the experimental selectivities with a high degree of linear correlation. The lack of very high quantitative correlation between random forest and experiment values is likely due to the relatively small sample size of experimentally studied ligands. Despite this, the random forest can be used to determine critical chemical features that are responsible for enhancing 1-octene selectivity. The relative importance of the 14 features included in our dataset can be determined by replacing data with random values and observing the impact on the RMSE value. If replacing data of a feature with random values results in a small change to the RMSE then it has a low degree of importance. Conversely, if there is a large change in the RMSE then this feature has a large importance. Fig. 4 displays this feature importance analysis using the optimized random forest model.
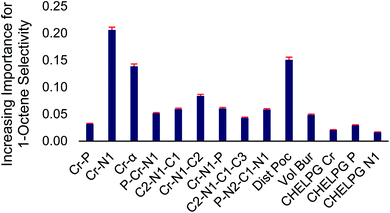 | ||
| Fig. 4 Normalized feature importance determined from random forest model with 95% confidence intervals (red bars). | ||
Inspection of Fig. 4 shows that the Cr–N distance, Cr–α distance, and distance out of pocket were identified as being most important in enhancing 1-octene selectivity. The Cr–N–C2 angle, which is related to the Cr–α distance, was also identified as an important 1-octene enhancing feature. Interestingly, despite the proposed importance of the ligand bite angle, especially for phosphine catalysts,106 we found that the P–Cr–N1 ligand bite angle is among several lesser important features, which is consistent with Sydora previously showing that for Cr-phosphinoamidine catalyst ligands with similar bite angles resulted in significantly different 1-hexene![[thin space (1/6-em)]](https://www.rsc.org/images/entities/char_2009.gif) :
:![[thin space (1/6-em)]](https://www.rsc.org/images/entities/char_2009.gif) 1-octene selectivities.35 After we completed this machine learning analysis and identified the importance of the Cr-distance out of pocket for the 105 ligands examined here, Liu reported a DFT analysis of ethylene oligomerization by a Cr(2,2′-dipicolyamine) catalyst and also found that enhanced tetramerization was likely due to the Cr-distance out of pocket.
1-octene selectivities.35 After we completed this machine learning analysis and identified the importance of the Cr-distance out of pocket for the 105 ligands examined here, Liu reported a DFT analysis of ethylene oligomerization by a Cr(2,2′-dipicolyamine) catalyst and also found that enhanced tetramerization was likely due to the Cr-distance out of pocket.
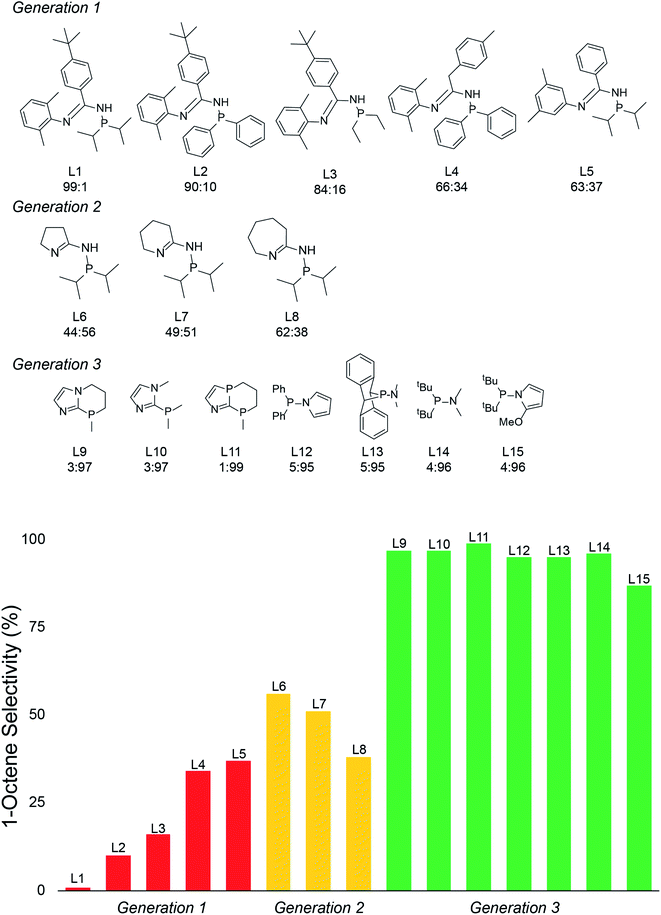
With the emergence of chemical features by the random forest machine learning model, we then turned to the final step in our workflow, which is using this information to virtually identify new catalyst ligands (Scheme 1c). Based on the important features, we rapidly designed ligands L9–L15 shown in Fig. 5. The machine learning features directed us to change the 4-membered (P,N) ligand scaffold found in previously reported ligands of generations 1 (L1–L5) and 2 (L6–L8) to a 3-membered (P,N) ligand, which would potentially alter the Cr–N distance, Cr–α distance, and Cr distance out of ligand pocket. Briefly, generation 1 ligands were reported by Sydora35 and based on experimental trial and error with only a single example of 1-octene production in the vicinity of 30%. Generation 2 ligands were computational designed by us using only transition-state energies, and then experimentally verified to show our DFT calculations were extremely accurate. However, this only led to the improvement of 1-octene selectivity to about 50%. Moreover, these transition states did not provide an obvious way to design a new, more selective generation of catalysts. Our machine-learning driven modification led to the proposal of ligands L9–L11, and with our transition-state model they are predicted to be 97–99% 1-octene selective. With the rapid success of this new generation 3 type of (P,N) ligands we further decreased the ligand to have direct phosphine-nitrogen connection, which naturally led to the proposal of 2-membered (P,N) ligands L12–L14. Based on our transition state model, ligands L12–L14 have predicted selectivities of >95% for 1-octene. Importantly, as plotted at the bottom of Fig. 5, the use of our transition-state model combined with translation of machine learning features to new catalyst ligands, resulted in increasing the prediction of 1-octene from between <35% for generation 1 and ∼50% for generation 2 to >95% for generation 3.
With the rapid success of designing ligands L9–L15 it is clear that there are a number of new candidates that are now available for experimental testing, and several more ligands can now be virtually and rapidly designed. As one experimental confirmation of our results, without prior knowledge, and subsequent to our design of L9–L15, a literature search of all reported Cr-phosphine catalysts for ethylene oligomerization revealed that Yang reported that L12 is indeed highly 1-octene selective.107 In this experimental test, which is signficantly different than the Chevron Phillips Chemical reaction conditions that our transition-state model was developed for, in situ catalyst formation with the combination of Cr(acac)3, MAO, and L12 oligomerized under 50 bar of ethylene gave a 1-hexene![[thin space (1/6-em)]](https://www.rsc.org/images/entities/char_2009.gif) :
:![[thin space (1/6-em)]](https://www.rsc.org/images/entities/char_2009.gif) 1-octene ratio of 28
1-octene ratio of 28![[thin space (1/6-em)]](https://www.rsc.org/images/entities/char_2009.gif) :
:![[thin space (1/6-em)]](https://www.rsc.org/images/entities/char_2009.gif) 70 with trace production of polyethylene.
70 with trace production of polyethylene.
Conclusions
For Cr(P,N) catalyzed ethylene oligomerization, we combined our previously developed experimentally verified DFT-transition-state model with a random forest machine learning model. This workflow involved the calculation of transition-state 1-hexene![[thin space (1/6-em)]](https://www.rsc.org/images/entities/char_2009.gif) :
:![[thin space (1/6-em)]](https://www.rsc.org/images/entities/char_2009.gif) 1-octene selectivity for 105 ligands and the harvesting of 14 descriptors, which were then used to build a random forest regression model with a low RMSE. This model revealed that Cr–N distance, Cr–α distance, and Cr distance out of pocket were key features for enhancing 1-octene selectivity. This then allowed the rapid design of several generation 3 Cr(P,N) catalyst ligands that are predicted to give >95% selectivity for 1-octene. Overall, this work demonstrated the utility of combining an accurate quantum-mechanical transition state model in tandem with machine learning to accelerate molecular catalyst design.
1-octene selectivity for 105 ligands and the harvesting of 14 descriptors, which were then used to build a random forest regression model with a low RMSE. This model revealed that Cr–N distance, Cr–α distance, and Cr distance out of pocket were key features for enhancing 1-octene selectivity. This then allowed the rapid design of several generation 3 Cr(P,N) catalyst ligands that are predicted to give >95% selectivity for 1-octene. Overall, this work demonstrated the utility of combining an accurate quantum-mechanical transition state model in tandem with machine learning to accelerate molecular catalyst design.
Conflicts of interest
A patent application has been filed for subject matter contained in this article.Acknowledgements
We appreciate Dr Uriah Kilgore and Dr Brooke L. Small for helpful discussions during the preparation of this manuscript. We thank Brigham Young University and the Fulton Supercomputing Lab for computational resources. We thank Chevron Phillips Chemical Company LP for financial support and the opportunity to report these results.References
- D. H. Ess, L. Gagliardi and S. Hammes-Schiffer, Chem. Rev., 2019, 119, 6507–6508 CrossRef CAS PubMed.
- S. Ahn, M. Hong, M. Sundararajan, D. H. Ess and M.-H. Baik, Chem. Rev., 2019, 119, 6509–6560 CrossRef CAS PubMed.
- J. T. Golab, CHEMTECH, 1998, 28, 17–23 CAS.
- T. Sperger, I. A. Sanhueza and F. Schoenebeck, Acc. Chem. Res., 2016, 49, 1311–1319 CrossRef CAS PubMed.
- S. Hammes-Schiffer, Acc. Chem. Res., 2017, 50, 561–566 CrossRef CAS PubMed.
- C. Poree and F. Schoenebeck, Acc. Chem. Res., 2017, 50, 605–608 CrossRef CAS PubMed.
- C. Allemann, R. Gordillo, F. R. Clemente, P. H. Y. Cheong and K. N. Houk, Acc. Chem. Res., 2004, 37, 558–569 CrossRef CAS PubMed.
- K. N. Houk and P. H. Y. Cheong, Nature, 2008, 455, 309–313 CrossRef CAS PubMed.
- D. J. Tantillo, Angew. Chem., Int. Ed., 2009, 48, 31–32 CrossRef CAS PubMed.
- R. B. Sunoj, Wiley Interdiscip. Rev.: Comput. Mol. Sci., 2011, 1, 920–931 CAS.
- J. Jover and N. Fey, Chem.–Asian J., 2014, 9, 1714–1723 CrossRef CAS.
- Q. N. N. Nguyen and D. J. Tantillo, Chem.–Asian J., 2014, 9, 674–680 CrossRef CAS PubMed.
- A. S. K. Tsang, I. A. Sanhueza and F. Schoenebeck, Chem.–Eur. J., 2014, 20, 16432–16441 CrossRef CAS PubMed.
- D. J. Tantillo, Acc. Chem. Res., 2016, 49, 1079 CrossRef CAS PubMed.
- M. Kheirabadi, N. Çelebi-Ölçüm, M. F. L. Parker, Q. Zhao, G. Kiss, K. N. Houk and C. E. Schafmeister, J. Am. Chem. Soc., 2012, 134, 18345–18353 CrossRef CAS PubMed.
- A. C. Doney, B. J. Rooks, T. Lu and S. E. Wheeler, ACS Catal., 2016, 6, 7948–7955 CrossRef CAS.
- M. C. Kozlowski, S. L. Dixon, M. Panda and G. Lauri, J. Am. Chem. Soc., 2003, 125, 6614–6615 CrossRef CAS PubMed.
- J. C. Ianni, V. Annamalai, P. W. Phuan, M. Panda and M. C. Kozlowski, Angew. Chem., Int. Ed., 2006, 45, 5502–5505 CrossRef CAS.
- S. Mitsumori, H. Zhang, P. H. Y. Cheong, K. N. Houk, F. Tanaka and C. F. Barbas, J. Am. Chem. Soc., 2006, 128, 1040–1041 CrossRef CAS PubMed.
- G. Jindal and R. B. Sunoj, Org. Biomol. Chem., 2014, 12, 2745–2753 RSC.
- Y. Wang, J. Wang, J. Su, F. Huang, L. Jiao, Y. Liang, D. Yang, S. Zhang, P. A. Wender and Z. X. Yu, J. Am. Chem. Soc., 2007, 129, 10060–10061 CrossRef CAS PubMed.
- P. J. Donoghue, P. Helquist, P. O. Norrby and O. Wiest, J. Am. Chem. Soc., 2009, 131, 410–411 CrossRef CAS PubMed.
- C. N. Rowley and T. K. Woo, Can. J. Chem., 2009, 87, 1030–1038 CrossRef CAS.
- M. H. Baik, S. Mazumder, P. Ricci, J. R. Sawyer, Y. G. Song, H. Wang and P. A. Evans, J. Am. Chem. Soc., 2011, 133, 7621–7623 CrossRef CAS PubMed.
- L. E. Fernandez, S. Horvath and S. Hammes-Schiffer, J. Phys. Chem. Lett., 2013, 4, 542–546 CrossRef CAS PubMed.
- M. C. Nielsen, K. J. Bonney and F. Schoenebeck, Angew. Chem., Int. Ed., 2014, 53, 5903–5906 CrossRef CAS PubMed.
- V. Bernales, A. B. League, Z. Li, N. M. Schweitzer, A. W. Peters, R. K. Carlson, J. T. Hupp, C. J. Cramer, O. K. Farha and L. Gagliardi, J. Phys. Chem. C, 2016, 120, 23576–23583 CrossRef CAS.
- S. Tang, Z. Liu, X. Zhan, R. Cheng, X. He and B. Liu, J. Mol. Model., 2014, 20, 2129 CrossRef.
- M. Karelson, V. S. Lobanov and A. R. Katritzky, Chem. Rev., 1996, 96, 1027–1043 CrossRef CAS PubMed.
- D. H. Kwon, J. T. Fuller, U. J. Kilgore, O. L. Sydora, S. M. Bischof and D. H. Ess, ACS Catal., 2018, 8, 1138–1142 CrossRef CAS.
- P. J. Hogan and R. L. Banks, in History of Polyolefins: The World's Most Widley Used Polymers, ed. R. B. Seymour and T. Cheng, Springer Netherlands, 1986, pp. 103–115 Search PubMed.
- G. Cecchin, G. Morini and F. Piemontesi, in Kirk-Othmer Encyclopedia of Chemical Technology, John Wiley and Sons, 2000 Search PubMed.
- A. Vaughan, D. S. Davis and J. R. Hagadorn, J. Polym. Sci., Part A: Polym. Chem., 2012, 3, 657–672 Search PubMed.
- K. A. Alferov, G. P. Belov and Y. Meng, Appl. Catal., A, 2017, 542, 71–124 CrossRef CAS.
- O. L. Sydora, T. C. Jones, B. L. Small, A. J. Nett, A. A. Fischer and M. J. Carney, ACS Catal., 2012, 2, 2452–2455 CrossRef CAS.
- M. S. Sigman, K. C. Harper, E. N. Bess and A. Milo, Acc. Chem. Res., 2016, 49, 1292–1301 CrossRef CAS.
- P. Friederich, G. Dos Passos Gomes, R. De Bin, A. Aspuru-Guzik and D. Balcells, Chem. Sci., 2020, 11, 4584–4601 RSC.
- N. Fey, A. C. Tsipis, S. E. Harris, J. N. Harvey, A. G. Orpen and R. A. Mansson, Chem.–Eur. J., 2005, 12, 291–302 CrossRef PubMed.
- N. Fey, J. N. Harvey, G. C. Lloyd-Jones, P. Murray, A. G. Orpen, R. Osborne and M. Purdie, Organometallics, 2008, 27, 1372–1383 CrossRef CAS.
- N. Fey, A. G. Orpen and J. N. Harvey, Coord. Chem. Rev., 2009, 253, 704–722 CrossRef CAS.
- J. Jover, N. Fey, J. N. Harvey, G. C. Lloyd-Jones, A. G. Orpen, G. J. J. Owen-Smith, P. Murray, D. R. J. Hose, R. Osborne and M. Purdie, Organometallics, 2010, 29, 6245–6258 CrossRef CAS.
- J. Jover, N. Fey, J. N. Harvey, G. C. Lloyd-Jones, A. G. Orpen, G. J. J. Owen-Smith, P. Murray, D. R. J. Hose, R. Osborne and M. Purdie, Organometallics, 2012, 31, 5302–5306 CrossRef CAS PubMed.
- D. J. Durand and N. Fey, Chem. Rev., 2019, 119, 6561–6594 CrossRef CAS PubMed.
- N. Fey, M. Garland, J. P. Hopewell, C. L. McMullin, S. Mastroianni, A. G. Orpen and P. G. Pringle, Angew. Chem., Int. Ed., 2012, 51, 118–122 CrossRef CAS PubMed.
- A. F. Zahrt, J. J. Henle, B. T. Rose, Y. Wang, W. T. Darrow and S. E. Denmark, Science, 2019, 363, eaau5631 CrossRef CAS PubMed.
- K. E. Abdelfatah, W. Yang, R. Vijay Solomon, B. Rajbanshi, A. Chowdhury, M. Zare, S. K. Kundu, A. C. Yonge, A. Heyden and G. A. Terejanu, J. Phys. Chem. C, 2019, 123, 29804–29810 CrossRef CAS.
- K. Takahashi and I. Miyazato, J. Comput. Chem., 2018, 39, 2405–2408 CrossRef CAS.
- A. R. Singh, B. A. Rohr, J. A. Gauthier and J. K. Nørskov, Catal. Lett., 2019, 149, 2347–2354 CrossRef CAS.
- H.-J. Arpe, Industrial Organic Chemistry, Wiley-VCH Verlag GmbH & Co, 5th edn, 2010 Search PubMed.
- PCT/US2006/031303, 2008.
- P.-A. R. Breuil, L. Magna and H. Olivier-Bourbigou, Catal. Lett., 2015, 145, 173–192 CrossRef CAS.
- G. J. P. Britovsek and D. S. McGuinness, Chem.–Eur. J., 2016, 22, 16891–16896 CrossRef CAS PubMed.
- G. J. P. Britovsek, D. S. McGuinness and A. K. Tomov, Catal. Sci. Technol., 2016, 6, 8234–8241 RSC.
- S. A. Bartlett, J. Moulin, M. Tromp, G. Reid, A. J. Dent, G. Cibin, D. S. McGuinness and J. Evans, ACS Catal., 2014, 4, 4201–4204 CrossRef CAS.
- T. Agapie, Coord. Chem. Rev., 2011, 255, 861–880 CrossRef CAS.
- M. A. Hossain, H. S. Kim, K. N. Houk and M. Cheong, Bull. Korean Chem. Soc., 2014, 35, 2835–2838 CrossRef CAS.
- Z. X. Yu and K. N. Houk, Angew. Chem., Int. Ed., 2003, 42, 808–811 CrossRef CAS PubMed.
- M. Gong, Z. Liu, Y. Li, Y. Ma, Q. Sun, J. Zhang and B. Liu, Organometallics, 2016, 35, 972–981 CrossRef CAS.
- Y. Yang, Z. Liu, R. Cheng, X. He and B. Liu, Organometallics, 2014, 33, 2599–2607 CrossRef CAS.
- Y. Qi, Q. Dong, L. Zhong, Z. Liu, P. Qiu, R. Cheng, X. He, J. Vanderbilt and B. Liu, Organometallics, 2010, 29, 1588–1602 CrossRef CAS.
- P. H. M. Budzelaar, Can. J. Chem., 2009, 87, 832–837 CrossRef CAS.
- S. Bhaduri, S. Mukhopadhyay and S. A. Kulkarni, J. Organomet. Chem., 2009, 694, 1297–1307 CrossRef CAS.
- W. J. Van Rensburg, C. Grové, J. P. Steynberg, K. B. Stark, J. J. Huyser and P. J. Steynberg, Organometallics, 2004, 23, 1207–1222 CrossRef CAS.
- M. A. Kayala, C. A. Azencott, J. H. Chen and P. Baldi, J. Chem. Inf. Model., 2011, 51, 2209–2222 CrossRef CAS PubMed.
- J. N. Wei, D. Duvenaud and A. Aspuru-Guzik, ACS Cent. Sci., 2016, 2, 725–732 CrossRef CAS.
- H. Gao, T. J. Struble, C. W. Coley, Y. Wang, W. H. Green and K. F. Jensen, ACS Cent. Sci., 2018, 4, 1465–1476 CrossRef CAS PubMed.
- C. W. Coley, W. H. Green and K. F. Jensen, Acc. Chem. Res., 2018, 51, 1281–1289 CrossRef CAS PubMed.
- B. Liu, B. Ramsundar, P. Kawthekar, J. Shi, J. Gomes, Q. Luu Nguyen, S. Ho, J. Sloane, P. Wender and V. Pande, ACS Cent. Sci., 2017, 3, 1103–1113 CrossRef CAS PubMed.
- C. W. Coley, R. Barzilay, T. S. Jaakkola, W. H. Green and K. F. Jensen, ACS Cent. Sci., 2017, 3, 434–443 CrossRef CAS PubMed.
- D. T. Ahneman, J. G. Estrada, S. Lin, S. D. Dreher and A. G. Doyle, Science, 2018, 360, 186–190 CrossRef CAS PubMed.
- W. Sun, M. Li, Y. Li, Z. Wu, Y. Sun, S. Lu, Z. Xiao, B. Zhao and K. Sun, Adv. Theory Simul., 2019, 2, 1800116 CrossRef.
- C. W. Coley, W. Jin, L. Rogers, T. F. Jamison, T. S. Jaakkola, W. H. Green, R. Barzilay and K. F. Jensen, Chem. Sci., 2019, 10, 370–377 RSC.
- A. Tomberg, M. J. Johansson and P. O. Norrby, J. Org. Chem., 2019, 84, 4695–4703 CrossRef CAS PubMed.
- A. F. Zahrt, J. J. Henle, B. T. Rose, Y. Wang, W. T. Darrow and S. E. Denmark, Science, 2019, 363, 6424 CrossRef PubMed.
- S. Back, K. Tran and Z. W. Ulissi, ACS Catal., 2019, 9, 7651–7659 CrossRef CAS.
- G. Takasao, T. Wada, A. Thakur, P. Chammingkwan, M. Terano and T. Taniike, ACS Catal., 2019, 9, 2599–2609 CrossRef CAS.
- Z. W. Ulissi, M. T. Tang, J. Xiao, X. Liu, D. A. Torelli, M. Karamad, K. Cummins, C. Hahn, N. S. Lewis, T. F. Jaramillo, K. Chan and J. K. Nørskov, ACS Catal., 2017, 7, 6600–6608 CrossRef CAS.
- A. Nandy, J. Zhu, J. P. Janet, C. Duan, R. B. Getman and H. J. Kulik, ACS Catal., 2019, 9, 8243–8255 CrossRef CAS.
- X. Zhu, J. Yan, M. Gu, T. Liu, Y. Dai, Y. Gu and Y. Li, J. Phys. Chem. Lett., 2019, 10, 7760–7766 CrossRef CAS.
- A. J. Chowdhury, W. Yang, E. Walker, O. Mamun, A. Heyden and G. A. Terejanu, J. Phys. Chem. C, 2018, 122, 28142–28150 CrossRef CAS.
- B. R. Goldsmith, J. Esterhuizen, J. X. Liu, C. J. Bartel and C. Sutton, AIChE J., 2018, 64, 2311–2323 CrossRef CAS.
- X. Guo, S. Lin, J. Gu, S. Zhang, Z. Chen and S. Huang, ACS Catal., 2019, 9, 11042–11054 CrossRef CAS.
- X. Han, L. Yue, C. Zhao, S. Jiang, J. Liu, Y. Li and J. Ren, ChemistrySelect, 2019, 4, 11790–11795 CrossRef CAS.
- R. Jinnouchi and R. Asahi, J. Phys. Chem. Lett., 2017, 8, 4279–4283 CrossRef CAS.
- J. Ohyama, S. Nishimura and K. Takahashi, ChemCatChem, 2019, 11, 4307–4313 CrossRef CAS.
- R. Palkovits and S. Palkovits, ACS Catal., 2019, 9, 8383–8387 CrossRef CAS.
- K. Takahashi, I. Miyazato, S. Nishimura and J. Ohyama, ChemCatChem, 2018, 10, 3223–3228 CrossRef CAS.
- G. A. Landrum, J. E. Penzotti and S. Putta, Meas. Sci. Technol., 2005, 16, 270–277 CrossRef CAS.
- B. A. Rizkin and R. L. Hartman, Chem. Eng. Sci., 2019, 210, 115224 CrossRef CAS.
- J. P. Janet and H. J. Kulik, Chem. Sci., 2017, 8, 5137–5152 RSC.
- J. P. Janet and H. J. Kulik, J. Phys. Chem. A, 2017, 121, 8939–8954 CrossRef CAS PubMed.
- B. Meyer, B. Sawatlon, S. Heinen, O. A. Von Lilienfeld and C. Corminboeuf, Chem. Sci., 2018, 9, 7069–7077 RSC.
- S. Banerjee, A. Sreenithya and R. B. Sunoj, Phys. Chem. Chem. Phys., 2018, 20, 18311–18318 RSC.
- A. Mansouri Tehrani, A. O. Oliynyk, M. Parry, Z. Rizvi, S. Couper, F. Lin, L. Miyagi, T. D. Sparks and J. Brgoch, J. Am. Chem. Soc., 2018, 140, 9844–9853 CrossRef CAS PubMed.
- G. X. Gu, C. T. Chen and M. J. Buehler, Extreme Mech. Lett., 2018, 18, 19–28 CrossRef.
- Z. Li, X. Ma and H. Xin, Catal. Today, 2017, 280, 232–238 CrossRef CAS.
- Y. Zhao and D. G. Truhlar, Theor. Chem. Acc., 2008, 120, 215–241 Search PubMed.
- A. V. Marenich, C. J. Cramer and D. G. Truhlar, J. Phys. Chem. B, 2009, 113, 6378–6396 CrossRef CAS PubMed.
- M. J. Frisch, G. W. Trucks, H. B. Schlegel, G. E. Scuseria, M. A. Robb, J. R. Cheeseman, G. Scalmani, V. Barone, B. Mennucci, G. A. Petersson, H. Nakatsuji, M. Caricato, X. Li, H. P. Hratchian, A. F. Izmaylov, J. Bloino, G. Zheng and J. L. Sonnenberg, 2009.
- E. Jones, T. Oliphant and P. Peterson, SciPy: Open source scientific tools for Python, 2001 Search PubMed.
- T. Oliphant, A Guide to NumPy, Trelgol Publishing, USA, 2006 Search PubMed.
- W. McKinney, in Proceedings of the 9th Python in Science Conference, ed. S. van der Walt and J. Millman, 2010, pp. 51–56 Search PubMed.
- F. Pedregosa, G. Varoquaux, A. Gramfort, V. Michel, B. Thirion, O. Grisel, M. Blondel, P. Prettenhofer, R. Weiss, V. Dubourg, J. Vanderplas, A. Passos, D. Cournapeau, M. Brucher, M. Perrot and E. Duchesnay, J. Mach. Learn. Res., 2011, 12, 2825–2830 Search PubMed.
- L. Falivene, Z. Cao, A. Petta, L. Serra, A. Poater, R. Oliva, V. Scarano and L. Cavallo, Nat. Chem., 2019, 11, 872–879 CrossRef CAS.
- D. S. Palmer, N. M. O'Boyle, R. C. Glen and J. B. O. Mitchell, J. Chem. Inf. Model., 2007, 47, 150–158 CrossRef CAS PubMed.
- S.-K. Kim, T.-J. Kim, J.-H. Chung, T.-K. Hahn, S.-S. Chae, H.-S. Lee, M. Cheng and S. O. Kang, Organometallics, 2010, 29, 5805–5811 CrossRef CAS.
- Y. Yang, Z. Liu, B. Liu and R. Duchateau, ACS Catal., 2013, 3, 2353–2361 CrossRef CAS.
Footnotes |
| † Electronic supplementary information (ESI) available. See DOI: 10.1039/d0sc03552a |
| ‡ Authors contributed equally to this work. |
| This journal is © The Royal Society of Chemistry 2020 |

