 Open Access Article
A Janus 3D DNA nanomachine for simultaneous and sensitive fluorescence detection and imaging of dual microRNAs in cancer cells†
Zezhou
Yang
,
Xin
Peng
,
Peng
Yang
,
Ying
Zhuo
 ,
Ya-Qin
Chai
 ,
Wenbin
Liang
 * and
Ruo
Yuan
 *
*
Key Laboratory of Luminescence Analysis and Molecular Sensing (Southwest University), Ministry of Education, College of Chemistry and Chemical Engineering, Southwest University, Chongqing 400715, PR China. E-mail: wenbinliangasu@gmail.com; yuanruo@swu.edu.cn
First published on 23rd July 2020
Abstract
Herein, a Janus three-dimensional (3D) DNA nanomachine was constructed for the simultaneous and sensitive fluorescence detection and imaging of dual microRNAs (miRNAs) in cancer cells, which could effectively eliminate signal interference in a homogeneous nanoparticle-based 3D DNA nanostructure caused by the proximity of the two different signal probes to achieve accurate co-location in the same position of living cancer cells. In this system, the Janus nanoparticles were synthesized as the carrier for immobilizing two different oligonucleotides on two different functionalized hemispheres of the nanoparticles to form a Janus 3D DNA nanostructure, which could convert trace amounts of miRNA-21 and miRNA-155 targets into massive FAM and Cy5-labeled duplexes to induce two remarkable fluorescence emissions by the catalytic hairpin assembly (CHA) and 3D DNA walker cascade nucleic acid amplification strategy, realizing sensitive detection and imaging of miRNA targets in cancer cells. Impressively, in comparison with current miRNA imaging methods based on nanoparticle assemblies, the proposed strategy could efficiently eliminate “false positive” results obtained in single type miRNA detection and distinctly increase the immobilization concentration of two different signal probes using Janus nanoparticles as the carrier to further enhance fluorescence intensity, resulting in accurate co-location in the same position of living cells. Meanwhile, the proposed fluorescence imaging technology makes it possible to visualize low concentrations of miRNAs with tiny change associated with some cancers, which could significantly improve the accuracy and precision compared to those of the conventional fluorescence in situ hybridization (FISH) approach. Therefore, it could serve as persuasive evidence for supplying accurate information to better understand biological processes and investigate mechanisms of various biomolecules and subcellular organelles, resulting in the further validation of their function in tumor proliferation and differentiation. This strategy provided an innovative approach to design new generations of nanomachines with ultimate applications in bioanalysis and clinical diagnoses.
Introduction
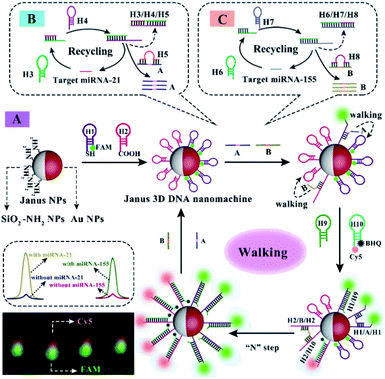
The changes of microRNA (miRNA) expression levels are associated with malignant tumor progression and prognosis,1–9 which have been universally acknowledged as minimally invasive candidate biomarkers in diagnosis of cancers.10–17 Although the current method for simultaneous fluorescence detection and imaging of dual miRNAs in cells could efficiently eliminate “false positive” results obtained in single type miRNA detection,18–23 it is difficult to achieve sensitive detection and accurate co-location imaging of miRNAs in living cells due to the use of two different separate molecular beacons (MBs).24–29 Recently, some 3D DNA nanostructures have been employed in simultaneous detection and imaging of dual miRNA targets via stochastically immobilizing two different signal probes on the surface of the homogeneous nanoparticles to realize relatively precise co-location in the same position of a cell.30–34 However, the fluorescence signal interference could be still caused by the proximity of the two different signal probes immobilized on the homogeneous nanoparticle-based 3D DNA nanostructure, resulting in low sensitivity for the simultaneous detection and fluorescence imaging of miRNAs in cells. Therefore, it remains a huge challenge to achieve sensitive detection and imaging of dual miRNAs and acquire accurate co-location information in the same position of a cell. In this paper, a Janus 3D DNA nanomachine was used for simultaneous and sensitive fluorescence detection and accurate co-location imaging of dual miRNAs in cancer cells, which could effectively eliminate the signal interference in the homogeneous nanoparticle-based 3D DNA nanostructure.The mechanical principle of the Janus 3D DNA nanomachine is shown in Scheme 1. Firstly, carboxyl-labeled H2 and FAM and sulfydryl-labeled H1 were respectively immobilized on the two different hemispheres of Janus nanoparticles (Fig. S1†) composed of the amino group (–NH2) and Au NPs via CO–NH and Au–S bonds to construct the Janus 3D DNA nanostructure as a Janus 3D DNA nanomachine (Scheme 1A). Then, the Janus 3D DNA nanostructure could be unlocked using double feet catalyst strands A and B as 3D DNA walkers, which were obtained by conversion of target miRNA-21 and miRNA-155 with the help of catalytic hairpin assembly (CHA) DNA amplification (Scheme 1B and C). Subsequently, in the presence of H9 and H10, the 3D DNA walkers efficiently moved along the 3D DNA tracks on the two hemispheres of the Janus nanostructure via strand-displacement amplification (SDA) to keep FAM and Cy5 away from Au NPs and quenchers (BHQ) respectively, resulting in the recovery of two remarkable fluorescence emissions to realize sensitive fluorescence detection and accurate co-location imaging of dual miRNAs in cancer cells and regeneration of the walkers for the next cycle. The recycling process of target miRNA-21 and miRNA-155 and the movement of 3D DNA walkers were characterized by polyacrylamide gel electrophoresis (Fig. S2 and S3†). Impressively, the proposed Janus 3D DNA nanostructure using Janus nanoparticles as a carrier of two different signal probes not only effectively eliminated the fluorescence signal interference caused by the proximity of the two different signal probes to reduce the interference of the background and improve the fluorescence intensity, but also distinctly increased the immobilization concentration of two different signal probes to significantly enhance fluorescence intensity for the simultaneous and sensitive fluorescence detection and accurate co-location imaging of miRNA-21 and miRNA-155 in cancer cells. Therefore, such a Janus 3D DNA nanomachine not only provides an innovative approach to significantly improve the efficiency of diagnosis thereby manifestly raising recovery rates and reducing complications, but also helps us to studythe mechanism of tumor formation for the best treatment via screening potential drugs.
Results and discussion
Characterization of the Janus nanoparticles
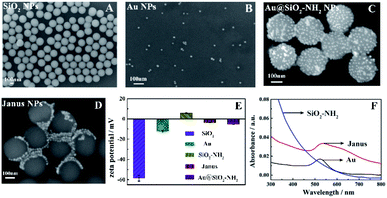
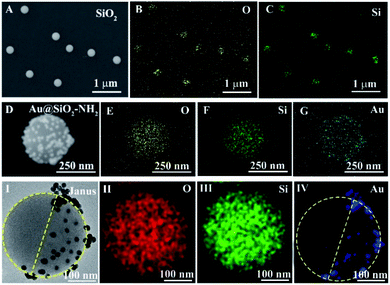
To confirm the successful preparation of Janus nanoparticles, the synthesized nanomaterials with the general size and morphology were characterized with the help of scanning electron microscopy (SEM), zeta potential and ultraviolet-visible (UV-vis) spectroscopy measurements. As shown in Fig. 1A, monodisperse and homogeneous SiO2 NPs with a ∼300 nm diameter were first synthesized utilizing the Stöber method, where the zeta potential of the SiO2–NH2 NPs changed from −58.5 (–Si–O–) to 5.76 mV (–NH3+) (Fig. 1E). Fig. 1B shows a wide-angle view of the synthesized Au NPs with a uniform diameter about 16 nm, whose zeta potential was −12.1 mV (Fig. 1E). Fig. 1C shows the morphology of the Au@SiO2–NH2 NPs, where the entire surface of the SiO2–NH2 NPs was modified with Au NPs without protection with paraffin and the zeta potential of the Au@SiO2–NH2 NPs changed from 5.76 mV (–NH3+) to −5.22 mV (–Au–N) (Fig. 1E), which was effectively what we observed in the control experiments. Au NPs were employed to selectively label the amino region of the exposed surfaces of SiO2–NH2 NPs via a SiO2–NH2 NP colloid-stabilized Pickering emulsion. Fig. 1D shows the features of Janus nanoparticles, and a large number of tiny white dots could be observed on one side of the SiO2–NH2 NPs, whereas the other side had no white dots, which demonstrated that the Au NPs were successfully deposited on one side of SiO2–NH2 NPs with paraffin to selectively protect SiO2–NH2 NPs. The zeta potential of the SiO2–NH2 NPs was 5.76 mV (–NH3+), but the potential of the Janus nanoparticles was decreased to −3.72 mV (–NH3+ and –Au–N) (Fig. 1E), which was due to the shielding effect of Au NPs on the hemispherical surface of the SiO2–NH2 NPs (–NH3+). Fig. 1F shows the UV-vis absorption spectra of different nanoparticles. Compared to that of Au NPs with an obvious characteristic absorption peak only at 520 nm, the UV-vis spectrum of Janus nanoparticles also showed a characteristic peak at 533 nm. However, the pure SiO2–NH2 NP suspension did not exhibit an evident absorption peak in the wavelength range. Consequently, the UV-vis spectral results revealed that Au NPs were successfully immobilized on one side of the SiO2–NH2 NPs.To further study the asymmetric structures of the synthetic Janus nanoparticles, the distribution of different elements was analyzed by EDS mapping. Fig. 2A exhibits the SEM image of SiO2 NPs. Furthermore, the O and Si elements are shown in Fig. 2B and C, respectively. As shown in Fig. 2D, the entire surface of the SiO2–NH2 NPs was modified with Au NPs. Meanwhile, the O, Si and Au elements could be distinctly observed, respectively (Fig. 2E–G). Subsequently, we have performed HT-SEM possessing high resolution and precision to clearly obtain the corresponding element distribution of Janus nanoparticles. Moreover, the region of Au elements has been labeled to directly reflect the regional distribution. Fig. 2I shows the features of Janus nanoparticles, and a large number of tiny white dots could be observed on one side of the SiO2–NH2 NPs, whereas the other side had no white dots. The O, Si and Au elements are shown in Fig. 2II–IV, respectively. Compared with those in the EDS mapping of Au@SiO2–NH2 NPs (Fig. 2G), Au elements are concentrated on the hemispherical surface of SiO2–NH2 NPs (Fig. 2IV), suggesting that Au NPs could be selectively labeled in the specific region of SiO2–NH2 NPs via selective protection.
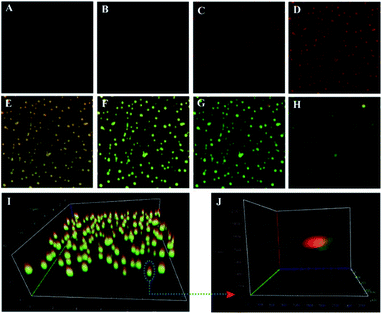
Next, the dual-color fluorescent Janus nanoparticles were confirmed from confocal laser scanning microscopy (CLSM) images (Fig. 3). The Janus 3D DNA nanostructure was constructed by immobilizing numerous FAM and Cy5-labeled signal duplexes on the surface of the two different hemispheres, respectively. As shown in Fig. 3A–H, the green fluorophore FAM and the red fluorophore Cy5 were respectively observed at different depths of the Z-axis with excitation at 488 nm and 640 nm. Fig. 3I shows an obvious boundary between the two hemispheres, which can be clearly distinguished by their distinct colors, with one side green and the other red. Furthermore, the two hemispheres of different colors could be observed more apparently in individually enlarged 3D images (Fig. 3J). These results proved that the two different DNA substrates were modified on each hemisphere of Janus nanoparticles, which could possess great prospects and provide an efficient avenue for simultaneous detection and fluorescence imaging of the two related biomarkers.
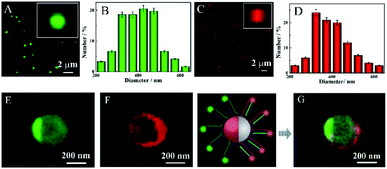
Additionally, the morphology of the dual-color fluorescent Janus nanoparticles was estimated by total internal reflection fluorescence microscope (TIRFM) imaging in aqueous solution. As shown in Fig. 4A, the monodisperse fluorophore FAM labeled Au@SiO2–NH2 NPs with a 300–500 nm diameter (Fig. 4B) were first synthesized, where the bright green spots could be observed apparently. Fig. 4C exhibits the fluorophore Cy5 labeled SiO2–NH2 NPs with a lot of visible red dots throughout the field, whose size was also 300–500 nm (Fig. 4D). As expected, the dual-color fluorescent Janus nanoparticles were excited at 488 nm and 640 nm, and the results exhibited two different colors on the two hemispheres, respectively (Fig. 4E and F). Meanwhile, the fluorescence of fluorophore FAM was concentrated in one half of the sphere of the same nanoparticles, while the fluorescence of fluorophore Cy5 was distributed in the other half. Furthermore, as shown in Fig. 4G for optical deviation analysis, green and red fluorescence were distinctly observed from the two hemispheres, which can be obviously distinguished by their striking color due to the two modified fluorophore labeled DNA substrates on each hemisphere of the Janus nanoparticles. These results suggested that the dual-color fluorescent Janus nanoparticles were successfully synthesized.
Walking efficiency of the Janus 3D DNA nanomachine
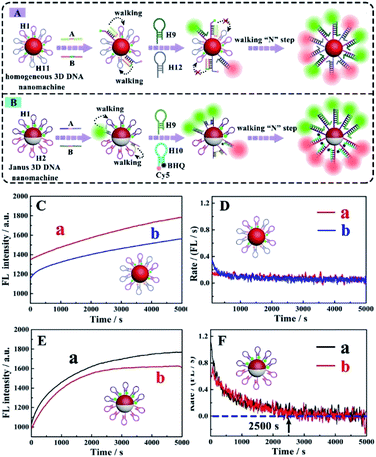
In order to investigate the walking efficiency of the proposed Janus 3D DNA nanomachine (Fig. 5B) in comparison with the homogeneous Au@SiO2–NH2 NP-based 3D DNA nanomachine (Fig. 5A), the real-time fluorescence intensity over a period of time was monitored (Fig. 5C and E) and the corresponding reaction rate curves were obtained (Fig. 5D and F).As shown in Fig. 5C, with the increase of the reaction time, the fluorescence intensity of the homogeneous Au@SiO2–NH2 NP-based 3D DNA nanomachine constantly increased in the presence of 5 pM target miRNA-21 (Fig. 5C curve a) and miRNA-155 (Fig. 5C curve b), the reaction system could not be complete because the real-time fluorescence did not reach the equilibrium state even though in 5000 seconds. Moreover, the reaction rate was extraordinarily slow over 5000 seconds in the presence of miRNA-21 (Fig. 5D curve a) and miRNA-155 (Fig. 5D curve b), respectively. As presented in Fig. 5E, a conspicuous fluorescence increase of our Janus 3D DNA nanomachine by addition of 5 pM target miRNA-21 (Fig. 5E curve a) and miRNA-155 (Fig. 5E curve b) was observed. Meanwhile, the fluorescence plateau was reached in just 2500 seconds. As expected, the reaction rate was exceedingly quick in the first 2500 seconds. After this, the reaction rate becomes very slow or even tends to zero for detection of miRNA-21 (Fig. 5F curve a) and miRNA-155 (Fig. 5F curve b), respectively. These results confirmed that our proposed Janus 3D DNA nanomachine exhibited a high walking efficiency owing to the increasing immobilization concentration of the two different signal probes and significantly reducing steric hindrance and interference caused by non-reactive oligonucleotides via immobilization of two different oligonucleotides on the two different functionalized hemispheres of the nanoparticles. Therefore, the described Janus 3D DNA nanomachine provided an opportunity for the simultaneous and sensitive fluorescence detection and imaging of dual target miRNAs in cancer cells.
Application of the Janus 3D DNA nanomachine in simultaneous and sensitive detection and imaging
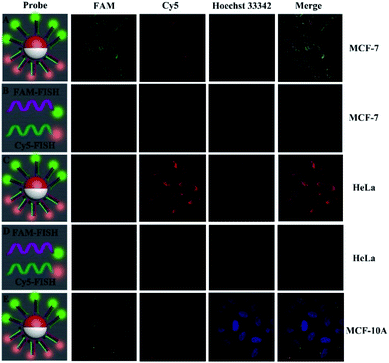
To evaluate the dependence of the fluorescence response on dual miRNAs, the proposed sensing platform based on the Janus 3D DNA nanomachine was modified with different concentrations of miRNAs under the optimized experimental conditions (Fig. S7†). Meanwhile, the stability and feasibility of our proposed strategy were characterized using fluorescence spectra (Fig. S4 and S6†). The fluorescence signal conspicuously increased with the increasing miRNA-21 and miRNA-155 concentration in the range from 1 pM to 10 nM (Fig. S8A and S8C†) and showed a good linear relationship with the logarithm of the miRNA-21 and miRNA-155 concentration (Fig. S8B and S8D†), and the detection limit was down to 0.35 pM and 0.48 pM for miRNA-21 and miRNA-155 sensitive analysis. By comparing the proposed Janus 3D DNA nanomachines with those in previous studies and without an amplification strategy for miRNA-21 and miRNA-155 determination (Table S4 and Fig. S10†), it can be seen that the proposed fluorescence assay showed a higher sensitivity and selectivity (Fig. S13 and S14†). The MTT assay demonstrated the low cytotoxicity and favorable biocompatibility of our nanomachine (Fig. S5†).To prove the feasibility of the Janus 3D DNA nanomachine for simultaneous and sensitive fluorescence imaging of the intracellular dual miRNAs, MCF-7 cells with relatively high expression of miRNA-21 and miRNA-155 (ref. 35 and 36) were studied with the use of the conventional fluorescence in situ hybridization (FISH) method and our Janus 3D DNA nanostructures coupled with the signal amplification strategy, respectively. With the Janus 3D DNA nanomachine-based fluorescence method, MCF-7 cells that had overexpressed miRNA-21 and miRNA-155 levels exhibited remarkable green (FAM for miRNA-21) and red (Cy5 for miRNA-155) fluorescence signals (Fig. 6A). However, with the conventional FISH approach, only very weak green and red fluorescence signals could be observed (Fig. 6B).
These results clearly demonstrated that our proposed Janus 3D DNA nanostructure was more sensitive than the traditional FISH approach for the simultaneous imaging of overexpressed miRNA-21 and miRNA-155 in cancer cells. Moreover, the Janus 3D DNA nanostructure and FISH probes were also delivered into HeLa cells with a low concentration of miRNA-21 and highly overexpressed levels of miRNA-155.37,38 As shown in Fig. 6C, the red fluorescence (Cy5 for miRNA-155) was remarkably stronger than the green fluorescence (FAM for miRNA-21), but green fluorescence distinguishable from the background was still obviously observed. However, with the conventional FISH approach, only very weak red fluorescence could be observed and no green fluorescence could be seen (Fig. 6D). Compared to no green fluorescence in Fig. 6D, the distinct green fluorescence signal distinguished from the background in Fig. 6C was observed, which suggested that the proposed Janus 3D DNA nanomachine could not only sensitively image highly overexpressed miRNAs, but also make it possible to visualize low concentrations of miRNAs in cancer cells with high accuracy. So it could serve as persuasive evidence for supplying accurate co-location information to help researchers to better understand the biological processes and mechanisms of various biomolecules and subcellular organelles. Moreover, normal epithelial breast MCF-10A cells were selected as the control to further investigate the practical performance of the Janus 3D DNA nanomachine. As shown in Fig. 6E, only very weak green (FAM for miRNA-21) and red (Cy5 for miRNA-155) fluorescence signals could be observed, consistent with the low expression levels of miRNA-21 and miRNA-155 in the MCF-10A cells. In addition, the Au@SiO2–NH2 NP and SiO2–NH2 NP-based 3D DNA nanostructures were used as controls to further verify the applicability of our proposed Janus 3D DNA nanostructure (Fig. S11 and S12†). Thus, the proposed Janus 3D DNA nanomachine offered a new means for simultaneous and sensitive fluorescence imaging of dual miRNAs in living cells and to understand the chemistry within cellular systems and its application in biological analysis and accurate disease diagnosis.
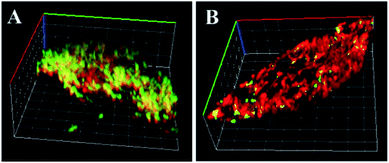
In order to obtain distinct images of dual-color fluorescent Janus nanoparticles in MCF-7 cells and HeLa cells, 3D CLSM was performed. As shown in Fig. 7A, a clear boundary between the two functionalized hemispheres with one side green (FAM for miRNA-21) and the other red (Cy5 for miRNA-155) in MCF-7 cells could be seen, which demonstrated that the Janus 3D DNA nanomachine could be employed in simultaneous and sensitive imaging of overexpressed miRNA-21 and miRNA-155 in the same position of the cancer cells. As shown in Fig. 7B, the red fluorescence was distinctly stronger than the green fluorescence in HeLa cells, but a relatively low concentration of miRNA-21 could also be clearly observed. In addition, CLSM imaging with different depths of the Z-axis proved the practicability and reliability of the Janus 3D DNA nanomachine (Fig. S15†). Moreover, the suitability of the Janus 3D DNA nanomachine for simultaneous detection of miRNA-21 and miRNA-155 was investigated with the total RNA extraction solutions from MCF-7 and HeLa cells (Fig. S16†) and the results were in accordance with those in previous references. Consequently, the proposed Janus 3D DNA nanomachine could be applied in effectively and sensitively distinguishing changes in miRNA-21 and miRNA-155 expression levels and acquiring accurate co-location information in the same position of the living cells, which provides a valuable research means for the study of the biological functions of intracellular micro-regions and subcellular organelles, improving the accuracy and precision of early disease diagnosis and therapy.
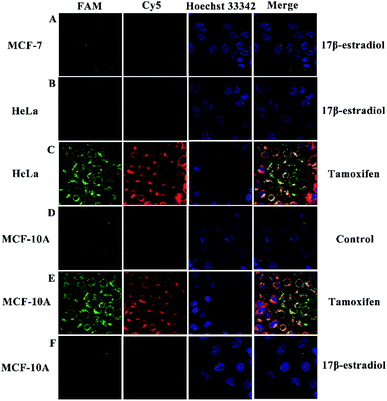
In order to further prove the practical application performance of the proposed strategy, the use of this method for screening potential drugs that can regulate miRNA expression in cells was also investigated. In this regard, two drugs, tamoxifen and 17β-estradiol, which are known to increase or decrease miRNA-21 and miRNA-155 expression levels in MCF-7 cells, HeLa cells and normal epithelial breast MCF-10A cells, respectively, were used to treat the cells. As shown in Fig. 8A, MCF-7 cells that had been treated with 17β-estradiol showed obviously reduced green (FAM for miRNA-21) and red (Cy5 for miRNA-155) fluorescence signals. As shown in Fig. 8B, after incubating 17β-estradiol with HeLa cells, only very weak red fluorescence could be observed but no green fluorescence could be seen. However, when the HeLa cells were treated with tamoxifen, a significant increase in green and red fluorescence intensity could be observed (Fig. 8C). With the Janus 3D DNA nanomachine-based fluorescence method, MCF-10A cells that had low concentration of miRNA-21 and miRNA-155 exhibited weak green and red fluorescence (Fig. 8D). As shown in Fig. 8E, after incubating tamoxifen with MCF-10A cells, a remarkable enhancement in green and red fluorescence intensity of could be observed. Nevertheless, when the MCF-10A cells were treated with 17β-estradiol, some green and red fluorescence which was distinguished from the background could be seen (Fig. 8F). These results reveal distinct miRNA-21 and miRNA-155 expression variations in the MCF-7, HeLa and MCF-10A cells after being treated with the two respective drugs. Therefore, this method for monitoring cellular changes in miRNAs expression levels in response to drugs can be useful for discovering potential drugs for therapeutic purposes, which helps researchers to better study the mechanism of tumor formation to look for the best treatment, thereby manifestly raising recovery rates and reducing complications.
Conclusions
In summary, we adopted Janus nanoparticles as the carrier for immobilizing two different signal probes on two different functionalized hemispheres of the nanoparticles and combined with the high signal amplification efficiency of 3D DNA walkers, which not only effectively eliminated the fluorescence signal interference in the homogeneous nanoparticle-based 3D DNA nanostructure, but also distinctly increased the immobilization concentration of the two different signal probes to remarkably improve the sensitivity of simultaneous detection and imaging of dual miRNAs in cancer cells. Moreover, the proposed Janus 3D DNA nanomachine-based fluorescence method achieved accurate co-location in the same position of the living cells, which could serve as persuasive evidence to help researchers to better understand the biological processes and mechanisms of various biomolecules and subcellular organelles. This protocol offers a preeminent sensing strategy for simultaneous and sensitive fluorescence detection and imaging of diverse nucleotides and proteins and has great application prospects to screen potential drugs in early clinical diagnoses of disease.Conflicts of interest
There are no conflicts to declare.Acknowledgements
This work was financially supported by the National Natural Science Foundation (NNSF) of China (21974108, 21775124 and 21675129) and the Nature Science Foundation of Chongqing (cstc2019jcyj-msxmX0225), China.Notes and references
- C. J. You, W. R. He, R. L. Hang, C. J. Zhang, X. F. Cao, H. W. Guo, X. M. Chen, J. Cui and B. X. Mo, Nat. Commun., 2019, 10, 4424 CrossRef PubMed.
- F. Rehfeld, D. Maticzka, S. Grosser, P. Knauff, M. Knauff, I. Vida, R. Knauff and F. G. Knauff, Nat. Commun., 2018, 9, 1235 CrossRef PubMed.
- Q. Y. Yang, R. H. Li, Q. F. Lyu, L. Hou, Z. Liu, Q. Sun, M. Liu, H. J. Shi, B. Y. Xu, M. R. Yin, Z. G. Yan, Y. Huang, M. F. Liu, Y. P. Li and L. G. Wu, Nat. Commun., 2019, 10, 3389 CrossRef PubMed.
- A. Lujambio and S. W. Lowe, Nature, 2012, 482, 347–355 CrossRef CAS PubMed.
- W. Ma, P. Fu, M. Z. Sun, L. G. Xu, H. Kuang and C. L. Xu, J. Am. Chem. Soc., 2017, 139, 11752–11759 CrossRef CAS PubMed.
- A. D. Castañeda, N. J. Brenes, A. Kondajji and R. M. Crooks, J. Am. Chem. Soc., 2017, 139, 7657–7664 CrossRef PubMed.
- J. B. Li, L. Huang, X. Xiao, Y. J. Chen, X. X. Wang, Z. Q. Zhou, C. Y. Zhang and Y. Zhang, J. Am. Chem. Soc., 2016, 138, 15943–15949 CrossRef CAS PubMed.
- C. Alberti, R. A. Manzenreither, I. Sowemimo, T. R. Burkard, J. K. Wang, K. Mahofsky, S. Lameres and L. Cochella, Nat. Methods, 2018, 15, 283–289 CrossRef CAS PubMed.
- H. P. Li, J. Liu, J. N. Chen, H. Y. Wang, L. B. Yang, F. Chen, S. T. Fan, J. Wang, B. Shao, D. Yin, M. S. Zeng, M. F. Li, J. Li, F. X. Su, Q. Liu, H. R. Yao, S. C. Su and E. W. Song, Nat. Commun., 2018, 9, 1614 CrossRef PubMed.
- T. Fang, H. W. Lv, G. S. Lv, T. Li, C. Z. Wang, Q. Han, L. X. Yu, B. Su, L. N. Guo, S. N. Huang, D. Cao, L. Tang, S. H. Tang, M. C. Wu, W. Yang and H. Y. Wang, Nat. Commun., 2018, 9, 191 CrossRef PubMed.
- R. Rupaimoole and F. J. Slack, Nat. Rev. Drug Discovery, 2017, 16, 203–222 CrossRef CAS PubMed.
- X. Qiu, J. Xu, J. Guo, A. Yahia-Ammar, N. I. Kapetanakis, I. Duroux-Richard, J. J. Unterluggauer, N. Golob-Schwarzl, C. Regeard, C. Uzan, S. Gouy, M. DuBow, J. Haybaeck, F. Apparailly, P. Busson and N. Hildebrandt, Chem. Sci., 2018, 9, 8046–8055 RSC.
- C. P. Liang, P. Q. Ma, H. Liu, X. G. Guo, B. C. Yin and B. C. Ye, Angew. Chem., Int. Ed., 2017, 56, 9077–9081 CrossRef CAS PubMed.
- L. G. Xu, Y. F. Gao, H. Kuang, L. M. Liz-Marzan and C. L. Xu, Angew. Chem., Int. Ed., 2018, 57, 10544–10548 CrossRef CAS PubMed.
- L. M. Xian, H. Y. Ge, F. Xu, N. Xu, J. L. Fan, K. Shao and X. J. Peng, Chem. Sci., 2019, 10, 7111–7118 RSC.
- J. X. Zhao, C. Liu, Y. K. Li, Y. Ma, J. Q. Deng, L. L. Li and J. S. Sun, J. Am. Chem. Soc., 2020, 142, 4996–5001 CrossRef CAS PubMed.
- G. M. Loo, A. Scherl, A. Nguyen, F. Y. Man, E. Weinberg, Z. S. Zeng, L. Saltz, P. B. Paty and S. F. Tavazoie, Cell, 2015, 160, 393–406 CrossRef PubMed.
- C. Xue, S. X. Zhang, C. H. Ouyang, D. R. Chang, B. J. Salena, Y. F. Li and Z. S. Wu, Angew. Chem., Int. Ed., 2018, 57, 9739–9743 CrossRef CAS PubMed.
- X. D. Meng, W. H. Dai, K. Zhang, H. F. Dong and X. J. Zhang, Chem. Sci., 2018, 9, 1184–1190 RSC.
- X. H. Guo, S. Li, F. Ding, H. J. Fan, L. L. Shi, L. J. Zhu, J. Li, J. Feng, X. Y. Zhu and C. Zhang, Angew. Chem., Int. Ed., 2019, 58, 8719–8723 CrossRef PubMed.
- S. Kim, J. E. Park, W. Hwang, J. Seo, Y. K. Lee, J. H. Hwang and J. M. Nam, J. Am. Chem. Soc., 2017, 139, 3558–3566 CrossRef CAS PubMed.
- R. J. Deng, L. H. Tang, Q. Q. Tian, Y. Wang, L. Lin and J. H. Li, Angew. Chem., Int. Ed., 2014, 53, 2389–2393 CrossRef CAS PubMed.
- Y. Zhang, Z. H. Shuai, H. Zhou, Z. M. Luo, B. Liu, Y. N. Zhang, L. Zhang, S. F. Chen, J. Chao, L. X. Weng, Q. L. Fan, C. H. Fan, W. Huang and L. H. Wang, J. Am. Chem. Soc., 2018, 140, 3988–3993 CrossRef CAS PubMed.
- W. J. Zhou, D. X. Li, R. Yuan and Y. Xiang, Anal. Chem., 2019, 91, 3628–3635 CrossRef CAS PubMed.
- X. Qiu and N. Hildebrandt, ACS Nano, 2015, 9, 8449–8457 CrossRef CAS PubMed.
- X. D. Meng, K. Zhang, W. H. Dai, Y. Cao, F. Yang, H. F. Dong and X. J. Zhang, Chem. Sci., 2018, 9, 7419–7425 RSC.
- J. J. Guo, C. Mingoes, X. Qiu and N. Hildebrandt, Anal. Chem., 2019, 91, 3101–3109 CrossRef CAS PubMed.
- F. Yang, Y. R. Cheng, Y. Cao, H. F. Dong, H. T. Lu, K. Zhang, X. D. Meng, C. H. Liu and X. J. Zhang, Chem. Sci., 2019, 10, 1709–1715 RSC.
- A. H. Qua, M. Z. Sun, L. G. Xu, C. L. Hao, X. L. Wu, C. L. Xu, N. A. Kotov and H. Kuang, Proc. Natl. Acad. Sci. U. S. A., 2019, 116, 3391–3400 CrossRef PubMed.
- S. P. Song, Z. Q. Liang, J. Zhang, L. H. Wang, G. X. Li and C. H. Fan, Angew. Chem., Int. Ed., 2009, 48, 8670–8674 CrossRef CAS PubMed.
- J. Zhang, L. H. Wang, H. Zhang, F. Boey, S. P. Song and C. H. Fan, Small, 2010, 6, 201–204 CrossRef CAS PubMed.
- W. Pan, T. T. Zhang, H. J. Yang, W. Diao, N. Li and B. Tang, Anal. Chem., 2013, 85, 10581–10588 CrossRef CAS PubMed.
- S. J. Ye, X. X. Li, M. L. Wang and B. Tang, Anal. Chem., 2017, 89, 5124–5130 CrossRef CAS PubMed.
- W. Pan, Y. L. Li, M. M. Wang, H. J. Yang, N. Li and B. Tang, Chem. Commun., 2016, 52, 4569–4572 RSC.
- Q. Liu, D. Wang, M. Yuan, B. F. He, J. Li, C. Mao, G. S. Wang and H. Qian, Chem. Sci., 2018, 9, 7562–7568 RSC.
- S. K. Sandhu, S. Volinia, S. Costinean, M. Galasso, R. Neinast, R. Santhanam, M. R. Parthun, D. Perrott, G. Marcucci, R. Garzon and C. M. Croce, Proc. Natl. Acad. Sci. U. S. A., 2012, 109, 20047–20052 CrossRef CAS PubMed.
- B. C. Yin, Y. Q. Liu and B. C. Ye, J. Am. Chem. Soc., 2012, 134, 5064–5067 CrossRef CAS PubMed.
- K. Gocze, K. Gombos, K. Kovacs, K. Juhasz, P. Gocze and I. Kiss, Anticancer Res., 2015, 35, 523–530 CAS.
Footnote |
| † Electronic supplementary information (ESI) available. See DOI: 10.1039/d0sc02850a |
| This journal is © The Royal Society of Chemistry 2020 |

