
 Open Access Article
 This Open Access Article is licensed under a Creative Commons Attribution-Non Commercial 3.0 Unported Licence
Prediction of drug metabolites using neural machine translation†
Eleni E.
Litsa
 a,
Payel
Das
*bc and
Lydia E.
Kavraki
*a
a,
Payel
Das
*bc and
Lydia E.
Kavraki
*a
aDepartment of Computer Science, Rice University, Houston, TX, USA. E-mail: kavraki@rice.edu
bIBM Research AI, IBM Thomas J. Watson Research Center, Yorktown Heights, NY 10598, USA. E-mail: daspa@us.ibm.com
cApplied Physics and Applied Mathematics, Columbia University, New York, NY 10027, USA
First published on 24th September 2020
Abstract
Metabolic processes in the human body can alter the structure of a drug affecting its efficacy and safety. As a result, the investigation of the metabolic fate of a candidate drug is an essential part of drug design studies. Computational approaches have been developed for the prediction of possible drug metabolites in an effort to assist the traditional and resource-demanding experimental route. Current methodologies are based upon metabolic transformation rules, which are tied to specific enzyme families and therefore lack generalization, and additionally may involve manual work from experts limiting scalability. We present a rule-free, end-to-end learning-based method for predicting possible human metabolites of small molecules including drugs. The metabolite prediction task is approached as a sequence translation problem with chemical compounds represented using the SMILES notation. We perform transfer learning on a deep learning transformer model for sequence translation, originally trained on chemical reaction data, to predict the outcome of human metabolic reactions. We further build an ensemble model to account for multiple and diverse metabolites. Extensive evaluation reveals that the proposed method generalizes well to different enzyme families, as it can correctly predict metabolites through phase I and phase II drug metabolism as well as other enzymes. Compared to existing rule-based approaches, our method has equivalent performance on the major enzyme families while it additionally finds metabolites through less common enzymes. Our results indicate that the proposed approach can provide a comprehensive study of drug metabolism that does not restrict to the major enzyme families and does not require the extraction of transformation rules.
1 Introduction
Metabolic processes involve chemical reactions that are mediated by enzymes and take place to sustain life, either by providing energy and building blocks to the cells or by eliminating potentially harmful compounds. Certain enzyme families are responsible for the elimination of xenobiotics, that is compounds that do not naturally occur in the human body, such as, drugs, pesticides and pollutants. Metabolism of xenobiotics commonly takes place in the liver in two phases.1 Phase I includes oxidation reactions, mediated mainly by the cytochrome P450 (CYP450) enzyme family, which prepare the molecule to undergo a conjugation reaction in phase II. The conjugation reactions, which are mediated by transferases, serve two purposes: first they deactivate possibly toxic compounds and second, they increase their polarity to aid excretion from the body.Although these processes constitute protection mechanisms for the elimination of xenobiotics, in the case of drugs they can lead to reduced efficacy and raise safety issues. Phase I reactions, and less commonly phase II, can lead to the formation of toxic metabolites posing threats for liver toxicity.2 Indeed, a number of drugs have been withdrawn from the market due to hepatotoxicity with the leading cause being the formation of active metabolites.3 In addition, metabolism can affect drug bioavailability and can be the cause of drug–drug interactions. As a result, drug metabolism studies constitute an essential part of drug development. They can provide insights on the suitability of a compound as a drug or indicate possible chemical modifications that will improve the metabolic profile of a lead compound. Traditionally drug metabolism is studied experimentally using analytical techniques, such as mass spectrometry, which are resource demanding.4
Multiple efforts have been made for developing computational tools for drug metabolism prediction5,6 to assist experimental evaluation and also facilitate the incorporation of metabolic studies at the early stages of drug development.7 Most of the existing tools are specifically designed for predicting metabolism through CYP450 enzymes that are responsible for metabolizing about 70–80% of existing drugs. Methods that have gained popularity, both from a computational and a practical standpoint, are the ones that aim at identifying the atoms within the molecule involved in the metabolic transformation, called sites of metabolism.5,6 In practice, if the sites of metabolism are known, the structure of a lead compound can be modified in order to manipulate its metabolism. However, the sites of metabolism per se do not give insights on the structure of metabolites that may cause toxicity or other complications.
The metabolite prediction problem has been studied to a smaller extent due to the intrinsic difficulty of the problem which requires the generation of structured data, i.e., the structures of the metabolites. Current approaches are rule-based methods, which rely on sets of transformation rules for generating possible metabolites. Existing such tools rely on rules that cover reactions of mainly phase I and possibly phase II metabolism.4,6 Extending their coverage to account for additional enzymes may be challenging. First, the extraction of rules from reaction databases often involves manual work by experts. Second, an increase in the number of rules may result in a larger number of false positives, resulting in a low precision performance, which is already a significant problem.4 There have been some noteworthy efforts for addressing these problems, which mainly attempt to reduce the number of false positives. Some approaches apply statistical analysis or heuristics to rank the generated metabolites.8,9 Others apply machine learning techniques in order, either to identify the sites of metabolism prior to the application of rules,9 or to predict substrate specificity excluding unlikely reaction types.10 There have been also efforts for obtaining greater coverage of the metabolite space by developing multiple models, each one intended for a different enzyme family.10 An additional problem though, which is inherent to the rule-based methods, is that they fail to generalize for a variety of substrates, as a rule is applied only when there is an exact match between the substrate and the rule pattern.
The metabolite prediction problem relates closely to that of reaction outcome prediction, which has attracted great interest and has seen significant advancements the last few years. Similar to the metabolite prediction, most approaches, and especially the early ones, are rule-based.11–13 The adoption of deep learning methodologies though, along with the availability of massive datasets of chemical reactions, such as the Lowe's dataset,14 have led to significant improvements in terms of accuracy.15–17 In an effort to deal with the lack of generalization capabilities of rule-based methods, the application of end-to-end learning has also been explored aiming at using neural network based architectures for directly converting the reactant molecules into the product molecules bypassing the need of explicitly encoding transformations rules. More specifically, the reaction prediction problem has been formulated as a sequence translation problem where the reactants are translated into the products, relying on a sequence representation of molecules, similar to natural language translation.18 One of the first approaches was developed upon a sequence translation model which relies on recurrent neural networks for capturing dependencies within the sequence.16 A more recent model, called molecular transformer,17 further improved upon its predecessor by adopting a newer architecture for neural machine translation, called transformer,19 which relies solely on attention layers for capturing inter-dependencies in sequences. Very recently, the molecular transformer proved to be a good starting point for deriving a model that is specialized on predicting outcomes for a specific reaction class through transfer learning.20
The lack of data is an important factor impeding the application of an end-to-end learning-based method for the task of predicting drug metabolites. In addition to that, the metabolite prediction problem exhibits a number of additional intrinsic difficulties when compared to that of reaction outcome prediction, as it is illustrated in Fig. 1: A molecule may be metabolized in different ways through multiple enzymes and the various metabolites may be quite diverse in terms of structure. Oxidative enzymes for example, which include the CYP450 family, cause small local changes. Transferases increase the size of the molecule attaching a new structure to it, while hydrolases, may break it down into smaller structures. Therefore, in the context of reaction prediction, the prediction of drug metabolites can be seen as predicting incomplete reactions in which multiple outcomes are possible.
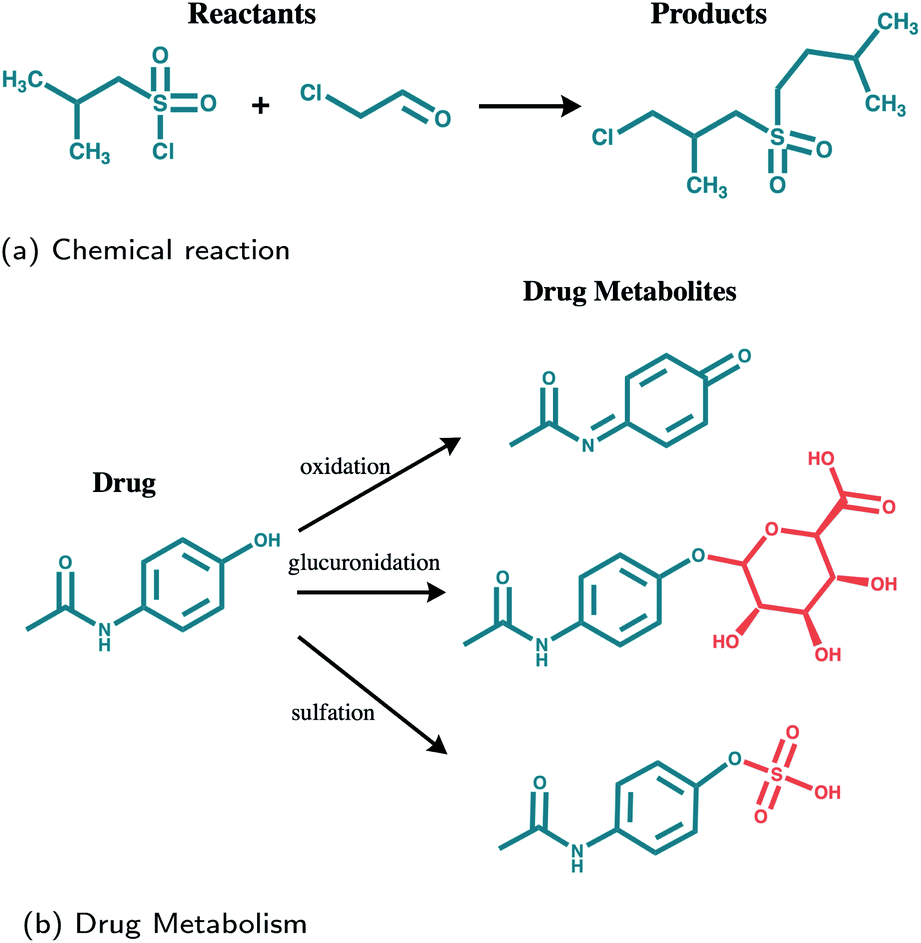 | ||
| Fig. 1 Drug metabolites prediction (b) as opposed to reaction outcome prediction (a). In drug metabolism multiple outcomes are possible and transferred structures (highlighted in red) are not known in advance. | ||
Herein, we present metabolite translator (MetaTrans): a rule-free, end-to-end learning-based method for predicting human metabolites of small molecules. We approached the metabolite prediction problem as a sequence translation problem based on the SMILES representation of molecules. We constructed a training dataset, relying on human metabolism data from publicly available databases, that we make publicly available in order to encourage further development. Due to the limited availability of metabolic data, we used transfer learning, from a molecular transformer17 pre-trained on general chemical reactions, to a model that is specifically tuned on human metabolic reactions. We further built an ensemble model to account for multiple and diverse metabolites. We evaluated our method specifically on predicting metabolites for drugs and compared it against three existing drug metabolite prediction tools (SyGMa,8 GLORYx,21 BioTransformer10).
2 Methodology
Our approach relies on transfer learning; we first pre-trained a transformer model on a set of chemical reactions and subsequently fine-tuned it on a dataset of human metabolic transformations as shown in Fig. 2. We additionally created an ensemble model which consists of multiple fine-tuned models. Each model takes as input the SMILES sequence of the input molecule and predicts the SMILES sequences of possible metabolites. The output of the ensemble is the union of the predictions from each model. In the following, we discuss the three main components of this work: (i) the datasets for pre-training, fine-tuning and testing the model, (ii) the training process, and, (iii) the ensemble model.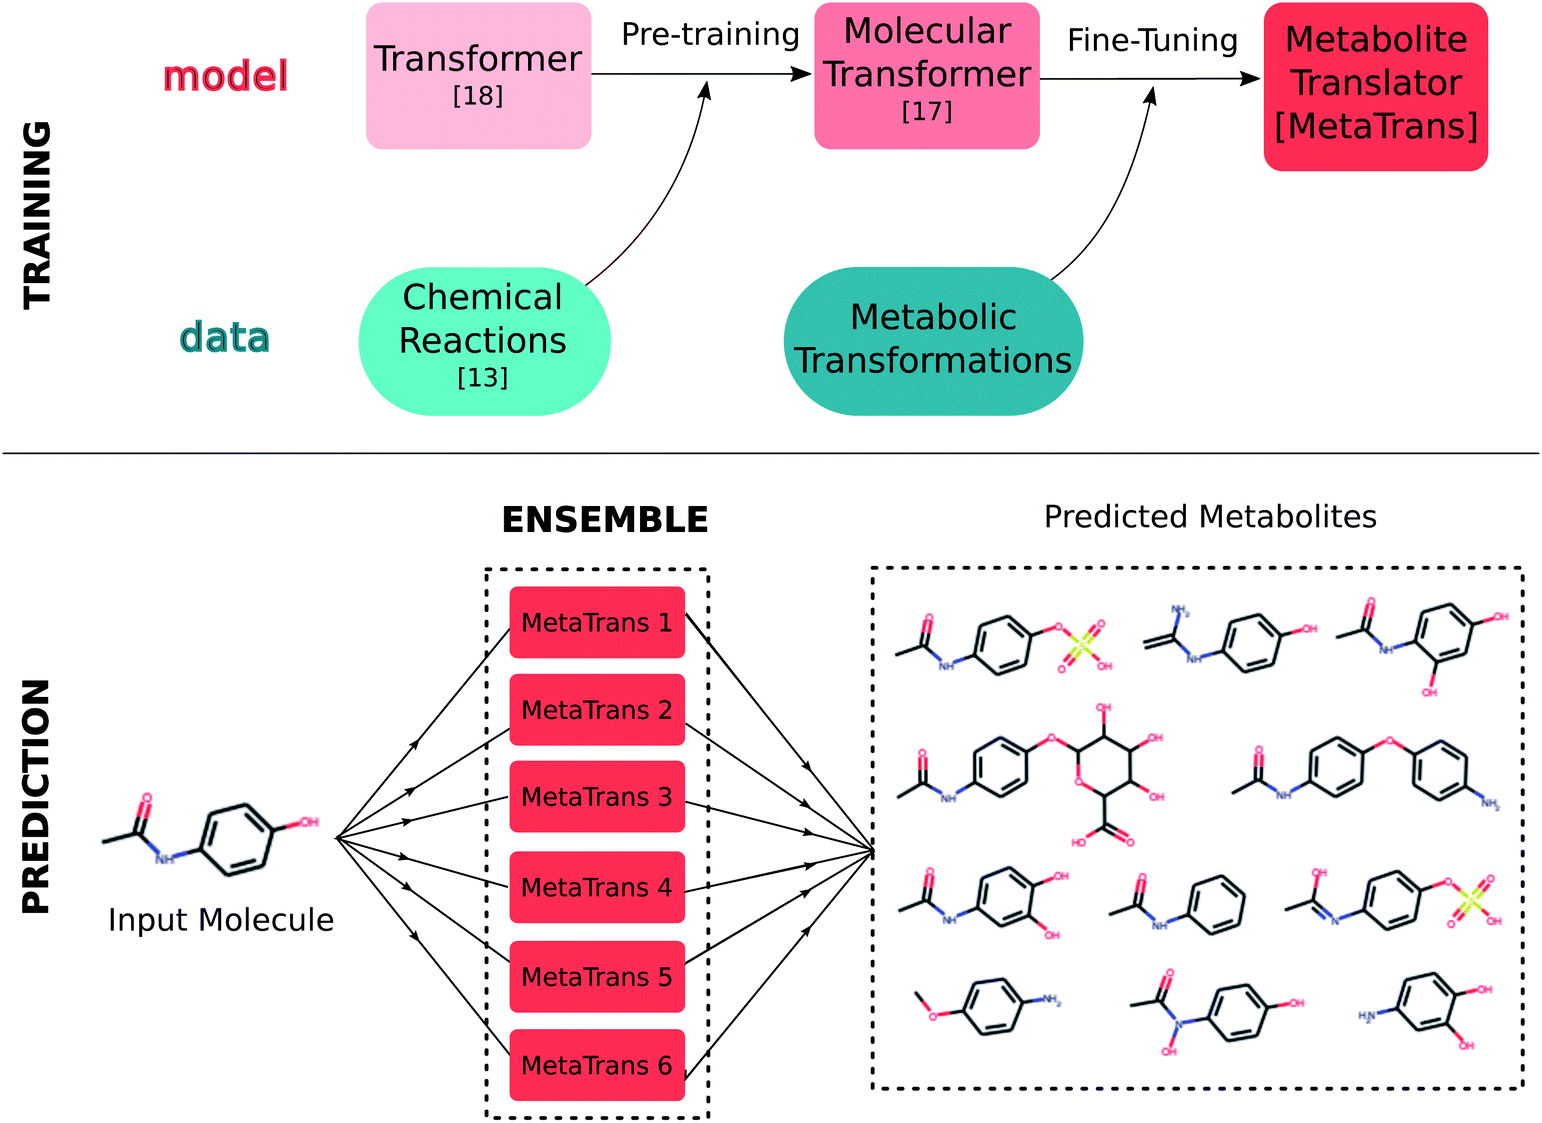 | ||
| Fig. 2 MetaTrans is derived through fine-tuning the molecular transformer on metabolic reactions. During inference, the ensemble MetaTrans model outputs the metabolites predicted by 6 fine-tuned models. | ||
2.1 Data
![[thin space (1/6-em)]](https://www.rsc.org/images/entities/char_2009.gif) 000 training instances.16 Molecules are represented using the canonical SMILES notation22 including stereochemistry information. For training the transformer model, the input sequence consisted of the reactants and reagents separated with a special token while the output sequence was the product molecule.
000 training instances.16 Molecules are represented using the canonical SMILES notation22 including stereochemistry information. For training the transformer model, the input sequence consisted of the reactants and reagents separated with a special token while the output sequence was the product molecule.
The databases from which we sourced the data are: DrugBank (version 5.1.5),23 Human Metabolome Database (HMDB) (version 4.0),24 HumanCyc from MetaCyc (version 23.0),25 Recon3D (version 3.01),26 the biotransformation database (MetXBioDB) of BioTransformer,10 and the reaction rules from SyGMa.8 More specifically, from DrugBank, we obtained pairs of parent molecules and human metabolites with the parent molecule being either a drug or a drug metabolite in the case of multi-step reactions. From HMDB we utilised all experimentally verified metabolites of either xenobiotics or endogenous compounds, excluding computationally predicted metabolites. From MetXBioDB we utilised all metabolic transformations. Regarding MetaCyc and Recon3D, which provide complete metabolic reactions mostly for endogenous compounds, we derived pairs of parent molecules and metabolites by retaining for each reaction all such pairs for which the common atoms exceed 40% of the atoms of the parent molecule. In the case of reactions indicated as reversible we created two training instances by reversing the reaction direction. Finally, we made use of the SyGMa8 rule database, which covers phase I and phase II drug metabolism, from which we derived valid pairs of parent molecules and metabolites. The rules in SyGMa are described using the SMIRKS language27 which is a SMILES-like language for generic reactions. The exact process for generating valid pairs from SMIRKS rules is described in the Data augmentation section. For processing the data we used the RDKit toolkit.28 In particular, we canonicalized SMILES and subsequently merged the data from the various sources and removed duplicates. The resulting dataset consists of about 11670 unique pairs of parent molecules and metabolites. The contribution of each source in the dataset, in terms of unique pairs of parent molecules and metabolites, is shown in Fig. 3a.
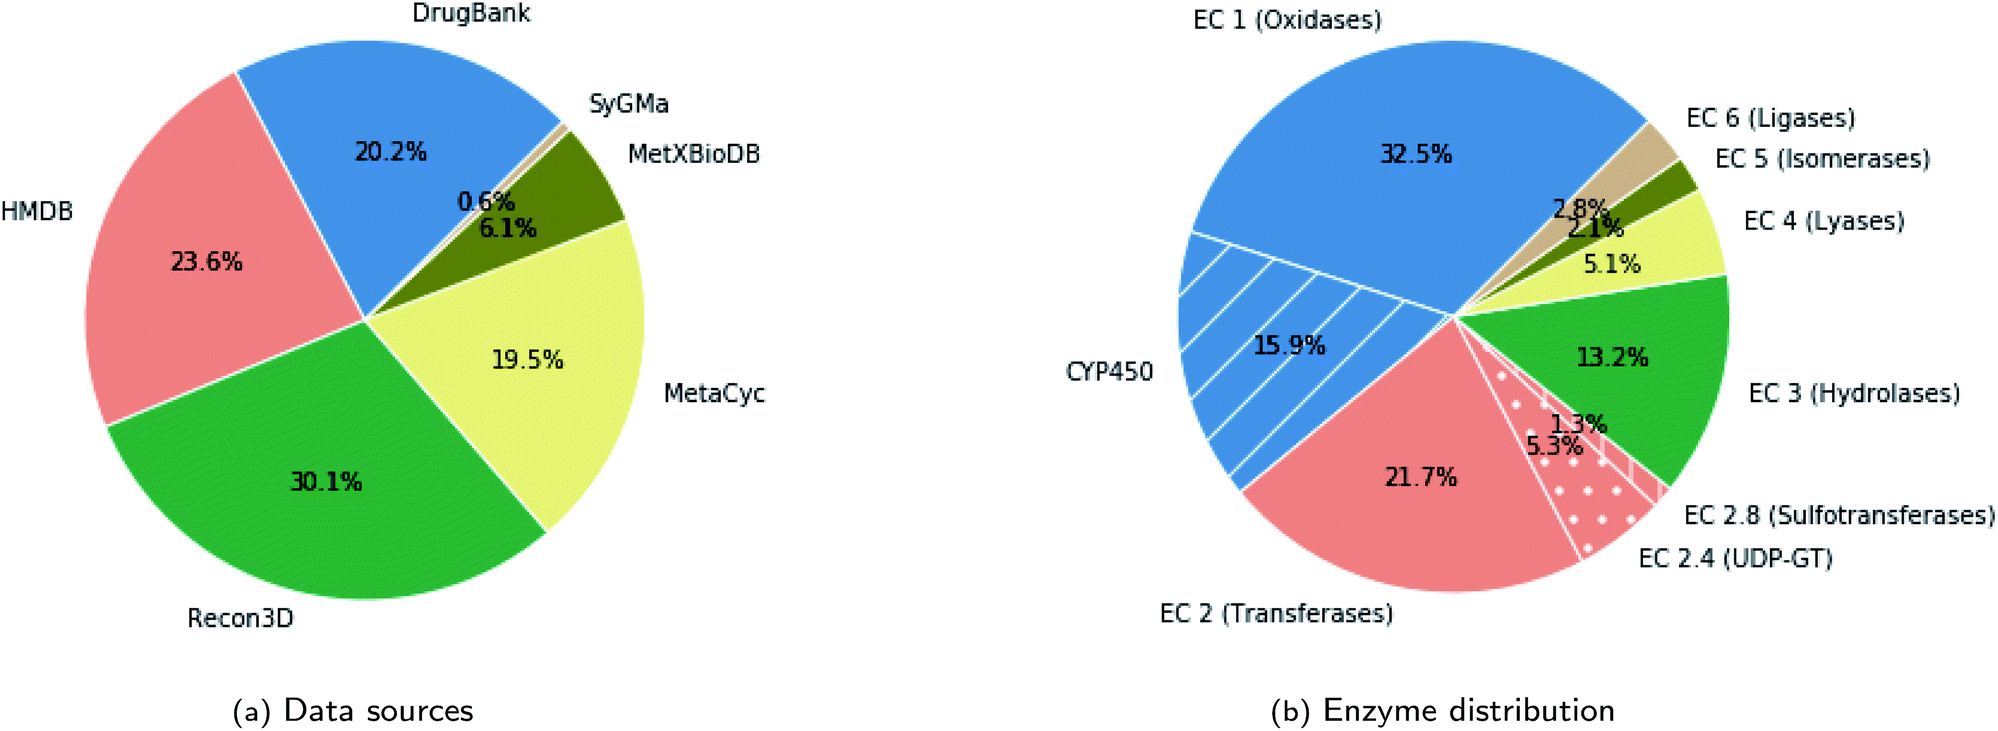 | ||
| Fig. 3 The composition of the dataset regarding (a) the data sources and (b) the metabolizing enzymes based on the EC classification (discarding the cases with no specified enzymes), in terms of pairs of parent molecules and metabolites. | ||
The metabolic transformations in the dataset span the full spectrum of enzymes and cover metabolism of xenobiotics and endogenous compounds. Although for a big part of the dataset (about 43%) the enzyme information is not specified in the source database, the distribution of enzymes among the labeled pairs, shown in Fig. 3b, indicates that all enzyme classes are covered. Metabolism of endogenous compounds was included to enhance the training set and obtain greater coverage of the enzymatic space. The evaluation was done specifically on predicting drug metabolites. The validation set, which was mainly intended for tuning the hyperparameters of the transformer model, consists also of drug molecules and drug metabolites. In particular, it consists of 100 parent molecules that we randomly sampled from the molecules derived from DrugBank with the constraint that it includes molecules that are metabolized by other than CYP450 enzymes in addition to the dominant CYP450 cases. Finally, we should note that since each parent molecule may yield multiple metabolites, the dataset includes cases that share the same parent molecule but differ in the resulting metabolites. However, we ensured that instances that share the same parent molecule were in the same data partition (training, validation, test).
As a final note, the dataset we constructed for fine-tuning does not include negative cases, that is molecules that are not metabolized in humans. Although technically it is possible to include cases for which the input sequence and the output sequence are identical, in practise it is not easy to obtain confirmed negative cases.
The resulting test set consists of 84 drugs with 217 verified metabolites which cover a wide range of enzymes. More specifically, the big majority of metabolites (127) correspond to phase I metabolism mainly through CYP450 but also other oxidasing enzymes. 29 metabolites are derived through transferase reactions of phase II metabolism from which 18 are metabolized by glucuronosyltransferases, also known as UDP-GT, (E.C. 2.4.1.17) and 7 are metabolized by sulfotransferases (E.C. 2.8.2.-). Finally, 9 metabolites are derived through hydrolases and for 53 cases the enzyme is not specified.
For the comparison between our method and existing tools we used only the GLORY test set of 29 drugs derived from the scientific literature and the additional 36 drugs that were recently added in DrugBank. The rest 19 drugs from DrugBank include common drugs (for example acetaminophen) which may have been used for the development of existing tools and therefore were excluded from the comparison.
2.2 Training
2.3 Generating multiple metabolites
An important challenge introduced when moving from reaction outcome prediction to metabolite prediction is the possibly multiple and diverse metabolites that can be formed through different enzymes, as shown in Fig. 1. To account for such diverse outcomes, on top of the standard beam search algorithm for generating multiple sequences, we constructed an ensemble model.2.4 Post-processing
The model output was filtered in order to discard invalid SMILES and unlikely metabolites. The first case refers to sequences which violate the syntax rules of the SMILES language (e.g., unbalanced parenthesis). The second case includes: (i) metabolites that have obtained atoms whose species are not among the parent molecule atoms or among the common atoms in organic molecules (C, O, H, S, P, N), (ii) metabolites whose size, in terms of atoms, is significantly smaller from the size of the parent molecule (less than 25%), and (iii) metabolites which exhibit low fingerprint similarity with respect to the parent molecule (less than 0.25). The cutoff values were determined based on the data of the validation set.As a side note, for the individual models the output size with a beam size of k will eventually be at most k since some predictions may be filtered-out. For the ensemble model though, the output size will be larger than k, since the output is the union of the 6 individual models.
3 Method evaluation
The evaluation of the method mainly lies on the number of correctly identified metabolites as well as the output size that is an indication of the number of false positives. In order to assess the ability of the algorithm to properly rank the generated metabolites we present results for beam sizes of 2, 5, 10, and 15. For the evaluation of the method, we compared the predicted metabolites against the reference metabolites using fingerprint similarity. If the fingerprint similarity (based on Tanimoto coefficient) between a predicted metabolite and a reference metabolite is equal to 1 then we consider the prediction as correct. Fingerprint similarity is chosen over SMILES comparison because it discards discrepancies in stereochemistry and atom charges and in general does not depend on the syntax of the language used to represent molecules.3.1 Baseline model
As a reference point, we tested the performance of the pre-trained model on the metabolite test set prior to fine-tuning on the metabolic data. With a beam size of 15, the model identified 49 metabolites in total out of 217 with an output size of 768 which corresponds to a specificity value of about 6% and recall 22%. Interestingly, the pre-trained model retrieved only metabolites through oxidising enzymes and hydrolases while it did not predict any metabolites through transferase reactions. This outcome demonstrates the differences between the two datasets used for pre-training and fine-tuning the model. The set of chemical reactions includes complete reactions where all reactants and products are listed (with possibly trivial compounds missing). On the other side, the dataset for fine-tuning consists of pairs of parent molecules and metabolites. Oxidation reactions and certain hydrolysis reactions involve only one major compound and therefore their representation in the two datasets will be very similar. However, for transferase reactions, the added structure is not encoded in the input of the model. The pre-trained model cannot handle such cases since it has been trained only on complete reactions where all reactants are listed.3.2 Prediction accuracy
To start with, we assessed the benefit of transfer learning as well as ensembling by juxtaposing the performance of the pre-trained model, the averaged prediction performance of the individual fine-tuned models that comprise the ensemble, and the ensemble model, in Table 1. The models are compared for similar output sizes which are obtained with beam size of 15 for the individual models and beam size of 5 for the ensemble. The results highlight the significance of both practises, transfer learning and ensembling. More specifically, on average, the fine-tuned model performed significantly better than the model pre-trained on general chemical reactions. Additionally, the ensemble model achieved a significantly higher recall rate than the average individual model. This shows that ensembling is a better strategy for increasing the output diversity comparing to a further increase in the beam size of a single model.| Model | Output size | At least one metabolite (%) | At least half metabolites (%) | All metabolites (%) | Total identified metabolites | Precision (%) | Recall (%) |
|---|---|---|---|---|---|---|---|
| Pre-trained (beam 15) | 9.1 | 39.3 | 27.4 | 13.1 | 49 | 6.4 | 22.6 |
| Average (beam 15) | 9.3 ± 0.4 | 78.8 ± 4.6 | 61.7 ± 5.7 | 33.1 ± 4.1 | 102.3 ± 8.0 | 13.1 ± 0.8 | 47.2 ± 3.7 |
| Ensemble (beam 5) | 10.2 | 90.5 | 77.4 | 42.9 | 125 | 14.5 | 57.6 |
Next, we evaluated the prediction accuracy of the ensemble model. We report the results with varying choices of beam size in order to assess its ranking capability, as shown in Table 2. The results show that with a beam size of 5, which corresponds to 10 predictions per input molecule on average, the ensemble model identified at least one metabolite for about 90% of the drugs (76 out of 84) while it successfully retrieved more than half of the verified metabolites (recall 57.6%). Even within the top-5 ranked metabolites, which is achieved with a beam size of 2, the model correctly predicted at least one correct metabolite for 77.4% of the drugs. Increasing the beam size to 10, which is equivalent to top-20 predictions, the model retrieved at least half of known metabolites for about 82% of the drugs (69 out of 84) at a cost of a decrease in precision (8.3%). Further increase of the beam size allowed the model to increase the recall rate to about 68%, with an output size of almost. For practical applications, a beam size between 5 and 10 seems to provide a good trade-off between precision and recall.
| Beam size | Average out. size | At least one metabolite | At least half metabolites | All metabolites | Total identified metabolites | Precision | Recall |
|---|---|---|---|---|---|---|---|
| 2 | 5.0 | 77.4 | 60.7 | 27.4 | 93 | 22.2 | 42.9 |
| 5 | 10.2 | 90.5 | 77.4 | 42.9 | 125 | 14.5 | 57.6 |
| 10 | 20.0 | 91.7 | 82.1 | 45.2 | 139 | 8.3 | 64.1 |
| 15 | 29.0 | 94.0 | 84.5 | 48.8 | 147 | 6.0 | 67.7 |
A closer look of the results revealed that the model achieved better scores specifically on the test cases that were obtained from DrugBank comparing to the data from the GLORY set, as shown in Table 3. More specifically, the model retrieved all known metabolites for almost half of the drugs derived from DrugBank, while this was the case for about 35% of the drugs from the GLORY set. The most plausible explanation behind this discrepancy is that the GLORY data, which were derived from the literature, include a more exhaustive list of metabolites as compared to the data derived from DrugBank. Indeed, the average number of metabolites per drug for the GLORY test set is 3.3 while for DrugBank is 2.1. This highlights the difficulty for obtaining reliable datasets for assessing computational tools for drug metabolites prediction. Although an exhaustive list of metabolites may seem more desirable, it does not allow to differentiate between major and secondary metabolites.
| Dataset | At least one metabolite (%) | At least half metabolites (%) | All metabolites (%) |
|---|---|---|---|
| Glory | 93.1 | 65.5 | 34.5 |
| DrugBank | 89.1 | 83.6 | 47.3 |
| All | 90.5 | 77.4 | 42.9 |
3.3 Comparison with existing tools
Next, we assessed the performance of the ensemble model using as reference three existing rule-based drug metabolism prediction tools: GLORYx,21 BioTransformer10 and SyGMa.8 All methods were evaluated for predicting metabolites through one-step reactions. GLORYx and SyGMa are both based on rule databases that cover specifically phase I and II metabolism of xenobiotics. BioTransformer has greater coverage and multiple operation options intended for covering different enzyme families. For the purpose of this comparison, we used the module that covers human and human gut microbial transformations (allHuman). Theoretically, MetaTrans and BioTransformer are expected to have similar and greater coverage, while GLORYx and SyGMa are both specific to oxidation and transferase reactions.The test set for the comparison consisted of 65 drugs with a total of 179 metabolites. We compared the four methods taking into account the number of metabolites they correctly identified, the output size as well as their ranking capability. GLORYx and SyGMa do rank the predicted metabolites while BioTransformer does not. In the case of MetaTrans, although the generated metabolites are not strictly ranked, the output size can be controlled through the beam size. We compared the top-5, 10, 13 and 20 performance between MetaTrans, GLORYx and SyGMa. The top-13 performance is selected for providing a fair comparison with BioTransformer whose average output size on the specific test set was 13. For the ensemble model, top-5, 10, 13 and 20 were achieved with beam sizes of 2, 5, 7 and 10, respectively. All methods were evaluated using fingerprint similarity.
The results, as presented in Table 4, demonstrate that although MetaTrans was trained on a general dataset not specific to drugs, its performance is not compromised when compared to models that have been specifically developed for drug metabolism. Indeed, MetaTrans shows better ranking capability when compared with GLORYx and similar ranking performance with SyGMa. Within the top-5 predictions, MetaTrans and SyGMa both correctly identified in total 76 metabolites while GLORYx identified 54. Focusing at MetaTrans and SyGMa, although they identified the same number of metabolites, the identified metabolites are differently distributed among the drugs with MetaTrans having larger coverage of the dataset, that is finding at least one correct metabolite for a larger portion of the dataset. A similar pattern is observed within the top-10 predictions with MetaTrans and SyGMa correctly predicting a similar number of metabolites while MetaTrans being able to predict at least one metabolite, or even half, for a larger number of drugs. For the top-13 predictions, SyGMa and BioTransformer both retrieved the highest number of metabolites. However, still MetaTrans predicts at least one correct metabolite, and even half of known metabolites, for a larger number of drugs. In the top-20 ranked metabolites, GLORYx significantly expanded its search surpassing MetaTrans and SyGMa. Overall though, MetaTrans was among the best performed tools when looking at about 10 highly ranked metabolites which is a reasonable choice in practical applications. Additionally, it gave at least one correct prediction for a larger portion of the dataset.
| Method | At least one metabolite (%) | At least half metabolites (%) | All metabolites (%) | Total identified metabolites | Output size | Precision (%) | Recall (%) | |
|---|---|---|---|---|---|---|---|---|
| Top 5 | MetaTrans | 80.0 | 61.5 | 29.2 | 76 | 324 | 23.5 | 42.5 |
| GLORYx | 64.6 | 35.4 | 16.9 | 54 | 325 | 16.6 | 30.2 | |
| SyGMa | 72.3 | 55.4 | 29.2 | 76 | 325 | 23.4 | 42.4 | |
| Top 10 | MetaTrans | 95.4 | 80.0 | 44.6 | 103 | 687 | 15.0 | 57.5 |
| GLORYx | 80.0 | 64.6 | 27.7 | 93 | 650 | 14.3 | 51.9 | |
| SyGMa | 87.7 | 75.4 | 43.1 | 105 | 650 | 16.2 | 58.7 | |
| Top 13 | MetaTrans | 95.4 | 81.5 | 46.2 | 109 | 908 | 12.0 | 60.9 |
| GLORYx | 86.2 | 76.9 | 41.5 | 108 | 851 | 12.8 | 60.3 | |
| SyGMa | 89.2 | 78.5 | 44.6 | 115 | 842 | 13.6 | 64.2 | |
| BioTransformer | 87.7 | 78.5 | 44.6 | 115 | 842 | 13.5 | 64.2 | |
| Top 20 | MetaTrans | 96.9 | 86.2 | 46.2 | 116 | 1334 | 8.7 | 64.8 |
| GLORYx | 92.3 | 86.2 | 52.3 | 132 | 1259 | 10.5 | 73.7 | |
| SyGMa | 90.8 | 84.6 | 49.2 | 127 | 1284 | 9.9 | 70.9 |
We further broke down the performance of each method looking into the different enzyme families as shown in Table 5. The test set included the 65 drugs with 179 metabolites while the analysis for the full set of 85 drugs, for beam sizes of 5, 7 and 10, is provided in ESI: S4.† The enzyme families that were considered are oxidation enzymes, with the CYP450 being the most prevalent, transferases, with UDP-GT and sulfotransferases being the most prevalent, and hydrolases. As we can see, the advantage that BioTransformer and SyGMa obtained relates to oxidation reactions. However, they missed some metabolites through transferases that MetaTrans correctly identified. Overall though, all methods seem to be able to cover all enzyme classes. Interestingly, SyGMa and GLORY, which are specific to phase I and phase II metabolism, correctly identified a number of hydrolase metabolites possibly due to the promiscuous activity of enzymes.
| Oxidation | UDP-GT | Sulfo-transferases | Other Trasferases | Hydrolases | Unspecified | All | |
|---|---|---|---|---|---|---|---|
| Total | 118 | 11 | 4 | 3 | 6 | 37 | 179 |
| MetaTrans | 70 | 7 | 3 | 2 | 4 | 23 | 109 |
| GLORYx | 70 | 8 | 3 | 1 | 4 | 22 | 108 |
| SyGMa | 80 | 8 | 2 | 0 | 5 | 20 | 115 |
| BioTransformer | 81 | 7 | 2 | 0 | 5 | 20 | 115 |
Regarding MetaTrans, the large variety of the training set allowed the model to predict metabolites through any enzyme. More importantly, it performed equally well on the major enzyme classes of phase I and phase II metabolism while it additionally identified metabolites through enzymes that are less commonly involved in drug metabolism and were missed by other tools. More specifically, MetaTrans identified two additional metabolites through transferases which are less common in drug metabolism. One of these cases is the drug apomorphine which is metabolized through a methyltransferase (EC 2.1.1.6) into the metabolite apocodeine (Fig. 4a) which is an active compound.33,34 This metabolite was also identified by GLORYx but not by the other two tools. The second case, which was identified only by MetaTrans, is the metabolite of the drug Fingolimond (Fig. 4b) which is derived through phosphorylation (EC 2.7.1.91) and is also an active metabolite.35 Another even more interesting case is the drug favipiravir (Fig. 4c). DrugBank provides the structure of a metabolite that is obtained through oxidation and it additionally states that the drug undergoes glucuronidation without providing the structure of the metabolite though. MetaTrans correctly predicted the oxidation metabolite and it also gave as output glucuronidation metabolites resulting from conjugations in two different positions (one of them depicted in Fig. 4c). Interestingly, among the predicted metabolites we noticed a ribosylated metabolite and a metabolite which was additionally phosphorylated (Fig. 4c) which we both confirmed from the literature.36 Indeed, favipiravir is a prodrug which is ribosylated through intracellural metabolism and subsequently phosphorylated in three subsequent steps, forming a triphosphate which is the active compound with antiviral activity.36 MetaTrans did not identify the triphosphate but it identified the one-step ribosylated metabolite as well as the two-step phosphorylated metabolite although it was trained only on single-step reactions. Favipiravir is a very interesting case because it is metabolized through an uncommon reaction for drugs and additionally it is conjugated with a structure of significant complexity contrary, for example, to the apomorphine metabolite. Despite that, MetaTrans correctly identified the metabolite and additionally a two-step metabolite. The other tools correctly identified the oxidized metabolite and all predicted glucuronidation metabolites but none of them predicted the ribosylation. These cases demonstrate that MetaTrans can identify metabolites through uncommon enzymes and reactions which may be missed by rule-based approaches including BioTransformer which is expected to have greater coverage than tools that are focused on phase I and phase II metabolism.
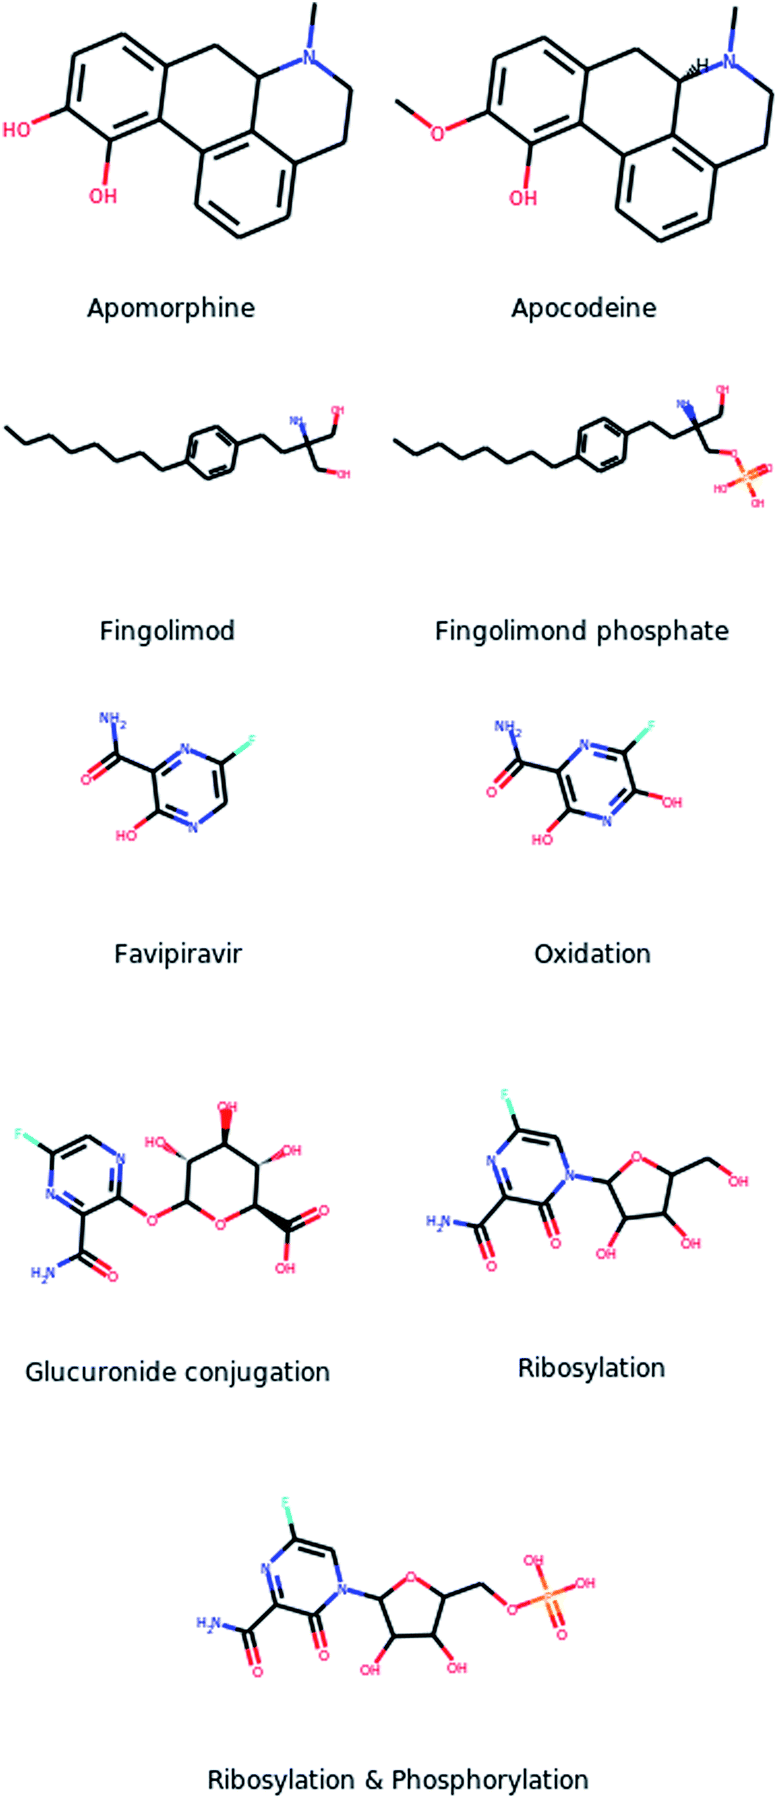 | ||
| Fig. 4 Correctly identified metabolites through uncommon enzymes. | ||
Finally, although our method was not trained on negative cases, that is non metabolizing drugs, we applied our method, as well as the other tools, on a dataset of 74 drugs which, according to DrugBank, are not metabolized in humans. For MetaTrans, we investigated whether the parent structure was among the predictions. Our analysis showed that for the dataset of non-metabolizing drugs the parent structure was found among the predicted structures for 51.4% of the cases within the top-5 predictions. For the dataset of metabolizing drugs, this percentage corresponds to 42.4%. The ability of MetaTrans to identify non-metabolizing drugs seems to be limited especially considering that it intentionally gives a diverse output, mostly through ensembling, and therefore the unchanged structure of the drug will be among multiple predicted metabolites. However, the capacity of the other three tools to identify the non-metabolizing tools was also limited. More details in ESI: S6.† As a final note, we noticed that, in the dataset of non metabolizing drugs, GLORYx was not able to make predictions for cases that included rare atoms (such as B and Gd). The development of GLORY involved machine learning, and hence it cannot handle compounds that include atoms that have not been seen during training.9 On the contrary, MetaTrans although it is a strictly learning-based method, it was able to predict metabolites for these cases. Although it is possible that the specific atoms were not seen during fine-tuning, the model was pre-trained on a very large and diverse dataset of chemical reactions which include atoms that are not restricted to the ones found in organic molecules.
4 Challenging cases
For a better understanding of the capabilities and limitations of the proposed methodology we visually inspected the predicted metabolites for the test set of metabolizing drugs. A few representative cases of the model mispredictions are presented in Fig. 5. | ||
| Fig. 5 Drug structure, actual metabolite and closest prediction for a small number of challenging test cases. | ||
For certain cases, the discrepancy between the reference metabolite and the closest prediction was limited to a single atom. Such an example is the drug tedizolid (case 1 in Fig. 5). For that particular case, the error could be even be in the reference metabolite. Indeed, for a difference case, which involved glucuronidated metabolites, we found evidence in the literature which verified the predicted metabolites providing slightly different structures than the ones found in DrugBank.37
In general, our inspection revealed various problems that relate to transferase reactions, however, in most cases the predicted metabolites appeared to be at least relevant. We recall here that transferase reactions are expected to be challenging cases for our method since there are not such cases in the dataset used for pre-training and they are under-represented in the dataset used for fine-tuning (Fig. 3b). For certain cases the structure of the glucuronic acid was not entirely correct or the conjugation point was not correctly identified. Such an example is the drug lamotrigine (case 2) where both problems coexist. In many cases we noticed that the model predicted conjugations with both, glucuronic acid and sulfate, for the same molecule, even for cases where the reference metabolites included only one of them. Indeed, from our dataset we noticed that conjugations with these two structures usually occur for the same molecule. In other cases, the model missed a glucuronidation metabolite for a sulfation or the opposite. An especially challenging case for the model is the case of metabolites that are derived through multiple transformations at different sites. Such examples are the drugs tamezapam and umifenovir (cases 3 and 4). In both cases the metabolites are derived through a conjugation and an oxidation reaction possibly in multiple reaction steps. The model correctly identified the reaction type (conjugation) as well as the conjugation site but did not predict the simultaneous oxidation reaction.
Regarding oxidation reactions, a common problem was that in certain cases although the model correctly identified the position and the reaction type, the predicted structure was not entirely correct. Such examples are the drugs ciprofloxacin and metoclopramide (cases 5 and 6). Specifically in the case of Ciprofloxacin the reference metabolite is an aldehyde while the predicted molecule is the corresponding carboxylic acid. According to the literature, aldehydes usually are intermediate compounds which are further oxidized forming carboxylic acids by CYP450 enzymes.38 However, we did not make such assumptions for our evaluation. Especially for the case of ciprofloxacin, DrugBank did not specify where the drug was oxidized by a CYP450 enzyme.
Overall, our inspection showed that for many of the cases where the predicted metabolites did not exactly match the reference ones, the prediction still provided useful information. More specifically, the predictions in many cases succeeded in providing insights on the reaction type or even the reaction site in the parent molecule.
5 Invalid predictions and post-processing
Besides the prediction accuracy of the model, we finally evaluated two additional aspects: first, how susceptible the model is for generating invalid SMILES, and, second what is the effect of the post-processing filtering. Our analysis showed that the model generated at least one valid SMILES for all drugs in both, validation and test sets, for all beam sizes. Specifically regarding the test set of 84 drugs, the number of atoms ranged from 8 to 62 with an average of 24.6. The average number of invalid predictions per input molecule for a beam size of 5 was 0.9, and 2.5 for a beam size of 10. These findings indicate that the issue of generating non-valid SMILES is insignificant for small molecules. Regarding the effect of the post-processing filtering, our analysis showed that a very small percentage of the predicted molecules was filtered out proving that the big majority of the predictions are actually relevant. More specifically, for a beam size of 10, only 5 predictions were filtered out in total which corresponds to about 0.3% of the total predictions. More detailed information in ESI: S5.†6 Conclusions
We presented an end-to-end learning-based method, called MetaTrans, for predicting human metabolites of small molecules. MetaTrans consists of a model that was trained using transfer learning on a diverse dataset of human metabolic reactions. We evaluated the performance of our method for predicting drug metabolites and compared it against existing rule-based drug metabolite prediction tools. Our analysis showed that despite the fact that our model was trained on a dataset that is not specific to drugs its performance was comparable with methods that were specifically developed for drugs. In fact it is the diversity of the dataset that allowed the model to predict metabolites not only through the major enzyme families but also through uncommon enzymes which were missed by the existing rule-based approaches. The proposed approach can provide a more comprehensive study of drug metabolism comparing to the existing rule-based methods, which are enzyme-specific, while it additionally addresses the problems of limited scalability and lack of generalization. As more data become available, especially on drug metabolism, the performance of this approach can be further improved encouraging the adoption of such tools in drug discovery for accelerating and enhancing safety studies.7 Data availability
The datasets and running code are available at: https://github.com/KavrakiLab/MetaTrans.Conflicts of interest
The authors declare no conflicts of interest.Acknowledgements
The authors thank the reviewers for the very thorough evaluation of the manuscript and constructive feedback, Dr Teodoro Laino for his thorough and constructive comments on the manuscript, and Dr George Bennett and Dr Matthew Peña for providing insights on the underlying biological processes. This work has been supported in part by CPRIT RP170508 and Rice University Funds.Notes and references
- E. Croom, Toxicology and Human Environments, Academic Press, 2012, vol. 112, pp. 31 – 88 Search PubMed.
- B. Testa, A. Pedretti and G. Vistoli, Drug Discovery Today, 2012, 17, 549–560 CrossRef CAS.
- F. P. Guengerich, Drug Metab. Pharmacokinet., 2011, 26(1), 3–14 CrossRef CAS.
- J. Kirchmair, A. H. Göller, D. Lang, J. Kunze, B. Testa, I. D. Wilson, R. C. Glen and G. Schneider, Nat. Rev. Drug Discov., 2015, 387–404 CrossRef CAS.
- J. D. Tyzack and J. Kirchmair, Chem. Biol. Drug Des., 2019, 377–386 CrossRef CAS.
- S. R. Kazmi, R. Jun, M.-S. Yu, C. Jung and D. Na, Comput. Biol. Med., 2019, 106, 54–64 CrossRef CAS.
- N. T. Issa, H. Wathieu, A. Ojo, S. W. Byers and S. Dakshanamurthy, Curr. Drug Metab., 2016, 18, 556–565 Search PubMed.
- L. Ridder and M. Wagener, ChemMedChem, 2008, 3, 821–832 CrossRef CAS.
- C. de Bruyn Kops, C. Stork, M. Sicho, N. Kochev, D. Svozil, N. Jeliazkova and J. Kirchmair, Front. Chem., 2019, 7, 402 CrossRef.
- Y. Djoumbou-Feunang, A. Fiamoncini, J. Gil-de-la-Fuente, R. Greiner, C. Manach and D. S. Wishart, J. Cheminf., 2019, 11(2), 2–25 Search PubMed.
- T. D. Salatin and W. L. Jorgensen, J. Org. Chem., 1980, 45, 2043–2051 CrossRef CAS.
- H. Satoh and K. Funatsu, J. Chem. Inf. Comput. Sci., 1995, 35, 34–44 CrossRef CAS.
- P. Röse and J. Gasteiger, Anal. Chim. Acta, 1990, 235, 163–168 CrossRef.
- D. M. Lowe, Extraction of chemical structures and reactions from the literature, Ph.D. thesis, University of Cambridge, 2012.
- C. W. Coley, W. Jin, L. Rogers, T. F. Jamison, T. S. Jaakkola, W. H. Green, R. Barzilay and K. F. Jensen, Chem. Sci., 2019, 10, 370–377 RSC.
- P. Schwaller, T. Gaudin, D. Lányi, C. Bekas and T. Laino, Chem. Sci., 2018, 9, 6091–6098 RSC.
- P. Schwaller, T. Laino, T. Gaudin, P. Bolgar, C. A. Hunter, C. Bekas and A. A. Lee, ACS Cent. Sci., 2019, 5, 1572–1583 CrossRef CAS.
- J. Nam and J. Kim, Linking the Neural Machine Translation and the Prediction of Organic Chemistry Reactions, 2016 Search PubMed.
- A. Vaswani, N. Shazeer, N. Parmar, J. Uszkoreit, L. Jones, A. N. Gomez, L. u. Kaiser and I. Polosukhin, Advances in Neural Information Processing Systems 30, 2017, pp. 5998–6008 Search PubMed.
- G. Pesciullesi, P. Schwaller, T. Laino and J.-L. Reymond, Carbohydrate Transformer: Predicting Regio- and Stereoselective Reactions Using Transfer Learning, 2020, https://chemrxiv.org/articles/Carbohydrate_Transformer_Predicting_Regio–_and_Stereoselective_Reactions_Using_Transfer_Learning/11935635/1 Search PubMed.
- C. de Bruyn Kops, M. šícho, A. Mazzolari and J. Kirchmair, Chem. Res. Toxicol. Search PubMed.
- D. Weininger, A. Weininger and J. L. Weininger, J. Chem. Inf. Comput. Sci., 1989, 29, 97–101 CrossRef CAS.
- D. S. Wishart, Y. D. Feunang, A. C. Guo, E. J. Lo, A. Marcu, J. R. Grant, T. Sajed, D. Johnson, C. Li, Z. Sayeeda, N. Assempour, I. Iynkkaran, Y. Liu, A. Maciejewski, N. Gale, A. Wilson, L. Chin, R. Cummings, D. Le, A. Pon, C. Knox and M. Wilson, Nucleic Acids Res., 2017, 46, D1074–D1082 CrossRef.
- D. S. Wishart, Y. D. Feunang, A. Marcu, A. C. Guo, K. Liang, R. Vázquez-Fresno, T. Sajed, D. Johnson, C. Li, N. Karu, Z. Sayeeda, E. Lo, N. Assempour, M. Berjanskii, S. Singhal, D. Arndt, Y. Liang, H. Badran, J. Grant, A. Serra-Cayuela, Y. Liu, R. Mandal, V. Neveu, A. Pon, C. Knox, M. Wilson, C. Manach and A. Scalbert, Nucleic Acids Res., 2017, 46, D608–D617 CrossRef.
- R. Caspi, R. Billington, C. A. Fulcher, I. M. Keseler, A. Kothari, M. Krummenacker, M. Latendresse, P. E. Midford, Q. Ong, W. K. Ong, S. Paley, P. Subhraveti and P. D. Karp, Nucleic Acids Res., 2017, 46, D633–D639 CrossRef.
- E. Brunk, S. Sahoo, D. C. Zielinski, A. Altunkaya, A. Drager, N. Mih, F. Gatto, A. Nilsson, G. A. P. Gonzalez, M. K. Aurich, A. Prlic, A. Sastry, A. D. Danielsdottir, A. Heinken, A. Noronha, P. W. Rose, S. K. Burley, R. M. T. Fleming, J. Nielsen, I. Thiele and B. O. Palsson, Nat. Biotechnol., 2018, 36, 272–281 CrossRef CAS.
- SMIRKS, A reaction transform language, https://daylight.com/dayhtml/doc/theory/theory.smirks.html Search PubMed.
- RDKit, Open-Source Cheminformatics Software, https://www.rdkit.org/ Search PubMed.
- G. Maggiora, M. Vogt, D. Stumpfe and J. Bajorath, J. Med. Chem., 2014, 57, 3186–3204 CrossRef CAS.
- E. J. Bjerrum, CoRR, 2017, abs/1703.07076 Search PubMed.
- J. Arús-Pous, S. Johansson, O. Prykhodko, E. J. Bjerrum, C. Tyrchan, J. Reymond, H. Chen and O. Engkvist, J. Cheminformatics, 2019, 11, 71:1–71:13 Search PubMed.
- Molecular Transformer - Git repository, https://github.com/pschwllr/MolecularTransformer Search PubMed.
- R. van der Geest, T. van Laar, P. P. Kruger, J. M. Gubbens-Stibbe, H. E. Bodde, R. A. Roos and M. Danhof, Clin. Neuropharmacol., 1998, 21, 159–168 CAS.
- S. Lal, T. L. Sourkes, K. Missala and G. Belendiuk, Eur. J. Pharmacol., 1972, 20, 71–79 CrossRef CAS.
- O. David, J. Kovarik and R. Schmouder, Clin. Pharmacokinet., 2012, 51, 15–28 CrossRef CAS.
- S. L. Bixler, T. M. Bocan, J. Wells, K. S. Wetzel, S. A. Van Tongeren, N. L. Garza, G. Donnelly, L. H. Cazares, V. Soloveva, L. Welch, C. Epstein, L.-F. Liang, D. Giesing, R. Lenk, S. Bavari and T. K. Warren, Antiviral Res., 2018, 151, 50–54 CrossRef CAS.
- D. Izgelov, I. Cherniakov, G. Aldouby Bier, A. J. Domb and A. Hoffman, Mol. Pharm., 2018, 15, 1548–1555 CrossRef CAS.
- F. P. Guengerich, C. D. Sohl and G. Chowdhury, Arch. Biochem. Biophys., 2011, 507, 126–134 CrossRef CAS.
Footnote |
| † Electronic supplementary information (ESI) available: (1) Data preparation, (2) models hyperparameters, (3) evaluation on training and validation sets, (4) evaluation per enzyme class, (5) effect of invalid predictions and post-processing, and (6) additional experimentation. See DOI: 10.1039/d0sc02639e |
| This journal is © The Royal Society of Chemistry 2020 |