 Open Access Article
Simultaneous detection of small molecules, proteins and microRNAs using single molecule arrays†
Xu
Wang
 ab and
David R.
Walt
 *ab
*ab
aWyss Institute for Biologically Inspired Engineering, Harvard University, Boston, MA 02115, USA. E-mail: dwalt@bwh.harvard.edu; Tel: +1-8573071112
bDepartment of Pathology, Brigham and Women's Hospital, Harvard Medical School, Boston, MA 02115, USA
First published on 8th July 2020
Abstract
Biological samples such as blood, urine, cerebrospinal fluid and saliva contain a large variety of proteins, nucleic acids, and small molecules. These molecules can serve as potential biomarkers of disease and therefore, it is desirable to simultaneously detect multiple biomarkers in one sample. Current detection techniques suffer from various limitations including low analytical sensitivity and complex sample processing. In this work, we present an ultrasensitive method for simultaneous detection of small molecules, proteins and microRNAs using single molecule arrays (Simoa). Dye-encoded beads modified with specific capture probes were used to quantify each analyte. Multiplex competitive Simoa assays were established for simultaneous detection of cortisol and prostaglandin E2. In addition, competitive and sandwich immunoassays were combined with a direct nucleic acid hybridization assay for simultaneous detection of cortisol, interleukin 6 and microRNA 141. The multi-analyte Simoa assay shows high sensitivity and specificity, which provides a powerful tool for the analysis of many different samples.
1. Introduction
The ability to detect and analyze proteins such as cytokines and toxins, nucleic acids including DNA and RNA, and other analytes such as small-molecule hormones, antibiotics, organic pollutants, pesticide and veterinary drug residues, and mycotoxins, is important for many applications including clinical diagnostics, physiological function research, drug discovery, and environmental and food analysis.1,2 Current detection methods in clinical and research laboratories rely upon different measurement techniques such as immunoassays, polymerase chain reaction (PCR), and mass spectrometry to detect these analytes.3,4 Many studies have demonstrated that disease biomarkers, such as small molecules, proteins, DNA and microRNAs, regulate biological processes in a highly interactive manner.5–7 Thus, simultaneous analysis of multiple biomarkers in a single sample can provide more information for the accurate diagnosis and treatment of diseases.In recent years, a number of multiplexing technologies have been developed for the detection of multiple small molecules, proteins and nucleic acids.8,9 The most widely used encoding strategies include fluorescence labeling, spatial separation using planar arrays, and isobaric labeling for mass spectrometry.10–12 In contrast to conventional single-plex techniques, multiplexing technologies have rendered the detection of multiple biomarkers more efficient by increasing the amount of biological information obtained from a sample. In addition, a multiplex assay can be performed with smaller sample volumes compared to the detection of each target individually. This feature is particularly important for cases in which sample volumes are limited, such as with cerebrospinal fluid (CSF) or infant blood samples. However, for simultaneous detection of multiple analytes, especially different classes of analytes, it is difficult to establish a universal platform because the detection methods and optimal assay conditions for each analyte are typically different.13,14 Furthermore, many potentially useful small-molecule, protein or nucleic acid biomarkers in biological samples such as blood, saliva, or other biofluids exist at concentrations well below the detection limits of current methods, necessitating the development of more sensitive technologies.15,16
To overcome limitations in analytical sensitivity, our laboratory developed an ultrasensitive digital detection platform based on single molecule arrays (Simoa).17,18 In Simoa, target analyte molecules are first captured on biofunctionalized paramagnetic beads. A large excess of beads are used relative to the number of target analyte molecules to ensure that there is either zero or one target analyte molecule bound per bead following Poisson statistics. A biotinylated detection probe binds to the captured target analyte molecule, and the formed complex is then labeled with streptavidin-β-galactosidase (SβG). The enzyme-labeled beads are resuspended in a fluorogenic substrate solution, resorufin-β-D-galactopyranoside (RGP), and loaded onto an array of microwells (50 fL) in which each well is able to hold only one bead. The wells are sealed with oil and the fluorescent product generated by the enzymatic reaction is confined within the microwells, ensuring high local fluorescence intensity that can be easily detected by a charge coupled device (CCD) camera.19,20 The Simoa technique has been previously utilized for ultra-sensitive detection of proteins, DNA and microRNAs, and multiplex assays have been developed for the detection of multiple proteins and microRNAs.21–25 Moreover, this technique has been used for the detection of small molecules by combining the Simoa assay with a competitive immunoassay, but only single-plex measurements were conducted.26 In addition, digital immunoassays using droplets,27–29 femtoliter-sized reactors,30,31 or tyramide signal amplification32 have been developed by other groups, and multiplex digital bioassays33–36 have been established for simultaneous detection of different proteins. However, all these multiplex digital bioassays only detect the same class of analytes, not different classes of analytes.
In this paper, we first describe a multiplex competitive Simoa assay for simultaneous detection of two important small-molecule biomarkers, cortisol and prostaglandin E2 (PGE2). Dye-encoded paramagnetic beads were modified with hapten–BSA conjugates to quantify each analyte. The cross-reactivity of detection reagents was investigated. Next, a 3-plex multi-analyte Simoa assay that incorporates the analysis of small molecules, proteins and microRNAs in one measurement was established by combining competitive and sandwich immunoassays with nucleic acid hybridization. Three widely investigated biomarkers, cortisol, interleukin 6 (IL-6) and microRNA 141 (miR-141) were selected as model targets. The multiplexed measurement of cortisol, IL-6, and miR-141 was validated in saliva samples to demonstrate the practical application of the multi-analyte Simoa assay. To the best of our knowledge, this is the first example of multiplexed detection of proteins, nucleic acids, and small molecules using single molecule measurement methodology.
2. Experimental section
2.1 Materials
Cortisol solution, 2-(N-morpholino)ethanesulfonic acid (MES), Amicon Ultra 0.5 mL centrifugal filters, Tween 20, and bovine serum albumin (A7030) were purchased from Sigma Aldrich (St. Louis, MO). 1-Ethyl-3-(3-dimethylaminopropyl)carbodiimide hydrochloride (EDC), N-hydroxysulfosuccinimide (sulfo-NHS), SUPERase·In™ RNase inhibitor (20 U μL−1, AM2694), and NHS-PEG4-Biotin were purchased from Thermo Fisher (Waltham, MA). Cortisol–BSA conjugate was purchased from Fitzgerald Industries International (Acton, MA). Prostaglandin E2 (PGE2) was purchased from Enzo Life Sciences (Farmingdale, NY). Anti-PGE2 monoclonal antibody (414013) was purchased from Cayman Chemical (Ann Arbor, MI). Anti-cortisol monoclonal antibody (clone: XM210) was purchased from GeneTex (Irvine, CA). Detection antibodies were biotinylated using NHS-PEG4-Biotin according to a previously reported method.37 Synthetic target miR-141 (rUrArArCrArCrUrGrUrCrUrGrGrUrArArArGrArUrGrG) was purchased from IDT. Custom-made locked nucleic acid (LNA) capture (/5AmMC12/TTTTTTC + CATCT + TTA + C + C) and detection (+A + GA + CA + GTG + TTA/3Bio/) probes were purchased from Exiqon. Here RNA bases are proceeded by “r” (i.e. rA, rC, rG, rU), and LNA bases are proceeded by “+” (i.e. +A, +C, +G, +T). Recombinant human IL-6 protein (206 IL), IL-6 capture (MAB206) and detection (BAF206) antibodies were purchased from R&D Systems (Minneapolis, MN). The Simoa HD-X analyzer and Homebrew assay kits were purchased from Quanterix Corporation (Lexington, MA). Homebrew kits include dye-encoded carboxyl-functionalized paramagnetic beads, 50 nM streptavidin-β-galactosidase (SβG) concentrate, 100 μM resorufin β-D-galactopyranoside (RGP), and SβG Diluent.2.2 Preparation of capture beads
Dye-encoded carboxylated 2.7 μm paramagnetic beads (∼4 × 10⁸), 488 nm for PGE2 and 647 nm for cortisol, were washed three times with 200 μL of bead wash buffer (0.1% Tween 20 in 1× PBS, pH 7.4) and twice with 200 μL of MES buffer (50 mM MES, pH 6.2). 1 mg mL−1 EDC in MES buffer was freshly prepared and 200 μL was added to the beads and mixed well. The beads were activated on a shaker for 30 min. After activation, the beads were washed once with 200 μL of MES buffer. 200 μL of 10 mg mL−1 BSA or 2 mg mL−1 BSA–cortisol conjugate in MES buffer were added to the activated beads. The beads were incubated at room temperature with shaking for 1 h, and then washed three times with bead wash buffer. The BSA–cortisol conjugate coated beads were stored in 200 μL of bead storage buffer (50 mM Tris–HCl with 1% BSA, 1% Triton 100 and 0.15% ProClin 300, pH 7.8) at 4 °C for further use.PGE2 was dissolved in methanol to a final concentration of 1 mg mL−1. EDC and sulfo-NHS were reconstituted in MES buffer (50 mM, pH 6.2) to a final concentration of 10 mg mL−1. EDC and sulfo-NHS (25 μL each) were added to 50 μL of PGE2 solution. The mixture was vortexed and incubated at room temperature for 1 h. 30 μL of the formed PGE2-NHS ester was added to 200 μL of BSA-coated beads in 1× PBS. The beads were vortexed, incubated with shaking for 30 min, and then washed five times with bead wash buffer to remove unreacted PGE2-NHS ester. The BSA-PGE2-coated beads were resuspended in 200 μL of bead storage buffer and stored at 4 °C. In addition, miR-141 capture beads (700 nm) and anti-IL-6 capture beads (488 nm) were prepared according to previously published methods.23,38 The beads were counted using a Beckman–Coulter multisizer.
2.3 Preparation of reagents and assay setup for Simoa assay
A two-step assay configuration was chosen for the multiplexed detection. Specifically, cortisol–BSA-coated beads and PGE2-BSA-coated beads were mixed in the number ratio of 1![[thin space (1/6-em)]](https://www.rsc.org/images/entities/char_2009.gif) :
:![[thin space (1/6-em)]](https://www.rsc.org/images/entities/char_2009.gif) 1. The mixed beads were diluted in sample buffer (5× PBS, 1% BSA, 5 mM EDTA, and 0.05% Tween 20) to a concentration of 20
1. The mixed beads were diluted in sample buffer (5× PBS, 1% BSA, 5 mM EDTA, and 0.05% Tween 20) to a concentration of 20![[thin space (1/6-em)]](https://www.rsc.org/images/entities/char_2009.gif) 000 beads per μL. Biotinylated detection probes were diluted in sample buffer to the desired concentrations (90 pM for anti-cortisol antibodies and 6 nM for anti-PGE2 antibodies). SβG concentrate was diluted to 200 pM in SβG Diluent. Cortisol and PGE2 standards were serially diluted to desired concentrations in sample buffer. The reagents including beads, detector, and SβG were placed in plastic bottles (Quanterix). The samples were loaded onto a 96-well plate (Quanterix). All reagents (capture beads, detector antibodies, SβG, enzyme substrate RGP, Wash Buffer 1, Wash Buffer 2, and Simoa Sealing Oil) were purchased from Quanterix and loaded onto the Simoa HD-X Analyzer (Quanterix) based on the manufacturer's instructions. Bead mixture (25 μL) was pipetted into a reaction cuvette. Then, 100 μL of sample and 25 μL of detection antibody mixture were added and incubated for 30 min. The beads were pelleted with a magnet, and the supernatant was removed. Following a series of washes, 100 μL of SβG was added and incubated for 5 min. The beads were washed again, resuspended in RGP solution, and loaded onto the array. The array was then sealed with oil and imaged. Images of the arrays were analyzed, and AEB (average enzyme per bead) values were calculated by the software in the HD-X Analyzer.39
000 beads per μL. Biotinylated detection probes were diluted in sample buffer to the desired concentrations (90 pM for anti-cortisol antibodies and 6 nM for anti-PGE2 antibodies). SβG concentrate was diluted to 200 pM in SβG Diluent. Cortisol and PGE2 standards were serially diluted to desired concentrations in sample buffer. The reagents including beads, detector, and SβG were placed in plastic bottles (Quanterix). The samples were loaded onto a 96-well plate (Quanterix). All reagents (capture beads, detector antibodies, SβG, enzyme substrate RGP, Wash Buffer 1, Wash Buffer 2, and Simoa Sealing Oil) were purchased from Quanterix and loaded onto the Simoa HD-X Analyzer (Quanterix) based on the manufacturer's instructions. Bead mixture (25 μL) was pipetted into a reaction cuvette. Then, 100 μL of sample and 25 μL of detection antibody mixture were added and incubated for 30 min. The beads were pelleted with a magnet, and the supernatant was removed. Following a series of washes, 100 μL of SβG was added and incubated for 5 min. The beads were washed again, resuspended in RGP solution, and loaded onto the array. The array was then sealed with oil and imaged. Images of the arrays were analyzed, and AEB (average enzyme per bead) values were calculated by the software in the HD-X Analyzer.39
For simultaneous detection of cortisol and IL-6, BSA–cortisol-coated beads were mixed with anti-IL6 capture beads (1![[thin space (1/6-em)]](https://www.rsc.org/images/entities/char_2009.gif) :
:![[thin space (1/6-em)]](https://www.rsc.org/images/entities/char_2009.gif) 1 in number). The mixed beads were diluted to a concentration of 20
1 in number). The mixed beads were diluted to a concentration of 20![[thin space (1/6-em)]](https://www.rsc.org/images/entities/char_2009.gif) 000 beads per μL. A mixture of detection antibodies, 300 pM for anti-cortisol antibody (XM210) and 6 nM for anti-IL6 detector, was prepared in sample buffer. A mixture of cortisol and IL-6 standards was prepared in sample buffer at desired concentrations. For multiplexed detection of cortisol and miR-141, BSA–cortisol-coated beads were mixed with miR-141 capture beads (1
000 beads per μL. A mixture of detection antibodies, 300 pM for anti-cortisol antibody (XM210) and 6 nM for anti-IL6 detector, was prepared in sample buffer. A mixture of cortisol and IL-6 standards was prepared in sample buffer at desired concentrations. For multiplexed detection of cortisol and miR-141, BSA–cortisol-coated beads were mixed with miR-141 capture beads (1![[thin space (1/6-em)]](https://www.rsc.org/images/entities/char_2009.gif) :
:![[thin space (1/6-em)]](https://www.rsc.org/images/entities/char_2009.gif) 1 in number) and diluted to a concentration of 20
1 in number) and diluted to a concentration of 20![[thin space (1/6-em)]](https://www.rsc.org/images/entities/char_2009.gif) 000 beads per μL. A mixture containing 300 pM of anti-cortisol antibody (XM210) and 60 nM of miR-141 detection probe was prepared in sample buffer. A mixture of cortisol and miR-141 standards was prepared in sample buffer at desired concentrations. For simultaneous detection of cortisol, IL-6 and miR-141, BSA–cortisol-coated beads were mixed with anti-IL-6 and miR-141 capture beads (1
000 beads per μL. A mixture containing 300 pM of anti-cortisol antibody (XM210) and 60 nM of miR-141 detection probe was prepared in sample buffer. A mixture of cortisol and miR-141 standards was prepared in sample buffer at desired concentrations. For simultaneous detection of cortisol, IL-6 and miR-141, BSA–cortisol-coated beads were mixed with anti-IL-6 and miR-141 capture beads (1![[thin space (1/6-em)]](https://www.rsc.org/images/entities/char_2009.gif) :
:![[thin space (1/6-em)]](https://www.rsc.org/images/entities/char_2009.gif) 1
1![[thin space (1/6-em)]](https://www.rsc.org/images/entities/char_2009.gif) :
:![[thin space (1/6-em)]](https://www.rsc.org/images/entities/char_2009.gif) 1 in number) and diluted to a concentration of 30
1 in number) and diluted to a concentration of 30![[thin space (1/6-em)]](https://www.rsc.org/images/entities/char_2009.gif) 000 beads per μL. A mixture containing 300 pM of anti-cortisol antibody (XM210), 6 nM of anti-IL6 detection antibody, and 60 nM of miR-141 detection probe was prepared in sample buffer. A mixture of cortisol, IL-6 and miR-141 standards was prepared in sample buffer at desired concentrations. To make the signal change in the same trend, high concentrations of cortisol were mixed with low concentrations of IL-6 and/or miR-141 to prepare the standards.
000 beads per μL. A mixture containing 300 pM of anti-cortisol antibody (XM210), 6 nM of anti-IL6 detection antibody, and 60 nM of miR-141 detection probe was prepared in sample buffer. A mixture of cortisol, IL-6 and miR-141 standards was prepared in sample buffer at desired concentrations. To make the signal change in the same trend, high concentrations of cortisol were mixed with low concentrations of IL-6 and/or miR-141 to prepare the standards.
For single-plex assay, the capture beads were diluted with sample buffer to a final concentration of 10![[thin space (1/6-em)]](https://www.rsc.org/images/entities/char_2009.gif) 000 beads per μL. The analyte standards were serially diluted to desired concentrations in sample buffer. 100 μL of sample, 25 μL of bead mixture, and 25 μL of detection probe were incubated together. All the other steps were the same as those of the multiplex assay.
000 beads per μL. The analyte standards were serially diluted to desired concentrations in sample buffer. 100 μL of sample, 25 μL of bead mixture, and 25 μL of detection probe were incubated together. All the other steps were the same as those of the multiplex assay.
2.4 Saliva samples
Pooled normal human saliva samples were purchased from Innovative Research, Inc. (Novi, MI). Saliva sample was separated by centrifugation at 13![[thin space (1/6-em)]](https://www.rsc.org/images/entities/char_2009.gif) 000g for 20 min, and the supernatant was transferred to a new tube. RNase inhibitor (AM2694) was added to a final concentration of 1 U μL−1. Saliva samples were then diluted 50-fold in sample buffer, and different concentrations of cortisol, IL-6 and miR-141 were spiked into the samples for quantitative analysis.
000g for 20 min, and the supernatant was transferred to a new tube. RNase inhibitor (AM2694) was added to a final concentration of 1 U μL−1. Saliva samples were then diluted 50-fold in sample buffer, and different concentrations of cortisol, IL-6 and miR-141 were spiked into the samples for quantitative analysis.
2.5 Data analysis
Standard curves were obtained by plotting the signal responses (AEB) against the logarithm of analyte concentrations using Origin software (Origin 9.5). The 4-parameter logistic (equation y = A2 + (A1 − A2)/[1 + (x/x0)p]) was used for curve fitting in the whole concentration range, where A1 is the maximum signal, A2 is the minimum signal, p is the curve slope at the inflection point, and x0 is the concentration at the inflection point. For the detection of small molecules, x0 is the IC50 (analyte concentration causing a 50% inhibition of the maximum response). The lower the IC50, the higher the sensitivity is. For IL-6 and miR-141, the limit of detection (LOD) was calculated as three standard deviations (SDs) above the background. For cortisol, the detection limit was defined at the concentration causing a 10% inhibition of the maximum response. All measurements were performed in triplicate.3. Results and discussion
3.1 Principle of multiplex competitive Simoa assay
We developed a multiplex competitive Simoa assay for simultaneous detection of different small molecules. Paramagnetic beads (MBs) were labeled with unique fluorescent dyes to create optically distinct subpopulations of beads that were further modified with specific capture probes to quantify each analyte. Specifically, hapten-BSA conjugates were immobilized to individual subpopulations of beads (Fig. 1). The biofunctionalized MBs were combined and incubated with a sample containing the target small molecules and a mixture of biotinylated detection antibodies specific to the target small molecules. Biofunctionalized MBs and free target small molecules in the sample competitively bind to biotin-labeled antibodies. After incubation and magnetic separation, the supernatant containing unbound antibodies was removed. These beads were then labeled with SβG enzyme via biotin-streptavidin interaction. Finally, MBs were loaded into the Simoa disc and imaged to determine: (a) the location and subpopulation identity of individual beads in the femtoliter wells, and (b) the presence or absence of a single enzyme molecule associated with each bead.24,25 The images were analyzed to determine the average enzyme per bead (AEB) for each bead subpopulation that provides a quantitative parameter for determining the concentration of each analyte.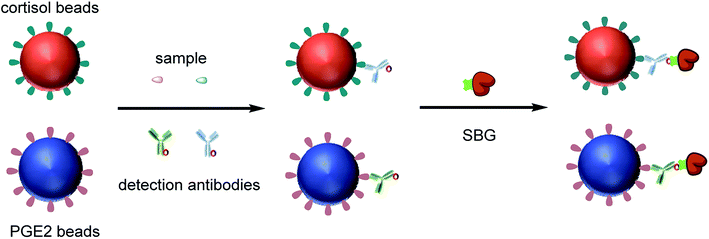 | ||
| Fig. 1 Schematic illustration of multiplexed detection of two different small molecules using Simoa. | ||
3.2 Multiplexed detection of small molecules
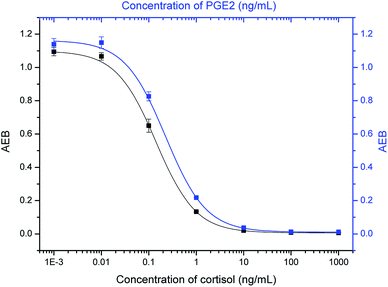
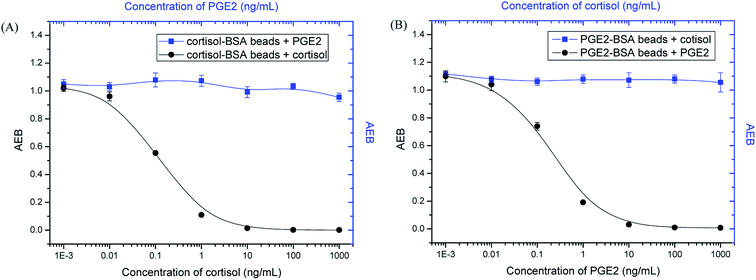
Two widely used small-molecule biomarkers, cortisol and PGE2,40–42 were selected to test our multiplex assay. Since they are both small molecules (Fig. S1†), the same detection principle (i.e. competitive immunoassay) is used. Dye-encoded beads (647 nm) were coated with BSA–cortisol conjugates. For the detection of PGE2, beads (488 nm) were first conjugated with BSA, and then PGE2-NHS ester was added, which specifically reacted with amine groups on BSA molecules (Fig. S2†). Cortisol and PGE2 were simultaneously detected following the procedures described in the Experimental section. As shown in Fig. 2, with increasing analyte concentration, the signal (AEB) decreased proportionally, because an increase in the number of target molecules leads to a decrease in the number of biotinylated antibody molecules that bind to the MBs, resulting in lower signals. Thus, the signals are inversely proportional to the analyte concentration. The half maximal inhibitory concentration (IC50), a parameter that is used to evaluate the sensitivity of a competitive immunoassay, was 0.14 ng mL−1 for cortisol and 0.22 ng mL−1 for PGE2, respectively. The sensitivity is comparable with that of single-plex assays, which are 0.12 ng mL−1 for cortisol and 0.20 ng mL−1 for PGE2 (Fig. S3†), demonstrating that multiplexing does not compromise sensitivity.When making multiplexed measurements, the presence of multiple analytes in a sample can potentially introduce cross-reactivity that limits the practical utility of an assay. To assess specificity, PGE2 standard solutions were tested with cortisol–BSA beads and anti-cortisol antibodies, and cortisol standard solutions were tested with PGE2-BSA beads and anti-PGE2 antibodies. As shown in Fig. 3, the signal hardly changes with increasing PGE2 concentrations in the presence of cortisol–BSA beads and anti-cortisol antibodies. Similar results were obtained for the measurements of cortisol when PGE2-BSA beads and anti-PGE2 antibodies were used. In addition, the presence of high concentration of non-target compounds did not interfere with the detection of intended targets (Fig. S4†). These results demonstrate that the assay has high specificity for its intended targets.
3.3 Principle of multi-analyte Simoa assay
We also developed a multi-analyte Simoa assay that enables simultaneous detection of small molecules, proteins and nucleic acids (Fig. 4). Hapten–BSA conjugates, protein capture antibodies and target microRNA capture probes were immobilized on three subpopulations of dye-encoded beads, respectively. The biofunctionalized MBs were combined and incubated with a sample containing the target analytes and a mixture of biotinylated detection probes specific to the small molecule, protein, or microRNA. Hapten–BSA conjugate modified MBs competed with free small molecules in binding to their detection antibodies. For the detection of protein and microRNA, a sandwich complex was formed by capture of the target protein or microRNA on the corresponding capture bead, followed by labeling of the bead with detection probes specific to the protein or microRNA. After incubation and magnetic separation, the beads were washed, labeled with the enzyme SβG, and detected by enzymatic readout in the Simoa platform.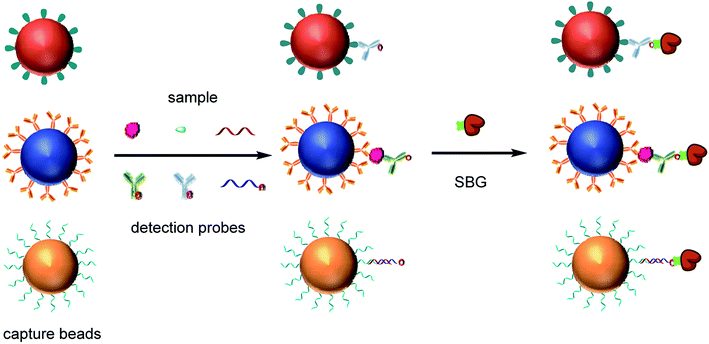 | ||
| Fig. 4 Schematic illustration of multiplexed detection small molecules, proteins and microRNAs using Simoa. | ||
3.4 Simultaneous detection of small molecules, proteins and microRNA
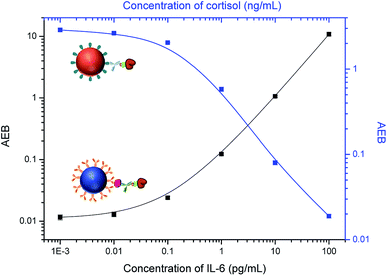
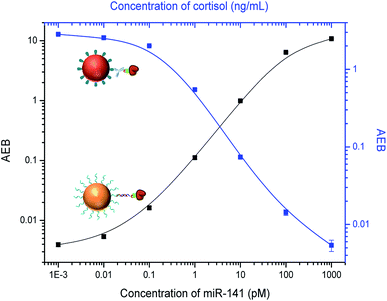
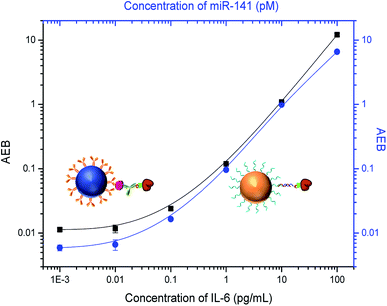
It is challenging to simultaneously detect three different classes of analytes, so we first attempted to detect two analytes at a time. For simultaneous detection of small molecules and proteins, we combined competitive and sandwich immunoassays in one system. IL-6 was selected as a protein biomarker because it is important as both a pro-inflammatory cytokine and an anti-inflammatory myokine.43,44 Dye-encoded beads (488 nm) modified with anti-IL-6 capture antibodies were mixed with cortisol–BSA beads (647 nm), and then incubated with a sample containing both IL-6 and cortisol and a mixture of anti-cortisol and anti-IL-6 detection antibodies. To stabilize the target proteins and reduce nonspecific binding, a 1× PBS solution (pH 7.4) containing 1% BSA and 0.05% Tween 20 was used to prepare the samples. As shown in Fig. 5, an increase in the IL-6 concentration correlates to an increase in AEB signal. As expected, an increase in cortisol concentration results in a decrease in AEB signal consistent with the competitive immunoassay format. These results indicate that cortisol and IL-6 can be simultaneously detected in one sample using Simoa.We next investigated multiplexing of small molecules with microRNAs. Current methods for microRNA detection usually require tedious sample preparation and amplification steps that can bias the results.23 Here we used a sandwich hybridization assay for direct detection of microRNAs without pre-amplification. We chose a widely investigated microRNA biomarker, miR-141,45,46 as a target. BSA–cortisol beads (647 nm) were mixed with miR-141 capture beads (700 nm) for simultaneous detection of cortisol and miR-141. The target miR-141 molecule was captured by specific nucleic acid probes on the bead surface, which are complementary to the target sequence, and then labeled with a biotinylated detection nucleic acid sequence. Locked nucleic acid (LNA)-modified capture and detection probes were used to increase hybridization specificity. To increase binding affinity of the LNA probes, a high ionic strength buffer, 5× PBS, was used to prepare the samples. As shown in Fig. 6, the signal increased with increasing miR-141 concentration, while the signal decreased when the concentration of cortisol increased, demonstrating the multiplex assay can be used for simultaneously detecting small molecules and microRNAs.
For simultaneous detection of proteins and microRNAs, a sandwich immunoassay was combined with a direct nucleic acid hybridization assay. IL-6 capture beads (647 nm) were combined with miR-141 capture beads (700 nm) for the Simoa assay. As shown in Fig. 7, the signals for IL-6 and miR-141 both increased with increasing analyte concentrations, demonstrating the Simoa method can be used for the simultaneous detection of IL-6 and miR-141.
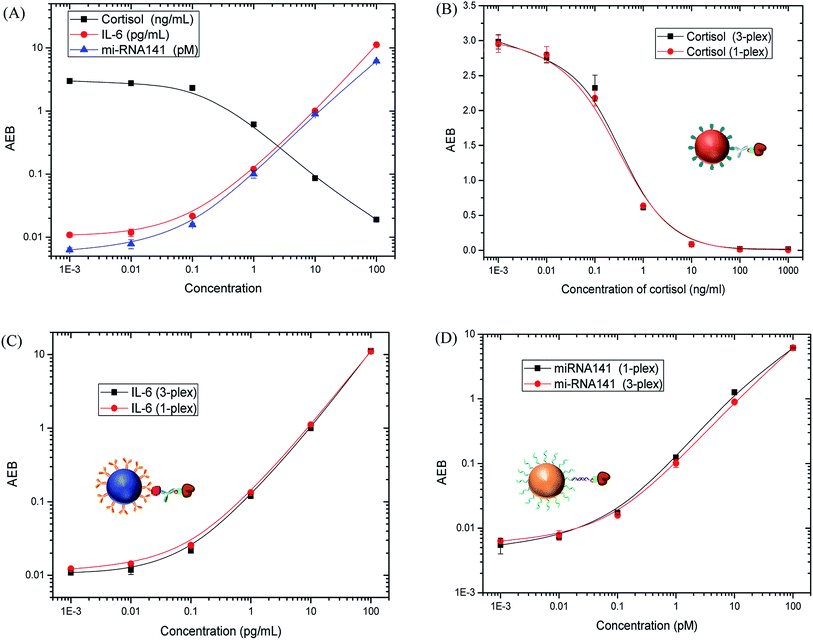
After demonstrating the ability to perform two different duplex assays with multiple analyte classes, a 3-plex Simoa assay was established for simultaneous detection of cortisol, IL-6 and miR-141. A competitive immunoassay was combined with a sandwich immunoassay and direct nucleic acid hybridization. The samples were prepared in a buffer solution (5× PBS, pH 7.4) containing 1% BSA and 0.05% Tween 20, and then measured following the procedures described in the Experimental section. The response curves are shown in Fig. 8A. The LODs for cortisol, IL-6 and miR-141 are 0.031 ng mL−1, 0.018 pg mL−1, and 0.019 pM, respectively. The detection limits are comparable to those of single-plex assays (0.028 ng mL−1 for cortisol, 0.022 pg mL−1 for IL-6 and 0.009 pM for miR-141). In addition, there is negligible difference in the response curves of the 3-plex assay compared to the single-plex assays (Fig. 8B–D), demonstrating that the presence of non-target analytes does not interfere with the detection of target analytes. These results also indicate that the multiplexed format does not compromise the sensitivity and specificity of each Simoa assay for IL-6, cortisol, and miR-141.
3.5. Analysis of biological samples
To evaluate the performance of the multi-analyte Simoa assay in complex biological matrices, cortisol, IL-6 and miR-141 standards were spiked into saliva samples and then analyzed to determine recovery. Ribonuclease (RNase) inhibitors were added to saliva samples due to the endogenous presence of RNase in saliva that can interfere with miRNA detection. The concentrations of spiked IL-6, cortisol, and miRNA141 were determined from the calibration curves in Fig. 8A. Recovery rates were calculated by subtracting the measured spiked concentration from the concentration of blank samples and then dividing by the known spiked concentration. As shown in Table 1, satisfactory recovery rates were obtained for cortisol (99.5–122.9%), IL-6 (93.3–106.1%), and miR-141 (86.4–116.4%), indicating the high specificity of the assays. These results demonstrate that the multiplex Simoa assay has the potential to be used for multi-analyte detection in complex samples.| Spiked | Cortisol | IL-6 | miR-141 | |||
|---|---|---|---|---|---|---|
| Calculated (ng mL−1) | Recovery rate | Calculated (pg mL−1) | Recovery rate | Calculated (pM) | Recovery rate | |
| 0 | 0.026 | — | 0.136 | — | 0.037 | — |
| 0.1 | 0.125 | 99.5 ± 0.6% | 0.242 | 106.1 ± 1.4% | 0.153 | 116.4 ± 4.2% |
| 0.5 | 0.584 | 111.6 ± 2.3% | 0.634 | 99.5 ± 1.5% | 0.472 | 87.1 ± 2.7% |
| 1.0 | 1.068 | 104.2 ± 1.7% | 1.075 | 93.9 ± 1.7% | 0.901 | 86.4 ± 4.6% |
| 5 | 6.173 | 122.9 ± 4.6% | 4.907 | 95.4 ± 1.2% | 4.789 | 95.1 ± 2.1% |
| 10 | 10.374 | 103.5 ± 5.8% | 9.468 | 93.3 ± 5.2% | 9.459 | 94.2 ± 6.8% |
4. Conclusions
We developed a multi-analyte Simoa assay for simultaneous detection of small molecules, proteins and microRNAs. Cortisol and PGE2 were simultaneously detected using multiplex competitive Simoa assays. Cortisol, IL-6 and miR-141 in one sample were simultaneously measured by combining competitive and sandwich immunoassays with direct nucleic acid hybridization. We demonstrated that the multiplexed measurement does not compromise the sensitivity and specificity of the individual assays. In addition, we demonstrated the simultaneous detection of cortisol, IL-6 and miR-141 in saliva samples. This method offers an approach to significantly simplify the detection of multiple analytes by combining all assays into a single multiplexed format. This format enables the use of small sample volumes, which is particularly useful for pediatric or precious samples such as cerebrospinal fluid. In addition to multiplexing different analyte classes, the Simoa method is ultrasensitive. Multiplexing combined with ultrasensitivity provides a powerful tool for disease diagnosis. By using different combinations of dye-encoded beads and detection reagents, the established method could be used for simultaneous detection of other analytes in a diverse range of areas, such as clinical diagnostics, environmental monitoring, and food safety.Conflicts of interest
The authors declare the following competing financial interest: David R. Walt is a board member and equity holder of Quanterix Corporation. All other authors declare no competing financial interest.Acknowledgements
We thank Dr Alana F. Ogata at Wyss Institute for Biologically Inspired Engineering, Harvard University, for taking part in discussions and revising the manuscript.Notes and references
- L. Cohen and D. R. Walt, Annu. Rev. Anal. Chem., 2017, 10, 345–363 CrossRef CAS PubMed.
- Y.-F. Li, Y.-M. Sun, R. C. Beier, H.-T. Lei, S. Gee, B. D. Hammock, H. Wang, Z. Wang, X. Sun and Y.-D. Shen, TrAC, Trends Anal. Chem., 2017, 88, 25–40 CrossRef CAS.
- C. Wu, A. M. Maley and D. R. Walt, Crit. Rev. Clin. Lab. Sci., 2019, 1–21 Search PubMed.
- M. Lin, P. Song, G. Zhou, X. Zuo, A. Aldalbahi, X. Lou, J. Shi and C. Fan, Nat. Protoc., 2016, 11, 1244 CrossRef CAS PubMed.
- L. Liu, T. Li, S. Zhang, P. Song, B. Guo, Y. Zhao and H. C. Wu, Angew. Chem., Int. Ed., 2018, 57, 11882–11887 CrossRef CAS PubMed.
- A. W. Scott, V. Garimella, C. M. Calabrese and C. A. Mirkin, Bioconjugate Chem., 2017, 28, 203–211 CrossRef CAS PubMed.
- F. Yin, L. Liu, X. Sun, L. Hou, Y. Lu, Q. Xue, T. Lin, X. Li and C.-z. Li, Analyst, 2019, 144, 5504–5510 RSC.
- L. Cohen and D. R. Walt, Chem. Rev., 2018, 119, 293–321 CrossRef PubMed.
- C. Lin, Y. Liu and H. Yan, Nano Lett., 2007, 7, 507–512 CrossRef CAS PubMed.
- D. Falconnet, J. She, R. l. Tornay, E. Leimgruber, D. Bernasconi, L. Lagopoulos, P. Renaud, N. Demierre and P. Van Den Bogaard, Anal. Chem., 2015, 87, 1582–1589 CrossRef CAS PubMed.
- P. J. Tighe, R. R. Ryder, I. Todd and L. C. Fairclough, Proteomics: Clin. Appl., 2015, 9, 406–422 CAS.
- R. Moulder, S. D. Bhosale, D. R. Goodlett and R. Lahesmaa, Mass Spectrom. Rev., 2018, 37, 583–606 CrossRef CAS PubMed.
- Y. Xiang, X. Qian, B. Jiang, Y. Chai and R. Yuan, Chem. Commun., 2011, 47, 4733–4735 RSC.
- J. Das, K. B. Cederquist, A. A. Zaragoza, P. E. Lee, E. H. Sargent and S. O. Kelley, Nat. Chem., 2012, 4, 642 CrossRef CAS PubMed.
- H. Zhang, X. Huang, J. Liu and B. Liu, Chem. Sci., 2020, 11, 3812–3819 RSC.
- X. Yang, Y. Tang, R. R. Alt, X. Xie and F. Li, Analyst, 2016, 141, 3473–3481 RSC.
- D. M. Rissin, C. W. Kan, T. G. Campbell, S. C. Howes, D. R. Fournier, L. Song, T. Piech, P. P. Patel, L. Chang and A. J. Rivnak, Nat. Biotechnol., 2010, 28, 595 CrossRef CAS PubMed.
- D. M. Rissin, D. R. Fournier, T. Piech, C. W. Kan, T. G. Campbell, L. Song, L. Chang, A. J. Rivnak, P. P. Patel and G. K. Provuncher, Anal. Chem., 2011, 83, 2279–2285 CrossRef CAS PubMed.
- D. Wu, E. Katilius, E. Olivas, M. Dumont Milutinovic and D. R. Walt, Anal. Chem., 2016, 88, 8385–8389 CrossRef CAS PubMed.
- S. T. Gaylord, T. L. Dinh, E. R. Goldman, G. P. Anderson, K. C. Ngan and D. R. Walt, Anal. Chem., 2015, 87, 6570–6577 CrossRef CAS PubMed.
- D. C. Duffy and D. R. Walt, Clin. Chem., 2019, 65, 809–810 CrossRef CAS PubMed.
- L. Song, D. Shan, M. Zhao, B. A. Pink, K. A. Minnehan, L. York, M. Gardel, S. Sullivan, A. F. Phillips and R. B. Hayman, Anal. Chem., 2013, 85, 1932–1939 CrossRef CAS PubMed.
- L. Cohen, M. R. Hartman, A. Amardey-Wellington and D. R. Walt, Nucleic Acids Res., 2017, 45, e137 CrossRef CAS.
- D. M. Rissin, C. W. Kan, L. Song, A. J. Rivnak, M. W. Fishburn, Q. Shao, T. Piech, E. P. Ferrell, R. E. Meyer and T. G. Campbell, Lab Chip, 2013, 13, 2902–2911 RSC.
- A. J. Rivnak, D. M. Rissin, C. W. Kan, L. Song, M. W. Fishburn, T. Piech, T. G. Campbell, D. R. DuPont, M. Gardel and S. Sullivan, J. Immunol. Methods, 2015, 424, 20–27 CrossRef CAS.
- X. Wang, L. Cohen, J. Wang and D. R. Walt, J. Am. Chem. Soc., 2018, 140, 18132–18139 CrossRef CAS PubMed.
- S. H. Kim, S. Iwai, S. Araki, S. Sakakihara, R. Iino and H. Noji, Lab Chip, 2012, 12, 4986–4991 RSC.
- J.-u. Shim, R. T. Ranasinghe, C. A. Smith, S. M. Ibrahim, F. Hollfelder, W. T. Huck, D. Klenerman and C. Abell, ACS Nano, 2013, 7, 5955–5964 CrossRef CAS PubMed.
- S. A. Byrnes, T. Huynh, T. C. Chang, C. E. Anderson, J. J. McDermott, C. I. Oncina, B. H. Weigl and K. P. Nichols, Anal. Chem., 2020, 92, 3535–3543 CrossRef CAS PubMed.
- K. Akama, N. Iwanaga, K. Yamawaki, M. Okuda, K. Jain, H. Ueno, N. Soga, Y. Minagawa and H. Noji, ACS Nano, 2019, 13, 13116–13126 CrossRef CAS PubMed.
- Y. Minagawa, H. Ueno, K. V. Tabata and H. Noji, Lab Chip, 2019, 19, 2678–2687 RSC.
- K. Akama, K. Shirai and S. Suzuki, Anal. Chem., 2016, 88, 7123–7129 CrossRef CAS PubMed.
- V. Yelleswarapu, J. R. Buser, M. Haber, J. Baron, E. Inapuri and D. Issadore, Proc. Natl. Acad. Sci. U. S. A., 2019, 116, 4489–4495 CrossRef CAS PubMed.
- P. Shahi, S. C. Kim, J. R. Haliburton, Z. J. Gartner and A. R. Abate, Sci. Rep., 2017, 7, 44447 CrossRef CAS PubMed.
- K. Akama and H. Noji, Lab Chip, 2020, 20, 2113–2121 RSC.
- K. Akama, K. Shirai and S. Suzuki, Electron. Commun. Jpn., 2019, 102, 43–47 CrossRef.
- D. Wu, M. D. Milutinovic and D. R. Walt, Analyst, 2015, 140, 6277–6282 RSC.
- L. Cohen, L. Xie, M. E. Xylas and D. R. Walt, J. Immunol. Methods, 2018, 452, 20–25 CrossRef CAS PubMed.
- D. H. Wilson, D. M. Rissin, C. W. Kan, D. R. Fournier, T. Piech, T. G. Campbell, R. E. Meyer, M. W. Fishburn, C. Cabrera and P. P. Patel, J. Lab. Autom., 2016, 21, 533–547 CrossRef CAS PubMed.
- C. de Weerth, G. Graat, J. K. Buitelaar and J. H. H. Thijssen, Clin. Chem., 2003, 49, 658–660 CrossRef CAS PubMed.
- J. M. Hawley, L. J. Owen, S. J. Lockhart, P. J. Monaghan, A. Armston, C. A. Chadwick, H. Wilshaw, M. Freire, L. Perry and B. G. Keevil, Clin. Chem., 2016, 62, 1220–1229 CrossRef CAS PubMed.
- X. Peng, L. Jiang, C. Chen, Y. Qin, T. Yuan, O. Wang, X. Xing, X. Li, M. Nie and L. Chen, PLoS One, 2017, 12, e0180811 CrossRef PubMed.
- J. J. Fuster and K. Walsh, EMBO J., 2014, 33, 1425–1427 CrossRef CAS PubMed.
- S. A. Jones and B. J. Jenkins, Nat. Rev. Immunol., 2018, 18, 773–789 CrossRef CAS PubMed.
- R. Garzon, G. A. Calin and C. M. Croce, Annu. Rev. Med., 2009, 60, 167–179 CrossRef CAS PubMed.
- C. Liu, R. Liu, D. Zhang, Q. Deng, B. Liu, H.-P. Chao, K. Rycaj, Y. Takata, K. Lin and Y. Lu, Nat. Commun., 2017, 8, 1–14 CrossRef PubMed.
Footnote |
| † Electronic supplementary information (ESI) available: Experimental details and detection results. See DOI: 10.1039/d0sc02552f |
| This journal is © The Royal Society of Chemistry 2020 |

