 Open Access Article
Unravelling the intricate photophysical behavior of 3-(pyridin-2-yl)triimidazotriazine AIE and RTP polymorphs†
Elena
Lucenti
 a,
Alessandra
Forni
 *a,
Andrea
Previtali‡
 ab,
Daniele
Marinotto‡
 a,
Daniele
Malpicci
 b,
Stefania
Righetto‡
b,
Clelia
Giannini
b,
Stefania
Righetto‡
b,
Clelia
Giannini
 b,
Tersilla
Virgili
 c,
Piotr
Kabacinski
 c,
Lucia
Ganzer
c,
Umberto
Giovanella
d,
Chiara
Botta
c,
Lucia
Ganzer
c,
Umberto
Giovanella
d,
Chiara
Botta
 *d and
Elena
Cariati
 *ab
*ab
aInstitute of Sciences and Chemical Technologies “Giulio Natta” (SCITEC) of CNR, via Golgi 19, 20133 Milano, Italy. E-mail: elena.cariati@unimi.it; alessandra.forni@scitec.cnr.it
bDepartment of Chemistry, Università degli Studi di Milano, INSTM RU, via Golgi 19, 20133 Milano, Italy
cIFN-CNR, Dipartimento di Fisica, Politecnico di Milano, Piazza Leonardo da Vinci 32, I-20133, Milano, Italy
dInstitute of Sciences and Chemical Technologies “Giulio Natta” (SCITEC) of CNR, via Corti 12, 20133 Milano, Italy. E-mail: chiara.botta@scitec.cnr.it
First published on 9th June 2020
Abstract
The development of purely organic materials showing multicolor fluorescent and phosphorescent behaviour represents a formidable challenge in view of practical applications. Herein the rich photophysical behaviour of 3-(pyridin-2-yl)triimidazotriazine (TT-Py) organic molecule, comprising excitation-dependent fluorescence and phosphorescence under ambient conditions in both blended films and the crystalline phase, is investigated by means of steady state, time resolved and ultrafast spectroscopies and interpreted on the basis of X-ray diffraction studies and DFT/TDDFT calculations. In particular, by proper excitation wavelength, dual fluorescence and dual phosphorescence of molecular origin can be observed together with low energy phosphorescences resulting from aggregate species. It is demonstrated that the multiple emission properties originate from the copresence, in the investigated system, of an extended polycyclic nitrogen-rich moiety (TT), strongly rigidified by π–π stacking interactions and short C–H⋯N hydrogen bonds, and a fragment (Py) having partial conformational freedom.
Introduction
Purely organic materials showing Room Temperature Phosphorescence (RTP) in air have attracted attention in the last decade owing to the benefits they offer, including biocompatibility and low cost, compared to the widely used phosphorescent inorganic materials. Organic RTP applications in several fields such as bioimaging,1 anti-counterfeiting,2 catalysis3 and displays4 are emerging.Several strategies have been developed to realize organic RTP materials ranging from molecular engineering5–7 to proper supramolecular organization based, for example, on H-aggregation,8–10 host–guest systems,11 halogen bonding,12,13 and doping in the polymer matrix.14 Following these methods, some materials with long lifetime and high quantum yield have been effectively prepared. However, most of them can emit, according to Kasha's rule, only from the lowest triplet level, resulting in one color emission. Very interesting are RTP materials able to cover a wide range of emission colors by simply varying the excitation wavelength. This has been achieved very rarely, e.g. by manipulation of intermolecular interactions to generate multiple color-tunable RTP emitting centres in a single-component molecular crystal15 or, very recently, amorphous polymeric films of polyphosphazene derivatives into poly(vinyl alcohol).16 However, excitation dependent emissive behaviour is a very tricky subject which needs to be treated very carefully since, often, artifacts are at the basis of multiple emission from a hypothetical single chromophore (see for example ref. 17, 18 and references therein).
We have previously reported on the intriguing photophysical behaviour of a very simple, small, nitrogen rich organic molecule, namely triimidazo[1,2-a:1′,2′-c:1′′,2′′-e][1,3,5]triazine, TT,9 and its Br- and I-derivatives.10,19,20TT is characterized by Aggregation-Induced Emission behavior, displaying, in particular, ultralong phosphorescence (RTUP) (1 s) under ambient conditions associated with the presence of H-aggregates in the crystalline structure.8 The presence of one or multiple heavy (Br and I) atoms on the TT scaffold greatly modifies both its molecular and solid state photophysical behavior, resulting in complex excitation dependent photoluminescence with emissions comprising dual fluorescence, molecular phosphorescence, supramolecular RTP and RTUP, covering a wide portion of the visible region.10,19,20 We then moved towards preparation of new TT-derivatives characterized by intense, low energy and long lasting RTP for biological applications such as lifetime imaging. To this aim, we have introduced on the triimidazolic scaffold suitable chromophoric fragments to shift the emission towards the red region while preserving the long lifetime of the triplet state. Encouraging results in this direction have just been obtained with TT-4pyF, 3-(2-fluoropyridin-4-yl)triimidazo[1,2-a:1′,2′-c:1′′,2′′-e][1,3,5]triazine, obtained by inserting the 2-fluoropyridine moiety in TT.21 This compound possesses molecular fluorescence and green phosphorescence together with aggregate RTUP at almost 600 nm. These multiple emissions are collectively activated in the solid compound with an overall quantum efficiency Φ of 25%, showing that the 2-fluoropyridine fragment provides increased molecular performances with respect to TT itself, comprising fluorescence and heavy atom free phosphorescence, but it preserves the solid state RTUP which is red-shifted (by about 70 nm) with respect to the TT parent compound.21
Here we report on the multifaceted emissive properties of 3-(pyridin-2-yl)triimidazotriazine (TT-Py), the pyridine derivative of TT where the nitrogen atom is located in the ortho position with respect to TT. It will be demonstrated how this particular geometrical disposition is responsible for different metastable states which result, in the crystalline phase, in the formation of three polymorphs and in aggregated phase in a peculiar photophysical behaviour. In fact, excitation dependent emission is observed comprising dual fluorescence and multiple RTP even in blended films.
Results and discussion
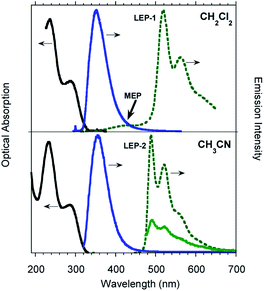
TT-Py was prepared by Stille coupling between 3-bromotriimidazo[1,2-a:1′,2′-c:1′′,2′′-e][1,3,5]triazine and 2-(tributylstannyl)pyridine (Scheme 1) and characterized by NMR spectroscopy, mass spectrometry and X-ray analysis (see ESI†). The compound was recrystallized three times before photophysical characterization in order to avoid signals due to impurities.Diluted solutions of TT-Py (10−5 M) in acetonitrile (CH3CN) and dichloromethane (CH2Cl2) in air at 298 K display absorption bands at about 235 and 290 nm and emission around 350 nm (Φ ≅ 17%; Fig. 1). Surprisingly, lifetime measurements at 355 nm reveal both a short (ns) and a long (ms) lived character (see Table 1, Fig. S8 and S9†). Moreover, while no other bands are visible in the PL (photoluminescence) spectrum, long lived components appear in both solvents when monitoring lifetimes at 400 and 500 nm (λexc = 300 nm, Fig. S10 and S11†). To better understand this observation, we analyzed both steady state and time resolved spectra of deaerated solutions.
| Sample | 298 K | 77 K | ||||||
|---|---|---|---|---|---|---|---|---|
| Φ (%) | λ abs (nm) | λ em (nm) | τ av | Origin | λ em (nm) | τ av | Origin | |
| a Time gated spectra. | ||||||||
| CH2Cl2 | 17 | 237, 290 | 351 | 0.62 ns | HEF S1–S0 | 325, 345 | 2.32 ns | HEF S1–S0 |
| 10.2 ms | HEP T6–S0 | 375 | 13.16 ms | HEP T6–S0 | ||||
| 408 | 11.01 ms | MEP T1–S0 | 393 | MEP T1–S0 | ||||
| 420a | 40 μsa | |||||||
| 500 | 12.04 ms | LEP-1 Td–S0 | 485, 518, 550a | 1.31 s | LEP-2 Td′–S0 | |||
| 520, 562, 615a | 441 μsa | |||||||
| CH3CN | 15 | 233, 285 | 355 | 1.36 ns | HEF S1–S0 | 343 | 2.46 ns | HEF S1–S0 |
| 43.47 ms | HEP T6–S0 | 388 | 17.79 ms | HEP T6–S0 | ||||
| 488, 521, 560 | 0.28 msa | LEP-2 Td′–S0 | 500 | 889 ms | LEP-2 Td′–S0 | |||
| CH3CN/H2O | 233, 280 | 345 | 79.13 ms | HEP T6–S0 | ||||
| 380–420 | MEP T1–S0 | |||||||
| 486, 515, 556 | 24.00 ms | LEP-1 Td–S0 | ||||||
| 515, 556, 610a | LEP-2 Td′–S0 | |||||||
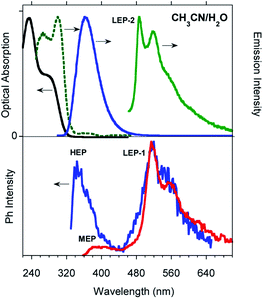
Time gated spectra of the CH2Cl2 solution show a broad band peak at about 420 nm (medium energy phosphorescence, MEP, τav = 40 μs) and a structured band at a lower energy (low energy phosphorescence, LEP-1, τ = 441 μs) with peaks at 520 and 562 nm (see Fig. 1 top and S12 and S13†). Both phosphorescences are easily quenched through oxygen diffusion inside the cell (see Fig. S14†). A similar structured, but blue-shifted, LEP (LEP-2, peaks at 488, 521 and 560 nm) is observed in deaerated CH3CN solutions (see Fig. 1 bottom) both in time gated spectra and in steady state measurements by selective excitation at 390 nm. The nature of the two types of LEP has been investigated by forcing aggregation in CH3CN through water addition. By exciting the nanoaggregated CH3CN/H2O (v/v = 50/50) deaerated solution at 390 nm, the LEP-2 spectral shape is recognized in the steady state spectrum (Fig. 2, Table 1). Accordingly, a 390 nm weak band appears in the excitation profile (PLE) of this emission (Fig. 2, green dotted line) while it is lacking in the absorption spectrum. Time gated spectra (Fig. 2 lower panel), however, display the same structured LEP-1 observed in CH2Cl2, together with an additional emission at about 345 nm (high energy phosphorescence, HEP) with lifetimes shorter than those of MEP centered at 380–420 nm. These results suggest that the two types of LEP coexist in CH3CN/H2O solutions and could be associated with the presence of different aggregated forms.
To better summarize: the long lived emissions of the present system comprise two molecular components at high and medium energy (HEP and MEP) and a low energy one (LEP), associated with aggregated species. This latter can result in two slightly different emissions (LEP-1 and LEP-2) depending on aggregation features.
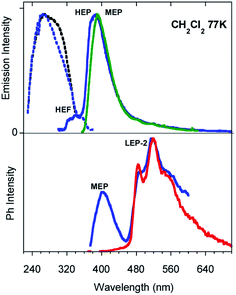
Low temperature experiments were then performed at 77 K. In CH2Cl2 an excitation dependent PL spectrum is observed (see Fig. 3 and S21†): a structured emission at about 340 nm (high energy fluorescence, HEF, τav = 2.32 ns, Fig. S22†) together with the HEP component at about 375 nm is observed by exciting at 280 nm. At a lower energy excitation (λexc 350 nm) the MEP emission appears at 393 nm (13.16 ms, Fig. S23†). Time gated emission measurements reveal a phosphorescence band at 405 nm (MEP) associated with a shoulder in the excitation spectrum at about 350 nm. The longer lived (1.31 s, Fig. S24†) structured phosphorescence resembles the LEP-2 spectral shape (485, 520, and 555 nm). Broader spectra are observed by exciting at shorter wavelengths (300 and 325 nm, Fig. S25†). Similar results are observed by lowering the temperature in other solvents (CH3CN and CH3OH/CH3CH2OH (v/v = 20/80), see Fig. S26–S30†).
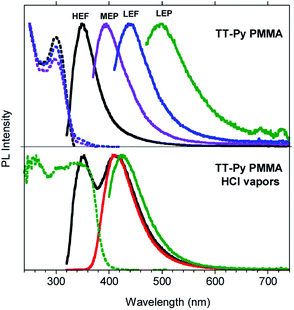
In order to gain deeper insight into the compound's photophysics and explore its applicative potential in the field of organic light emitting diodes (OLED, Fig. S31†), we prepared and characterized blended thin films of TT-Py in PMMA (w/w TT-Py/PMMA 10% and 5%). The already rich photoluminescence of the compound becomes even more complicated, displaying four different emissions which cover a large area of the PL spectrum (from 350 to 500 nm, Fig. 4, Table 2), regardless of the film concentration. These emissions can be selectively activated by proper choice of the excitation wavelength. In particular, by exciting at high energy (below 300 nm), an intense fluorescent emission (HEF, τ = 1.18 ns) at 350 nm dominates the spectrum. At 350 nm excitation, the MEP phosphorescence (13.73 ms) at 394 nm is observed. Surprisingly, an additional prompt emission band at 440 nm (3.47 ns, low energy fluorescence, LEF) appears by exciting at 390 nm (see Fig. S33–S35†). Finally, unresolved LEP at about 530 nm (Fig. S36†) already observed in solution and selectively activated by pumping at 450 nm, is observed as a broad band in time gated measurements (Fig. S37†).
| Sample | 298 K | ||||
|---|---|---|---|---|---|
| Φ (%) | λ abs (nm) | λ em (nm) | τ av | Origin | |
| a Time gated spectra. | |||||
| PMMA film | 223, 293 | 350 | 1.18 ns | HEF S1–S0 | |
| 394 | 13.73 ms | MEP T1–S0 | |||
| 440 | 3.47 ns | LEF S1,E-S0,E | |||
| 530 | 15.70 ms | LEP Td–S0 | |||
| TT-Py-A | 52 | 370 | 698 ms | HEP T6–S0 | |
| 418a | 0.29 msa | MEP T1–S0 | |||
| 450 | LEF S1,E–S0,E | ||||
| 510, 570, 608a | 2.09 msa | LEP Td–S0 | |||
| TT-Py-H | 374 | 20.38 ms | HEP T6–S0 | ||
| 408a | 0.47 msa | MEP T1–S0 | |||
| 450 | 1.91 ns | LEF S1,E–S0,E | |||
| 500 | 18.25 ms | LEP Td–S0 | |||
| 528, 562, 610a | 5.98 msa | ||||
| TT-Py-X | 362 | 91.83 ms | HEP T6–S0 | ||
| 402a | 1.31 msa | MEP T1–S0 | |||
| 466 | 4.13 ns | LEF S1,E-S0,E | |||
| 524 | 9.38 ms | LEP Td–S0 | |||
| 536, 585a | 22.60 msa | ||||
| 636, 695, 767a | 111.1 msa | DRP TH–S0 | |||
To study these different excited states activated with excitations below 300 nm and at around 390 nm in more detail, ultrafast pump-probe measurements were performed on the blended thin film (w/w TT-Py/PMMA 10%).
The measured signal is:
The ΔT/T spectra at different probe delays after excitation at the first absorption peak (290 nm) with 20 fs time resolution23 are reported in the left panel of Fig. 5. The spectra show an initial SE band at around 350 nm and two PIA bands, with peaks at 450 nm and 550 nm, PIA1 and PIA2 respectively. The temporal evolutions indicate that SE and PIA2 bands are instantaneously formed, while the PIA1 signal is delayed by about 100 fs with respect to the other two (see Fig. S38†). Based on this observation, SE and PIA2 bands can be assigned to the temporal evolution of the photo-generated excitons which give rise to the HEF stimulated emission (S1–S0) or to the photoinduced absorption band PIA2 (S1–Sn), while the band at 450 nm is associated to the generation of charged states.24 This result shows the presence of intermolecular interaction between the different molecules. To investigate the origin of the LEF emission, ΔT/T spectra at different probe delays after excitation at 390 nm (with 100 fs temporal resolution)25 have been collected (see right panel of Fig. 5). The spectra show an initial PIA band all over the visible spectral region; moreover, at long probe delays, a positive signal appears in the region between 420 nm and 550 nm, indicating emission (supposedly LEF) from a newly formed state. This formation is evident looking at the temporal evolution of the ΔT/T signal at 450 nm (Fig. S38†) which clearly indicates an initial negative signal which becomes positive in around 700 ps. Moreover, after 1 ns the signal is still growing indicating that the excitation comes from a long living initial excited state and it is likely that this emission will present a long-lived emission tail.
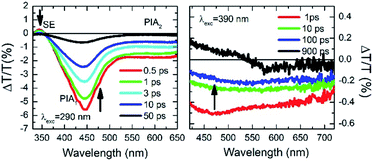 | ||
| Fig. 5 Ultrafast spectroscopy measurements on TT-Py in PMMA (w/w TT-Py/PMMA 10%). Pump-probe spectra selected at different probe delays after 290 nm (left panel) and 390 nm (right panel) excitations. | ||
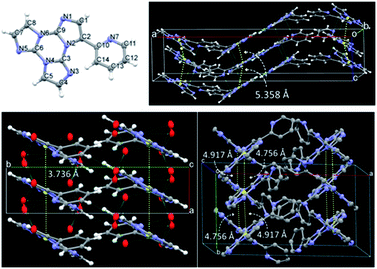
We then analyzed the single crystal photoluminescence properties (Table 2). TT-Py crystallizes in three different polymorphs (see Fig. 6). In particular, colorless single crystals are obtained as laminae (TT-Py-A), needles (TT-Py-H) and rectangular blocks (TT-Py-X), by crystallization from CH2Cl2/CH3OH, CH3CN/H2O and CH3CN respectively. X-ray diffraction analysis reveals that the three polymorphs crystallize in the Pbcn (TT-Py-A) and P21/c (TT-Py-H, TT-Py-X) space groups. TT-Py-H includes in its structure cocrystallized water molecules, that are disordered over three preferential sites. The three polymorphs share the leitmotif of TT moiety π⋯π stacking, which is already observed in both the TT prototype and its previously investigated derivatives.9,10,19–21 In TT-Py-A, adjacent TT units along the stacks are largely shifted, with respect to one another, as denoted by the distance, 5.358 Å, between respective triazinic centroids. However, several C⋯C close contacts (3.234, 3.301 Å to cite the shorter ones) are indicative of strong π⋯π stacking interactions. Along the stacks, the molecules are slightly rotated, with respect to one another in the plane of TT. In TT-Py-H, adjacent TT units overlap without any rotation and display very short slippage (the respective triazinic centroids are separated by 3.736 Å) but slightly longer C⋯C close contacts (3.309, 3.328 Å). In TT-Py-X, having two molecules in the asymmetric unit, the triazinic centroids of adjacent TT units are alternately separated by 4.756 and 4.917 Å and the shorter C⋯C contacts measure 3.373 and 3.416 Å. Along the stacks, the molecules are slightly rotated in the TT's plane, similarly to what is observed in TT-Py-A. It should be noted that in all the polymorphs, the TT moieties are strongly anchored to each other by not only π⋯π stacking interactions but also several short C–H⋯N hydrogen bonds (HBs) in the plane roughly perpendicular to the stacking axis (the shortest ones measuring 2.44, 2.50 and 2.29 Å in TT-Py-A, -H, and -X, respectively). In contrast, the pyridine moieties of TT-Py-A and TT-Py-X are involved only in weak C–H⋯π HBs and N⋯C close contacts. In TT-Py-H, though the pyridinic nitrogen atom is hydrogen bonded with the disordered cocrystallized water molecules, the high mobility of the latter could not support a rigid environment for the pyridinic ring. As a result, the tilting between TT and pyridine is slightly different in the three structures, being easily influenced by the crystal environment. The dihedral angle ω between the two moieties measures 41.5, 43.7 and 37.6/39.6° in TT-Py-A, -H, and -X, respectively, to be compared with the DFT optimized value as computed in vacuo, 36.70°. Moreover, a different relative orientation of pyridine with respect to TT is observed in TT-Py-A with respect to TT-Py-H and TT-Py-X, as indicated by the N7–C10–C2–C1 torsion angle, τ, that measures −35.18° in the former and 41.51 and 34.16/34.64° in the latter structures, respectively.
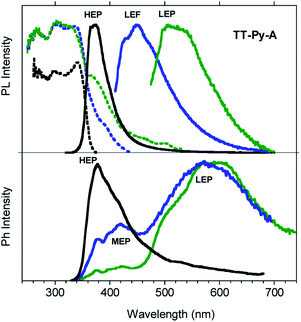
Steady state emission spectra of crystals of TT-Py-A at 298 K in air show an intense high energy ultralong lived emission at 370 nm (HEP, τav = 0.7 s, Fig. S40†) with an impressive quantum efficiency equal to 52% when excited in the 270–380 nm range (Fig. 7). However, based on the observation of multiple emissions in solution and blended films, we excited the crystals at longer wavelengths. Broad emissions centered at 450 (LEF) and 524 nm (LEP) are observed when exciting at 390 and 460 nm respectively. From time-gated spectra (Fig. 7 bottom) different phosphorescence contributions can be resolved by analyzing different delay times. At delays longer than 1 ms, the HEP peaked at 370 nm decreases in intensity and the spectral shape evolves, revealing a contribution at about 420 nm (MEP; τav = 0.29 ms) and longer-lived broad LEP at 575–615 nm (τav = 2.09 ms, Fig. S41†).
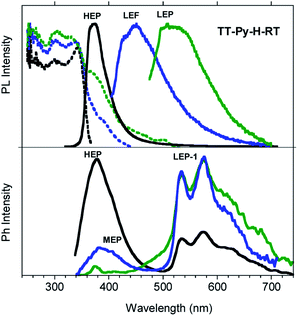
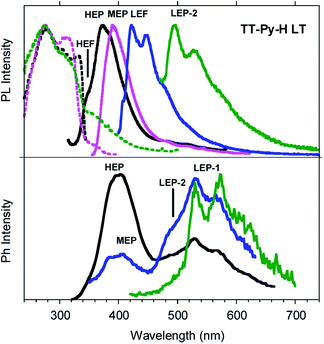
Similar results are obtained for TT-Py-H (see Fig. 8), with HEP, LEF and LEP at 374, 450 and 520 nm (20.38 ms, 1.91 ns and 18.25 ms, respectively, Fig. S43–S45†). From time-gated spectra, the HEP peak at 375 nm evolves into MEP (τav = 0.47 ms, Fig. S46†) and the structured LEP-1 at delays longer than 1 ms (λexc = 320 nm, 535, 570 and 625 nm; τav = 5.98 ms, Fig. S47†). When crystals of TT-Py-H are analysed at 77 K (see Fig. 9), HEF, HEP, LEF and LEP-2 (345, 373, 392, 420 and 493 nm) are resolved. In time gated spectra MEP and HEP emissions overlap, while, as previously observed in CH2Cl2, the spectral profile of LEP-1 is selectively activated by exciting at 400 nm.
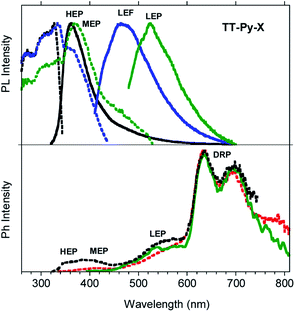
Steady state emission spectra of crystals of TT-Py-X at 298 K in air display HEP, LEF and LEPs (at 362, 466 and 524 nm, τav = 91.83 ms, 4.13 ns and 9.38 ms, respectively, see Fig. 10 top and S49 and S50†), similar to the previous phases while their phosphorescence appears more complex. In fact, in time-gated spectra (Fig. 10 bottom), structured long-lived deep red phosphorescence (DRP at 636, 695 and 767 nm, τav = 111.07 ms, Fig. S51†) dominates the spectrum at delays longer than 0.1 ms. The HEP is observed only at short delays (0.1 ms) while the longer lived MEP at 400 nm and LEP at about 530 nm (τav = 1.31 ms and 22.60 ms, respectively, Fig. S52 and S53†) are observed, the latter revealing vibronic replicas similar to those observed for TT-Py-H crystals.
The photophysical results of our target, TT-Py, highlight the presence of multiple fluorescent and phosphorescent emissions. In particular, two types of fluorescence (HEF and LEF) and four types of phosphorescence (HEP, MEP, LEPs and DRP) have been identified according to the experimental conditions and physical state of the sample. Among these, in agreement with our previous findings and based on their photophysical parameters (shape, position and lifetime), LEPs and DRP seem to be reasonably attributed to dimeric or supramolecular columnar π–π interactions among TT units. The LEP components, the only ones visible together with the HEF in all phases, appear even in diluted (10−5 M) CH2Cl2 and CH3CN solutions, where the presence of aggregated species cannot be totally excluded.26 Accordingly, geometry optimization of dimeric species extracted from the three crystal structures converges on different but almost isoenergetic stationary states characterized by large interaction energies (11.92 kcal mol−1 BSSE-corrected, for the most stable one). LEP-1 and LEP-2 may be derived from interacting TT-Py units with different conformations and/or relative orientations,27 as supported by the observation of crystallization of TT-Py in three different polymorphs. On the other hand, the DRP, which is observed only for TT-Py-X crystals, is to be related to a more specific interchromophoric interaction. By analyzing the X-ray structures of the three polymorphs, it is evident that TT-Py-X and TT-Py-H share the highest H-aggregated character. However, in TT-Py-H the co-crystallized water molecules may play the role of a vibrational quencher in this low energy emission.28
The remaining emissions, namely HEF, HEP, MEP and LEF, seem to be originated from molecular electronic states (vide infra) even though, some of them, are activated only when rigidification is achieved through intermolecular interactions. In particular, LEF is visible only in the solid state (blended films and crystals of all polymorphs).
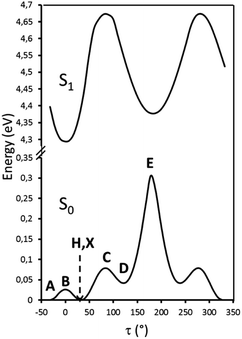
Particularly relevant in considering the molecular origin of these emissions is the comparison with the analogue TT-4pyF compound.21 For the latter, a photophysical behavior comprising fluorescence (deactivation from S1) together with molecular phosphorescence of T1–S0 origin at about 420 nm and a long lived TH–S0 H-aggregated supramolecular component at about 560 nm, has been observed. In agreement, the HEF band of TT-Py can be explained by deactivation from S1 and the compound's MEP could be as well interpreted as originated from T1 as also supported by theoretical calculations (see discussion below). More puzzling is the nature of the remaining emissions, LEF and HEP, which have been rationalized with the aid of DFT and TDDFT calculations on the optimized molecular geometry of TT-Py. Energy scan calculations around the single bond connecting TT with pyridine (see Fig. 11) reveal the presence of the two isoenergetic minima corresponding to the observed conformations with the pyridinic N atom ‘below’ (polymorph A) or ‘above’ the plane of TT (polymorphs H, X). The two minima are separated by a very low barrier (B). Another local minimum (D), higher by only ∼1 kcal mol−1 than the absolute one, corresponds to the conformation with the pyridinic N atom close to the TT one. Though this local minimum is not observed in any of the polymorphs of TT-Py, its occurrence could not be ruled out in solution, owing to the low (∼2 kcal mol−1) barrier (C) from the absolute minimum. Finally, a rotation barrier as high as 7 kcal mol−1 (E) corresponds to the conformation where two nitrogen atoms (one from Py and the other from TT) face each other.
The simulated absorption spectrum of TT-Py (see Fig. S56 and Table S2†), as derived by convolution of the singlet excitation energies computed at the absolute minimum geometry (A conformation) reproduces the UV spectrum well. In fact it shows two bands mainly corresponding to the S0–S1,A (256 nm, oscillator strength f = 0.478) and the S0–S7,A (207 nm, f = 0.428), both of 1(π,π*) character, with intermediate weaker transitions of 1(σ,π*), 1(σ/π,π*) and 1(π,π*) character. Here the σ contribution is due to occupied MOs essentially localized on one TT nitrogen atom. Though such maxima are blue-shifted with respect to the experimental ones, their separation, equal to 1.16 eV, well matches the observed one, 1.05 eV. Close to S1,A, two triplet states are computed with proper symmetries to allow easy ISC from S1,A, i.e. T7,A (254 nm, almost overlapped to S1,A) with 3(σ/π,π*) character and T6,A (278 nm) having 3(σ,π*) character. Such triplet states could be associated with the HEP observed in the emission spectrum.
Further analysis of the levels of TT-Py shows that, close to S2,A (241 nm, oscillator strength f = 0.021) of 1(σ,π*) character, there is a triplet state (T9,A, 254 nm) having 3(π,π*) character, easily populated by ISC from S2,A. T1,A, having 3(π,π*) character, is then populated from T9,A by internal conversion. This results in the MEP, which is slower than the HEP due to the different character of the corresponding emissive states (see modified Jablonski diagram, Fig. 12).
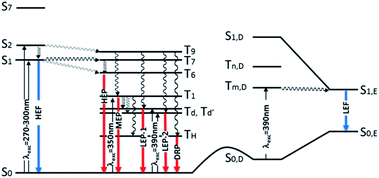 | ||
| Fig. 12 Schematic photophysical processes of TT-Py (fluorescence and phosphorescence shown as blue and red arrows, respectively). | ||
Manifestation of anti-Kasha behavior29 due to HEP emission from T6,A is associated with its (σ/π,π*) symmetry which is different from that (π,π*) of T1,A. In agreement, for TT-4pyF lacking the HEP, the computed triplet states close to S1 have the same symmetry (σ/π,π*) as T1 so that internal conversion to this state is always observed, producing only lower energy molecular phosphorescence.
Geometry optimization of the first singlet excited state S1,A of (π,π*) character leads to a planar conformation corresponding to the ‘B’ geometry of the ground state, at only slightly lower energy with respect to the Franck–Condon one. Emission from this state can be associated with the strong HEF observed in solution, films and the solid state at 350–370 nm when excited at 270–300 nm. On the other hand, calculations of excitation energies at the local minimum's geometry (point ‘D’, see Table S3†) provide a S0,D–S1,D transition of mixed (σ/π,π*) character at higher energy with respect to that computed for ‘A’, indicating that molecules which happen to be found in this conformation cannot reach their S1,D state using the same values (270–300 nm) of excitation energies. However, geometry optimization of S1,D leads to a planar conformation corresponding to the ground state's ‘E’ geometry is associated with much lower energy than the Franck–Condon one (see Table S4†). Emission from this optimized S1,E state could explain the LEF observed in films and solid state at 450 nm when excited at 390 nm. Such low excitation energy, in fact, allows for population of a triplet state with the proper (π,π*) symmetry which crosses S1,E and finally decays in the ground state. A S0,D → Tm,D → S1,E → S0,E mechanism has to be invoked since no singlet states are computed at such low (390 nm) energy, neither for the molecule (see Tables S2–S4†) nor for its dimeric aggregates (see Tables S5–S7†).
These conclusions are in agreement with the pump-probe results shown in the right panel of Fig. 5. Upon pumping directly to the Tm,D triplet state (recognizable in the spectrum from the negative PIA band Tm,D → Tn,D) the S1,E state responsible for the LEF emission is populated by intersystem crossing.24 Such a process, in principle, occurs also when exciting at higher energy (for example, by activating D conformer from S0,D to S1,D) but could not be observed because it is obscured by the much more efficient HEF emission. Moreover, its observation only in films and crystals suggests that it can be switched on only in a rigidified environment. Finally, it requires a portion of molecules to be found in the D conformation even in the crystalline state; this condition could be realized both as defects in the crystalline structure and on the crystal surfaces.
To acquire further information to be used in completing the puzzle of such intricate photophysical behavior, we exposed the TT-Py PMMA film to acidic vapors. In fact, it is expected that the protonation of the nitrogen atom on the pyridine moiety should block the free rotation around the bond connecting TT and pyridine. 30 min of exposure to HCl vapors is not enough to obtain full protonation of the pyridinic fragment, as revealed by the steady state emission spectrum of the film (see Fig. 4 bottom) which displays both the high energy fluorescence of TT-Py together with the additional intense red shifted fluorescence (412 nm, τav = 3.56 ns, Fig. S54†) of TT-PyH+. After 45 min, however, the original fluorescence had completely disappeared and only the 412 nm component is visible. By exciting at 390 nm, phosphorescence at 425 nm (τav = 13.94 ms, Fig. S55†) is observed in the spectrum of the film while the 450 nm LEF of TT-Py is missing. The original spectrum is restored by exposing the film of TT-PyH+ to NH3 vapors.
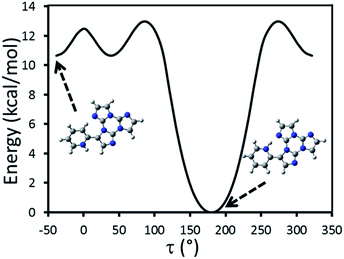
Geometry optimization of TT-PyH+, starting from the minimum energy conformation of TT-Py where a proton was added to the more basic pyridinic nitrogen, leads to a stationary point which is actually revealed to be a metastable conformation (Fig. 13). A relaxed energy scan of TT-PyH+, in fact, shows that a much more stable (>10 kcal mol−1) minimum is observed when the pyridinic protonated nitrogen atom and the one on TT are facing each other, according to a geometry reminiscent of the proton sponge one.30 The two minima are separated by a low (∼2 kcal mol−1) energy barrier, indicating a quantitative transformation from the higher to the lower energy minimum at room temperature. TDDFT calculations were then performed on the more stable conformation of TT-PyH+, confirming the red-shifted fluorescence observed experimentally (see Table S8 and Fig. S56†). Importantly, the absence of the low energy fluorescence at 450 nm is predicted by the rigidity of the TT-PyH+ scaffold.
Conclusions
A new single-component AIE material, based on the simple 3-(pyridin-2-yl)triimidazotriazine (TT-Py) organic molecule, is reported here. Under ambient conditions, it shows excitation-dependent fluorescence and phosphorescence in both blended films and three different crystalline phases. In particular, HEF, HEP, MEP and LEF emissions of molecular origin, together with LEPs and DRP aggregated RTPs, can be activated by proper excitation wavelength thus covering the entire visible region.This color-tunable property is derived, in a combined way, from the specific aggregation features of the TT scaffold on one side and, on the other, from the relative conformational freedom of the pyridinic pendant and the peculiar position of its nitrogen atom (in ortho with respect to TT). More precisely, strong π–π stacking interactions among TT moieties and very short C–H⋯N hydrogen bonds, granting high molecular rigidity, provide the prerequisites for long-lived luminescence of aggregated (red and deep red RTPs) and molecular (blue and green RTPs, according to the symmetry of the involved excited state) origin, respectively. Moreover, the partial mobility of the pyridinic fragment is responsible not only for the low-energy fluorescence, originated from a distinctive shape of ground and excited state potential energy surfaces, but also for multiple aggregate-derived RTPs, associated with the presence of different aggregation motifs of stable and metastable states.
Such an extremely rich photophysical behavior of TT-Py, together with its implementation in flexible films allowing easy fabrication and processability, make the proposed material a promising platform for applications in information storage, security encryption, sensing and display.
Conflicts of interest
There are no conflicts to declare.Acknowledgements
The use of instrumentation purchased through the Regione Lombardia-Fondazione Cariplo joint SmartMatLab Project is gratefully acknowledged. A.F. thanks Mr. Pietro Colombo for support in single crystal X-ray data collection. TV and LG acknowledge the financial support from the Regione Lombardia project “I-Zeb”.Notes and references
- W. Qin, P. Zhang, H. Li, J. W. Y. Lam, Y. Cai, R. T. K. Kwok, J. Qian, W. Zheng and B. Z. Tang, Chem. Sci., 2018, 9, 2705 RSC.
- L. Gu, H. Wu, H. Ma, W. Ye, W. Jia, H. Wang, H. Chen, N. Zhang, D. Wang, C. Qian, Z. An, W. Huang and Y. Zhao, Nat. Commun., 2020, 11, 944 CrossRef CAS PubMed.
- R. Gao and D. Yan, Chem. Commun., 2017, 53, 5408 RSC.
- S. Hirata, K. Totani, H. Kaji, M. Vacha, T. Watanabe and C. Adachi, Adv. Opt. Mater., 2013, 1, 438 CrossRef.
- W. Zhao, Z. He, J. W. Y. Lam, Q. Peng, H. Ma, Z. Shuai, G. Bai, J. Hao and B. Z. Tang, Chem, 2016, 1, 592 CAS.
- S. Xu, Y. Duan and B. Liu, Adv. Mater., 2020, 32, 1903530 CrossRef CAS PubMed.
- P. Alam, N. L. C. Leung, J. Liu, T. S. Cheung, X. Zhang, Z. He, R. T. K. Kwok, J. W. Y. Lam, H. H. Y. Sung, I. D. Williams, C. C. S. Chan, K. S. Wong, Q. Peng and B. Z. Tang, Adv. Mater., 2020, 2001026 CrossRef CAS PubMed.
- Z. An, C. Zheng, Y. Tao, R. Chen, H. Shi, T. Chen, Z. Wang, H. Lin, R. Deng, X. Liu and W. Huang, Nat. Mater., 2015, 14, 685 CrossRef CAS PubMed.
- E. Lucenti, A. Forni, C. Botta, L. Carlucci, C. Giannini, D. Marinotto, A. Previtali, S. Righetto and E. Cariati, J. Phys. Chem. Lett., 2017, 8, 1894 CrossRef CAS PubMed.
- E. Lucenti, A. Forni, C. Botta, L. Carlucci, C. Giannini, D. Marinotto, A. Pavanello, S. Righetto and E. Cariati, Angew. Chem., Int. Ed., 2017, 56, 16302 CrossRef CAS PubMed.
- R. Kabe and C. Adachi, Nature, 2017, 550, 384 CrossRef CAS PubMed.
- O. Bolton, K. Lee, H.-J. Kim, K. Y. Lin and J. Kim, Nat. Chem., 2011, 3, 205 CrossRef CAS PubMed.
- H. Shi, Z. An, P.-Z. Li, J. Yin, G. Xing, T. He, H. Chen, J. Wang, H. Sun, W. Huang and Y. Zhao, Cryst. Growth Des., 2016, 16, 808 CrossRef CAS.
- Z. Lin, R. Kabe, N. Nishimura, K. Jinnai and C. Adachi, Adv. Mater., 2018, 8, 1803713 CrossRef PubMed.
- L. Gu, H. Shi, L. Bian, M. Gu, K. Ling, X. Wang, H. Ma, S. Cai, W. Ning, L. Fu, H. Wang, S. Wang, Y. Gao, W. Yao, F. Huo, Y. Tao, Z. An, X. Liu and W. Huang, Nat. Photonics, 2019, 13, 406 CrossRef CAS.
- Z. Wang, Y. Zhang, C. Wang, X. Zheng, Y. Zheng, L. Gao, C. Yang, Y. Li, L. Qu and Y. Zhao, Adv. Mater., 2020, 32, 1907355 CrossRef CAS PubMed.
- C. J. Chen, Z. G. Chi, K. C. Chong, A. S. Batsanov, Z. Yang, Z. Mao, Z. Y. Yang and B. Liu, ChemRxiv DOI:10.26434/chemrxiv.9895724.v1.
- A. P. Demchenko, V. I. Tomin and P.-T. Chou, Chem. Rev., 2017, 117, 13353 CrossRef CAS PubMed.
- E. Lucenti, A. Forni, C. Botta, L. Carlucci, A. Colombo, C. Giannini, D. Marinotto, A. Previtali, S. Righetto and E. Cariati, ChemPhotoChem, 2018, 2, 801 CrossRef CAS.
- E. Lucenti, A. Forni, C. Botta, C. Giannini, D. Malpicci, D. Marinotto, A. Previtali, S. Righetto and E. Cariati, Chem.–Eur. J., 2019, 25, 2452 CrossRef CAS PubMed.
- A. Previtali, E. Lucenti, A. Forni, L. Mauri, C. Botta, C. Giannini, D. Malpicci, D. Marinotto, S. Righetto and E. Cariati, Molecules, 2019, 24, 2552 CrossRef CAS PubMed.
- G. Cerullo, C. Manzoni, L. Lüer and D. Polli, Photochem. Photobiol. Sci., 2007, 6, 135 RSC.
- R. Borrego-Varillas, L. Ganzer, G. Cerullo and C. Manzoni, Appl. Sci., 2018, 8, 989 CrossRef.
- O. Svelto, Principles of Lasers, Springer, Boston, MA, 5th edn, 2010 Search PubMed.
- A. Portone, L. Ganzer, F. Branchi, R. Ramos, M. J. Caldas, D. Pisignano, E. Molinari, G. Cerullo, L. Persano, D. Prezzi and T. Virgili, Sci. Rep., 2019, 9, 7370 CrossRef PubMed.
- H. Kang, A. Facchetti, P. Zhu, H. Jiang, Y. Yang, E. Cariati, S. Righetto, R. Ugo, C. Zuccaccia, A. Macchioni, C. L. Stern, Z. Liu, S.-T. Ho and T. J. Marks, Angew. Chem., Int. Ed., 2005, 44, 7922 CrossRef CAS PubMed.
- Y. Wang, J. Yang, Y. Tian, M. Fang, Q. Liao, L. Wang, W. Hu, B. Z. Tang and Z. Li, Chem. Sci., 2020, 11, 833 RSC.
- J.-C. G. Bünzli and C. Piguet, Chem. Soc. Rev., 2005, 34, 1048 RSC.
- Y.-H. Wu, H. Xiao, B. Chen, R. G. Weiss, Y.-Z. Chen, C.-H. Tung and L.-Z. Wu, Angew. Chem., Int. Ed., 2020, 59, 10173 CrossRef CAS PubMed.
- A. L. Llamas-Saiz, C. Foces-Foces and J. Elguero, J. Mol. Struct., 1994, 328, 297 CrossRef CAS.
Footnotes |
| † Electronic supplementary information (ESI) available: NMR and mass spectra, photophysical data and spectra, single crystal X-ray crystallographic data, theoretical details and CIF files. CCDC 1998787–1998789. For ESI and crystallographic data in CIF or other electronic format see DOI: 10.1039/d0sc02459g |
| ‡ These authors contributed equally. |
| This journal is © The Royal Society of Chemistry 2020 |


