
 Open Access Article
 This Open Access Article is licensed under a Creative Commons Attribution-Non Commercial 3.0 Unported Licence
In situ tissue pathology from spatially encoded mass spectrometry classifiers visualized in real time through augmented reality†
Michael
Woolman‡
ab,
Jimmy
Qiu‡
a,
Claudia M.
Kuzan-Fischer
cf,
Isabelle
Ferry
cf,
Delaram
Dara
a,
Lauren
Katz
ab,
Fowad
Daud
ab,
Megan
Wu
c,
Manuela
Ventura
a,
Nicholas
Bernards
a,
Harley
Chan
a,
Inga
Fricke
 a,
Mark
Zaidi
a,
Brad G.
Wouters
ab,
James T.
Rutka
cdf,
Sunit
Das
cdf,
Jonathan
Irish
a,
Robert
Weersink
a,
Howard J.
Ginsberg
ade,
David A.
Jaffray
ab and
Arash
Zarrine-Afsar
*abde
a,
Mark
Zaidi
a,
Brad G.
Wouters
ab,
James T.
Rutka
cdf,
Sunit
Das
cdf,
Jonathan
Irish
a,
Robert
Weersink
a,
Howard J.
Ginsberg
ade,
David A.
Jaffray
ab and
Arash
Zarrine-Afsar
*abde
aTechna Institute for the Advancement of Technology for Health, University Health Network, 100 College Street, Room 7-207, MaRS Building, Princess Margaret Cancer Research Tower, 7th floor (STTARR), Toronto, ON M5G 1P5, Canada. E-mail: arash.zarrine.afsar@utoronto.ca; Tel: +1-416-581-8473
bDepartment of Medical Biophysics, University of Toronto, 101 College Street, Toronto, ON M5G 1L7, Canada
cPeter Gilgan Centre for Research and Learning, Hospital for Sick Children, 686 Bay Street, Toronto, ON M5G 0A4, Canada
dDepartment of Surgery, University of Toronto, 149 College Street, Toronto, ON M5T 1P5, Canada
eKeenan Research Center for Biomedical Science, The Li Ka Shing Knowledge Institute, St. Michael's Hospital, 30 Bond Street, Toronto, ON M5B 1W8, Canada
fArthur and Sonia Labatt Brain Tumor Research Centre, The Hospital for Sick Children, Toronto, ON M5G 1X8, Canada
First published on 23rd July 2020
Abstract
Integration between a hand-held mass spectrometry desorption probe based on picosecond infrared laser technology (PIRL-MS) and an optical surgical tracking system demonstrates in situ tissue pathology from point-sampled mass spectrometry data. Spatially encoded pathology classifications are displayed at the site of laser sampling as color-coded pixels in an augmented reality video feed of the surgical field of view. This is enabled by two-way communication between surgical navigation and mass spectrometry data analysis platforms through a custom-built interface. Performance of the system was evaluated using murine models of human cancers sampled in situ in the presence of body fluids with a technical pixel error of 1.0 ± 0.2 mm, suggesting a 84% or 92% (excluding one outlier) cancer type classification rate across different molecular models that distinguish cell-lines of each class of breast, brain, head and neck murine models. Further, through end-point immunohistochemical staining for DNA damage, cell death and neuronal viability, spatially encoded PIRL-MS sampling is shown to produce classifiable mass spectral data from living murine brain tissue, with levels of neuronal damage that are comparable to those induced by a surgical scalpel. This highlights the potential of spatially encoded PIRL-MS analysis for in vivo use during neurosurgical applications of cancer type determination or point-sampling in vivo tissue during tumor bed examination to assess cancer removal. The interface developed herein for the analysis and the display of spatially encoded PIRL-MS data can be adapted to other hand-held mass spectrometry analysis probes currently available.
Introduction
The past decade has seen a substantial increase of publications describing the developments of a variety of hand-held mass spectrometry analysis probes, capable of determining tissue pathology with only a few seconds of sampling and analysis time.1–5 These probes utilize, in the hand-held configuration, aerosolization or liquid sampling mechanisms to extract tissue molecules in a form that could be transported to an ionization interface. Then, a molecular readout of the tissue extracted molecules takes place inside a mass spectrometer.6–8 This mass spectrometric readout creates a mass to charge ratio (m/z) profile, fingerprint or tissue molecular signature pattern that is highly specific to both the tissue type and pathology.6–8 Through molecular ‘fingerprinting’ with mass spectrometry, it is also possible to distinguish between different cancer types of the same tissue, even when these include histologically identical yet molecularly (and clinically) distinct subtypes of the same tumor.3,6–8 Pathology or tissue type classifications with mass spectrometry often utilize multivariate statistical methods. The recorded mass spectra of the specimen under study are compared with the mass spectral profile(s) of histologically classified tissue types (molecular signature library) to determine the pathology of said specimen based on profile matching.6–8Sampling with a mass spectrometry probe generally requires a few (∼5–10) seconds worth of mass spectral data acquisition to accumulate and average the signal prior to performing multivariate statistical comparisons. The execution of the multivariate ‘profile-matching’ step that is required to produce the mass spectrometry-based tissue type or pathology classifiers is typically completed in less than one second. Therefore, in combination with rapid mass spectral processing techniques such as ‘binning’ that can also be implemented within milliseconds after data acquisition, mass spectrometry classifiers from ‘profile matching’ that report on tissue pathology can be available almost immediately after the conclusion of the 5–10 second sampling event.1–5,9,10 Thus, systems for near real-time determination of tissue pathology in situ are already available that can deliver pathology classifiers from comparison of near real-time mass spectrometric data to tissue fingerprint databases within a few (∼5–10) seconds from the start of the sampling process. An example of such platform is online or Abstract Model Builder (AMX) software from Waters11 that has been interfaced with a variety of mass spectrometry sampling probes,3,4 in addition to its early implementation with electrocautery utilizing molecular readout of tissue aerosols present in the surgical smoke, otherwise a waste material, to provide information about its pathology.5
The hand-held probes referenced above employ a variety of vastly different tissue sampling methods that encompass aerosols generated during electrocautery from different electrode geometries2 or other surgical aspiration methods,5 a variety of lasers,3–5,12,13 or even gentle liquid extraction methods.1 These mechanistic differences lead to two important probe-specific, attributes of: (1) varying levels of damage to the sampled tissue (or damage spread outside the immediately sampled region), and (2) varying spatial resolution. These attributes in turn define probe suitability for in vivo applications such as tumor bed assessments, where sampling with the said probe must be accompanied with minimal (or acceptable) levels of damage to the healthy tissue. Here, the development of the MasSpec pen, with demonstrated utility for successful in vivo sampling without the adverse effects of significant damage to the tissue or carry over,1 that uses a drop of water for non-destructive sampling of soluble tissue molecules has created an impetus to revisit in vivo applications of other hand-held mass spectrometry analysis probes. In situ determination and visualization of tissue pathology upon in vivo sampling is expected to help advance surgical decision-making by rapidly revealing areas of pathology such that immediate action can be taken to address them. For this purpose, technologies that can correlate, in real-time, tissue pathology from mass spectrometry classifiers to the coordinates of a sampled site must be developed. It must be emphasized that MS sampling methods optimized for spatially resolved ex vivo tissue use in this mode of analysis will not benefit from augmentation with such developments.
Through co-registration of a real-space (surgical field of view) image with pre-operative images such as Magnetic Resonance (MR) or Computed Tomography (CT) that contain pathology information, it is possible to direct surgical tools to the disease site(s) with millimeter or submillimeter accuracy depending on the application.14,15 Surgical navigation technologies exist that allow for both co-registration and tracking of tools in real-time allowing mapping of the pathology information from pre-operative images in real space.14,15 In principle, in situ mapping of the areas of pathology from mass spectrometry classifications can also be achieved by spatially encoding tissue classifiers using the same surgical positioning principles routinely used to track surgical tools in real time. While mass spectrometric classifications from stereotactic resections analyzed ex vivo have been displayed on pre-operative magnetic resonance (MR) images to guide surgery,16,17 a two-way communication between mass spectrometry classifiers and surgical positioning technologies to display spatially encoded mass spectrometry classifiers at the site of sampling in real space has not been reported. This combination allows mapping tissue pathology from mass spectrometry classification at the site of sampling.
In this work, we describe our adaption of a passive optical three dimensional (3D) surgical tracking technology14,15 for two-dimensional (2D) display of mass spectrometry classification and pathology results in near real-time and at the site of sampling through an augmented reality display. The performance of the platform was validated using a variety of xenograft models bearing human cancers. This proof-of-principle work used a previously described hand-held, picosecond infrared laser based mass spectrometry sampling probe (PIRL-MS),18,19 shown to be capable of classifying human pediatric medulloblastoma brain tumors into their clinically important molecular subgroups with 10 seconds of sampling.3 The potential of PIRL-MS for pediatric neurosurgical applications highlighted in our previous work motivates a detailed assessment of the extent of picosecond infrared laser damage to neuronal tissue during in vivo applications, especially in the context of the proposed spatially encoded in situ pathology platform.3 Through end-point immunohistopathological analyses in a murine model of brain tissue, we further examined damage caused by PIRL-MS sampling to normal brain matter in vivo under the real-use scenario of acquiring classifiable PIRL-MS spectra. We demonstrate that the PIRL-MS methodology is non-inferior to the widely used surgical scalpel in terms of DNA damage, cell death and neuronal viability, increasing the relevance for in vivo applicability. While the platforms established in this work for spatially encoded mass spectrometry-based pathology information were validated with the PIRL-MS technology, they are generalized solutions that can easily be adapted to all other hand-held mass spectrometry analysis probes referenced above.
Materials and methods
Integration of GTxEyes and AMX for spatially encoded MS
The PIRL probe was combined with an optical navigation system (NDI Polaris) and custom 3D visualization software (GTxEyes).20–22 The optical navigation system used two infrared (IR) light cameras to track an IR sensor made up of four passive IR reflective spheres attached to the laser probe. A separate four-sphere IR sensor was also attached to a Logitech C920 USB camera to spatially correlate the tracked probe position with respect to the camera. The optical navigation system and custom software have been previously described,20–22 including use in cone beam computed tomography (CBCT)-guided osteotomies,21 quantitative endoscopy to improve superficial disease delineation in radiation therapy,22 and combination of CBCT with endoscopy for head and neck surgery.20 The GTxEyes custom software enabled co-registration and real-time visualization of tracked instruments with imaging modalities and parametric information such as computed tomography (CT), magnetic resonance (MR) and optical imaging combined with surgical or radiotherapy planning data. The software also performs offset correction for tracked and calibrated optical cameras, with the attached IR spheres registered to the optical center of the camera.20,22For this study, the tracking camera of the optical navigation system mentioned above and the Logitech C920 camera were placed in a biological safety cabinet with the laser probe in view of the Logitech C920 and both IR sensors of the laser probe and Logitech C920 in visual line of sight of the tracking camera. The tip position of the laser probe with respect to the attached IR sensor was determined using a pre-calibrated pointer tracked by the optical navigation system to an ablative point beyond the probe tip through ‘picking’ its burn spot, as well as through a virtual pointer model of ablation taking place ∼2 mm away from the laser fibre tip on the surface of the tissue.23 A laptop running the GTxEyes software was connected to the optical navigation system, the Logitech C920 camera, and mass spectrometry data collection and processing computer via Ethernet connection. The GTxEyes software simultaneously collected tracking measurements of the laser probe and the Logitech C920 camera, performed back projecting to determine corresponding pixel locations, and colorized the pixels according to classifier results based on the output from the mass spectrometry analysis computer.
The mass spectra were processed against pre-trained models in the Waters AMX Recognition software utilizing principal component analysis linear discriminant analysis (PCA-LDA).11 The custom GTxEyes software integrated an OpenIGTLink23 client to poll and stream classification results with the AMX Recognition software's built in OpenIGTLink server. Each classification frame contained a tissue classification ID, and a timestamp. A color lookup table was then created in the GTxEyes software to match the label colors as in AMX Recognition for each classification. The color lookup table mapped the received tissue classification ID to an RGB tuple. For a tracked laser probe position, tip location in pixel coordinates was determined via back projection through the intrinsic and extrinsic parameters of a Logitech C920 camera, determined through camera calibration and the optical navigation system respectively as detailed in the ESI.† The pixel location was then computed in real-time via GTxEyes for each IR sensor measurements for the laser probe and Logitech C920 camera. Upon receiving a classifier output frame from AMX Recognition, the GTxEyes software colors the corresponding pixel of the Logitech C920 video frame according to its RGB value in the lookup table.
Additional details on the generation of animal model xenografts, PIRL-MS analysis as well as craniotomy and histological analysis are provided in the ESI.†
Results and discussion
Creation of spatially encoded mass spectrometry platform through integration of AMX with GTxEyes
To create a platform for spatially encoded mass spectrometry pathology, we first augmented a custom-built handpiece bearing the fiber tip of a picosecond infrared laser, used previously for 10 second classification of cancer types in conjunction with multivariate statistical analysis methods3,19 and optical tracking technology.24 This was achieved by 3D printing a custom, lightweight attachment point that mounts optically reflective beacons from a Polaris optical tracking toolkit (NDI) at a known offset from the fiber tip (details are included in the Experimental section and ESI†). This configuration, upon calibration and setting of the offset value above, allowed for tracking of the PIRL fiber tip using 3D positioning and calibration protocols previously developed and implemented by our group for the display of positioning feedback on a video feed.25Fig. 1A illustrates the components required for spatially encoded mass spectrometry with real space augmented reality display, and Fig. 1B illustrates the schematics of the trackable fiber tip. As illustrated here, both the fiber tip and the video camera that records the surgical field of view are tracked using navigation beacons. A custom built program (GTxEyes) previously used to import, display and co-register spatially encoded information from a variety of imaging modalities and surgical tools and technologies tracked in real space25–27 was interfaced with the real-time mass spectrometry classification platform AMX (Waters).11 AMX's recognition module creates a tissue classification by comparing the mass spectrum of a tissue to those of a tissue type signature library using multivariate statistical analysis. The coupling between GTxEyes25 and AMX,11 through a custom code, allowed mass spectrometry classifiers produced from AMX recognition module after 5–10 seconds of PIRL-MS sampling to be imported into GTxEyes for real-time, augmented reality display on the video of the sampling field of view.25
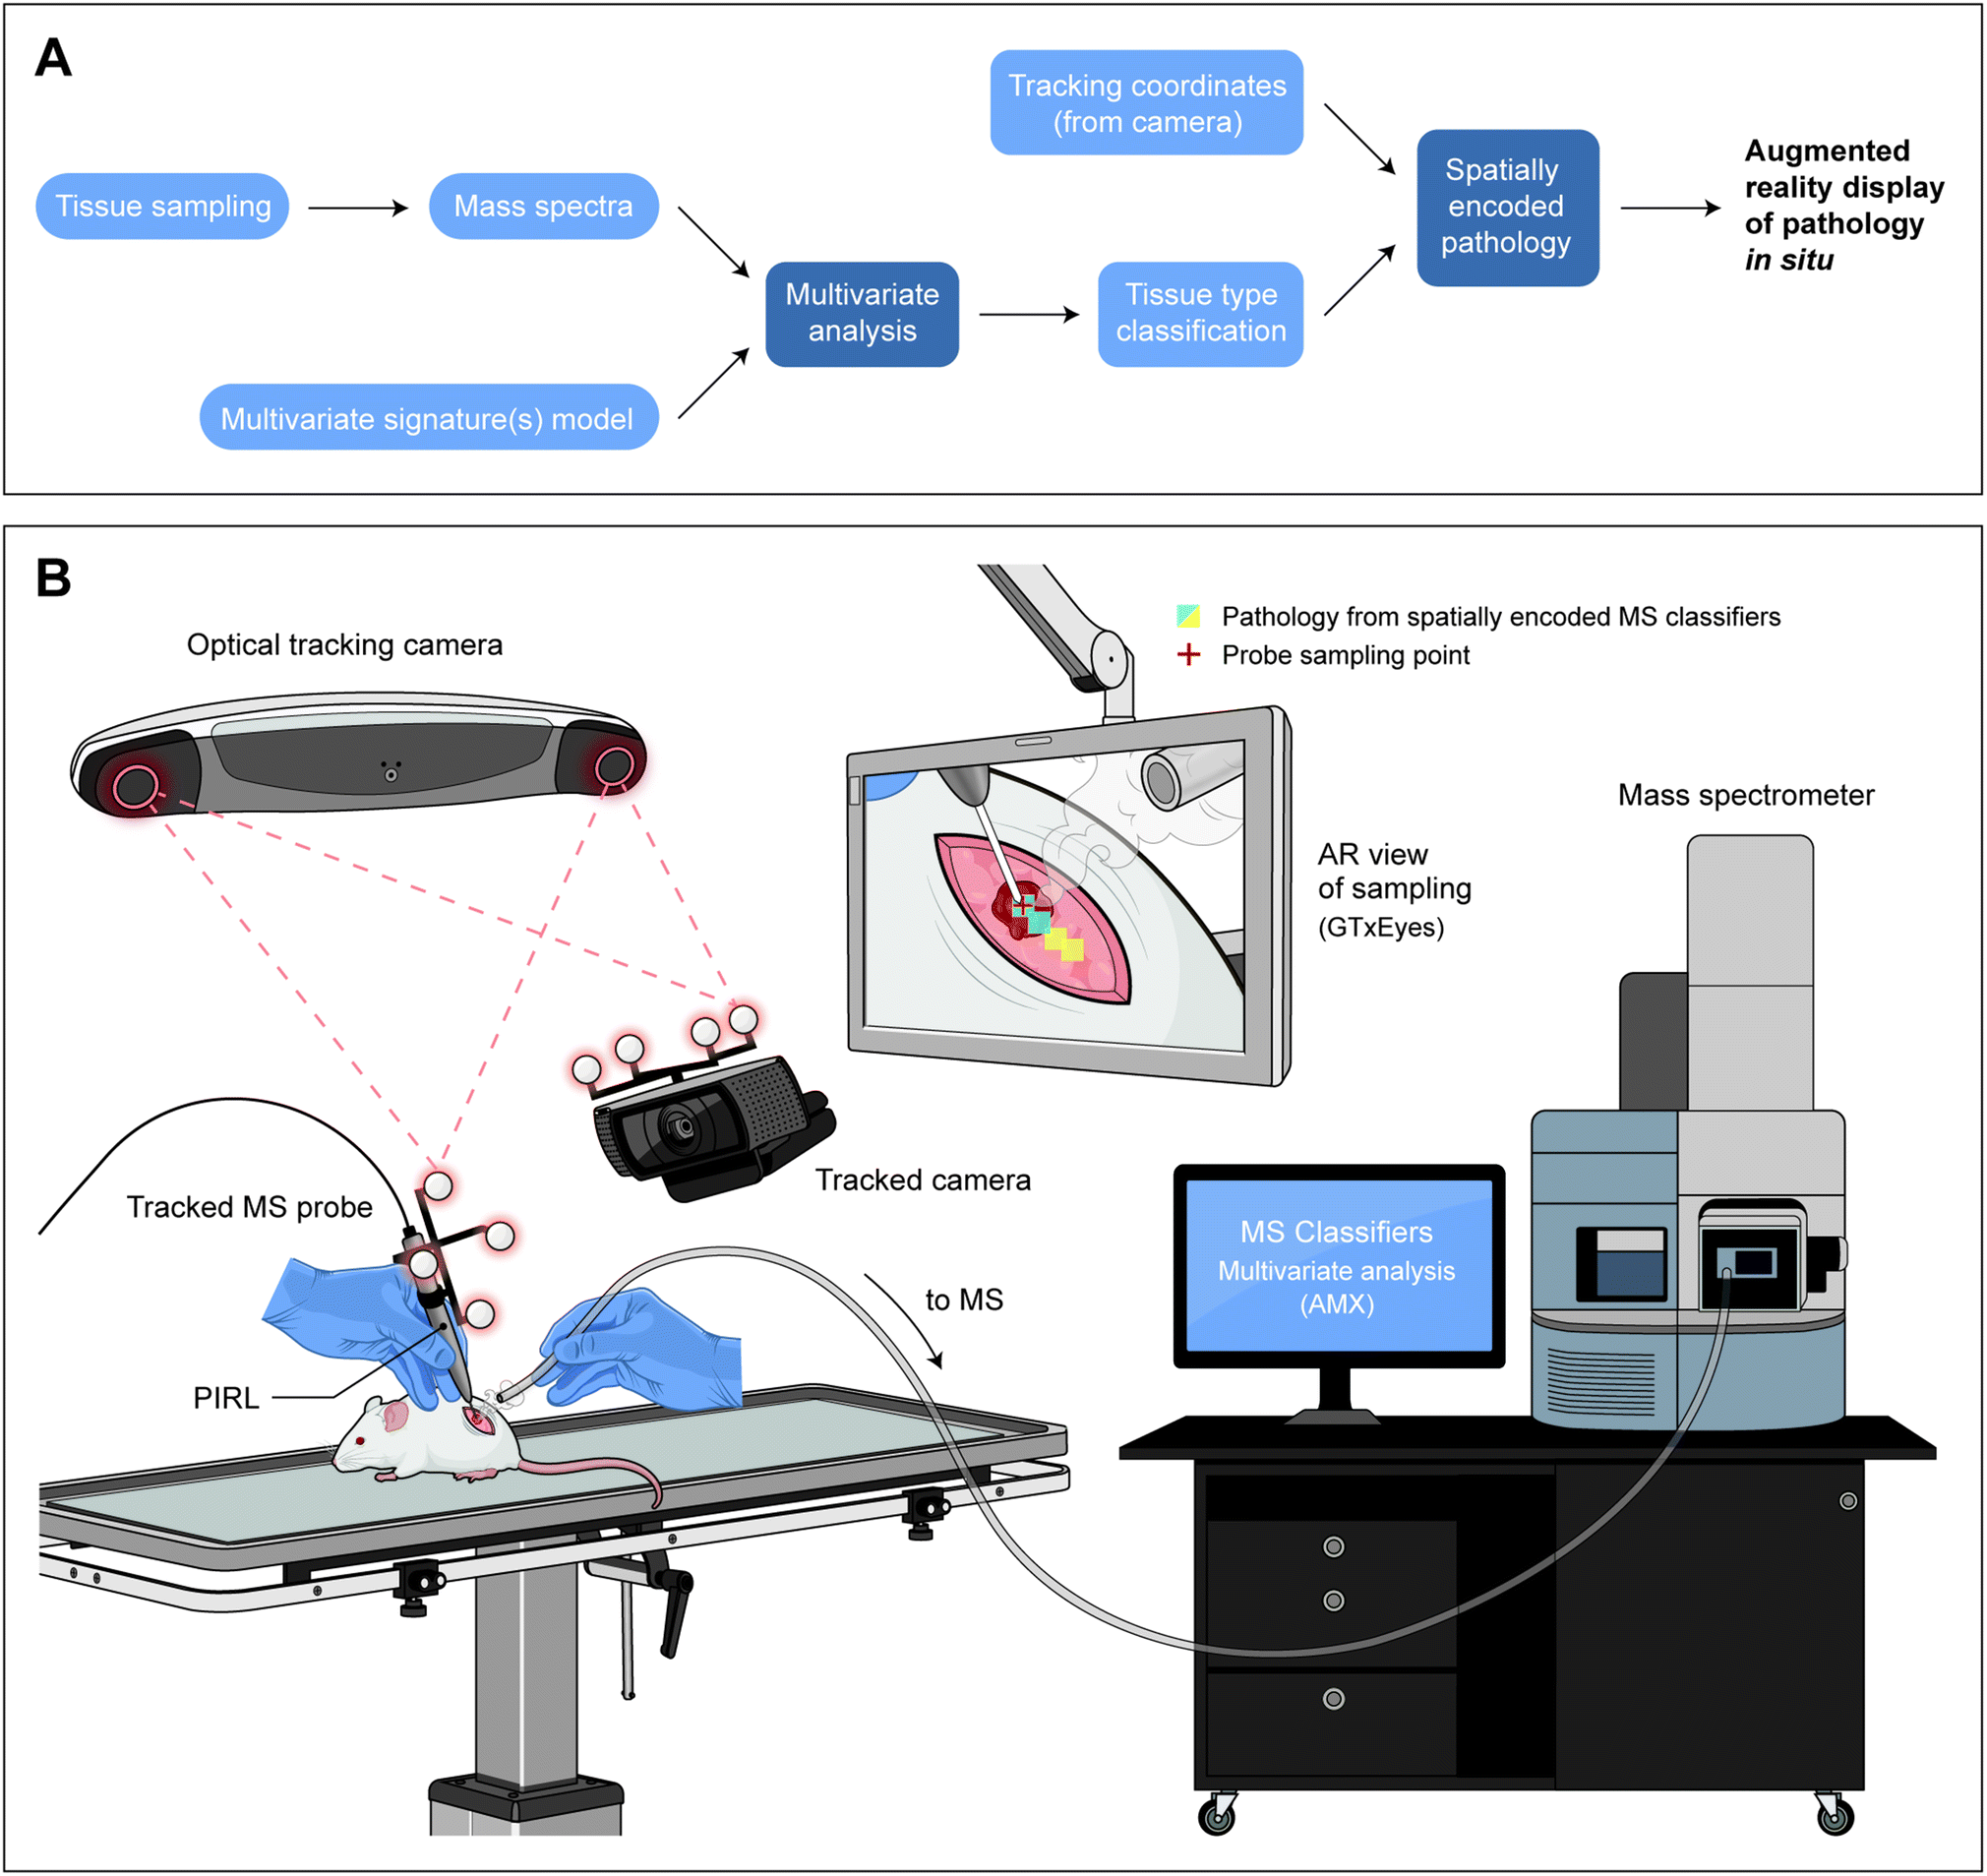 | ||
| Fig. 1 Spatially encoded mass spectrometry results for augmented reality display of tissue pathology at the point of sampling. In this figure we have shown (A): the components required for spatially encoded mass spectrometry for in situ display of tissue pathology at the sampling site, and how components interact with one another. Sampling of tissue is performed using an aerosolization method to produce mass spectra. The mass spectral data is then compared to a pre-existing multivariate model (or library) of pathologies and a classification is made. In the case of our demonstrated application, the sampling is performed with PIRL-MS and the multivariate analysis is completed with AMX using PCA-LDA.11 The pathology classification is available in real-time, and is combined with positional information (coordinates) of the sampling probe from the tracking data imported into a laboratory built ‘integrator’ program, GTxEyes.25–27 The import is enabled through a custom-made link that transfers the classifier from AMX to GTxEyes. Then, a real-time display of the color coded pathology (in GTxEyes) becomes possible using previous integration of a camera feed of the sampling field of view in this software.25 (B) Schematics of the system components in panel A and how they interact. Where appropriate, we have secured permission to reuse graphics. The NDI Polaris tracking camera monitors the probe position as well as that of the Logitech tracked camera that provides the live video feed of the sampling event. MS signal is processed and subjected to multivariate analysis with AMX. All components feed data to GTxEyes platform that in turn integrates the molecular information from MS analysis with positioning data for augmented reality display of spatially encoded mass spectrometry classifiers. Here, in situ sampling of a mouse xenograft tumor results in tissue type classifier from MS to be false colored and displayed on an augmented reality screen at the site of sampling. Conceptual demonstration of the output display of spatially encoded mass spectrometry using graphic files partially published previously3,18,47 (with permission from the Royal Society of Chemistry and the American Association for Cancer Research). Graphic files are reproduced here after modifications, and illustrate the output display using PIRL-MS and xenograft tissue. | ||
Performance validation of the spatially encoded mass spectrometry platform
The evaluation of the performance of spatially encoded mass spectrometry pathology consists of two key metrics of (1) pixel error in the display of spatially encoded pathology results at the site of sampling, and (2) the success rate in determining correct pathology. The latter is a property of the PIRL-MS analysis rather than spatially encoded mass spectrometry and could be as high as 98%,3 as discussed in previous publications for other tissue classifications using ex vivo samples.3,18,19 We, however, revisited the classification accuracy using in situ cancer models to assess whether statistical models built from sampling ex vivo tissue could be used to classify cancer sampled in vivo, with results unaffected by the presence of body fluids.To display a 3D spatial measurement on a 2D video feed using augmented reality, we calibrated the accuracy of co-registration of mass spectrometry classifiers (pixel error) using a checkerboard pattern as described in the ESI.† Using known 3D positions at varying z-distances (axis of the laser fiber, surface of the tissue) to the camera, each z-distance possessed a corresponding ‘jitter’ per pixel. When back projected into the camera with the calibrated model, we determined the pixel error at that z-distance and hence the expected pixel error. This measurement resulted in a 2D pixel error of 0.5 ± 0.2 mm (on video feed display) where the accuracy depends on various factors including the relative angle of the camera and probe as well as relative distances between tracking camera and tracked objects (video camera, laser tip) and the z-distance (see ESI† for more details). We also further evaluated the positional errors resulting from hand tremor (i.e. jitter in holding objects) and depth perception arising from use of a virtual pointer (laser tip is held ∼2 mm from the surface of the tissue). Using the same optical positioning system used in our experiments, users tracked a 5 cm line on a flat surface in both the ‘contact mode’ where the guide pointer was supported by the surface through direct contact, and in non-contact ‘hand-held’ mode, held ∼2 mm from the surface of the sampled plane without support (see ESI† for more details). Estimates of the lateral deviation of the projected X,Y errors from the sampled line suggests positional accuracy of 0.4 ± 0.1 mm from the intended sampling site (in the contact mode) and 2.1 ± 0.4 mm (once held in air ∼2 mm from the surface). As the pixel error measurements in the latter case were performed in the hand-held configuration, the overall practical combined system technical + user error value of 2.6 ± 0.4 mm per pixel was determined for augmented reality co-registration including positioning errors associated with involuntary hand movements while holding the fiber tip. With the incorporation of a guide pointer in the contact mode to affix the virtual ablation point 2 mm from the surface of tissue, the pixel error is reduced to 1.0 ± 0.2 mm. This value thus reports technical system uncertainties for augmented reality co-registration of spatially encoded mass spectrometry classifiers in a video feed. The proposed ‘contact’ and ‘non-contact’ modes constitute two extreme scenarios of deployment based on the nature of the surgical procedure. In this manuscript, all measurements were performed in a supported ‘contact mode’ where user's wrist was supported by the laboratory bench yet the probe was held ∼2 mm above the specimen. Therefore, the technical system uncertainty is expected to be closer to the examined supported mode value of 1.0 ± 0.2 mm.
ESI Video 1† shows an example output of spatially encoded mass spectrometry pathology using a human-generated artificial interface between a sample of brain tumor and healthy tissue, generating a mimic of a cancer and healthy tissue border in tumor bed examination. This was created by placing a piece of normal mouse brain tissue next to a medulloblastoma brain cancer xenograft tumor piece.19 This is an example of a highly homogeneous non-infiltrating tumor with clear borders. Here, PIRL-MS data was collected during the continuous movement of the laser probe at the average speed of ∼0.50 mm s−1. Every 5 seconds, the MS spectra were averaged and analyzed by AMX's PCA-LDA recognition module based on a two-component model comprised of Med8A (a medulloblastoma cell line), and healthy mouse brain PIRL-MS spectra.19 When used in a continuous scanning mode as shown in the ESI Video 1,† discrete readouts every 5 seconds accumulate the spatial information over the distance sampled in that 5 seconds that are displayed at the pixel position at the end of the 5 second sampling event. The comparison with the healthy brain tissue and cancer PCA-LDA model produced classifiers (healthy, cancer or outlier). The classifiers were then imported into GTxEyes and displayed as false color pixel on an augmented reality display of the sampling field, in a similar manner to another application that maps doses of radiation therapy on endoscopic video.25 In this experimental run, no outlier (unclassifiable) data was obtained and spatially encoded PIRL-MS classifiers changed identity from ‘healthy’ to ‘cancer’ as the cancer and healthy tissue interface (or border) was crossed. The movement of the laser tip itself is also tracked and displayed for clarity. In GTxEyes display window25 the size of the false color pixel can be adjusted to optimize visualization, and thus only its center point should be taken to evaluate concordance if needed.
Fig. 2A provides a snapshot of changing spatially encoded PIRL-MS pathology classifications from the end of ESI Video 1.† The results provide a static snapshot of how spatially encoded mass spectrometry classifiers change identity as the boundary between two homogeneous tissue types is crossed. As the platform requires accumulation of signal from 5–10 seconds of mass spectral averaging for PCA-LDA classification, to offer the most stringent spatial resolution for tumor bed assessment looking for presence of cancer, it must be used in a point-sampling mode. The practical spatial resolution of the current probe including hand jitter is ∼1 mm2 (0.425 mm for the beam from the fiber optic). To examine the presence of cancer across a boundary, a series of strategic ∼1 mm2 point-sampling events across the surface of the tissue must be taken in a manner analogous to the current pathology-based workflow where quick staining of specimens picked from a tumor bed is performed and the results are communicated back to the neurosurgeon.
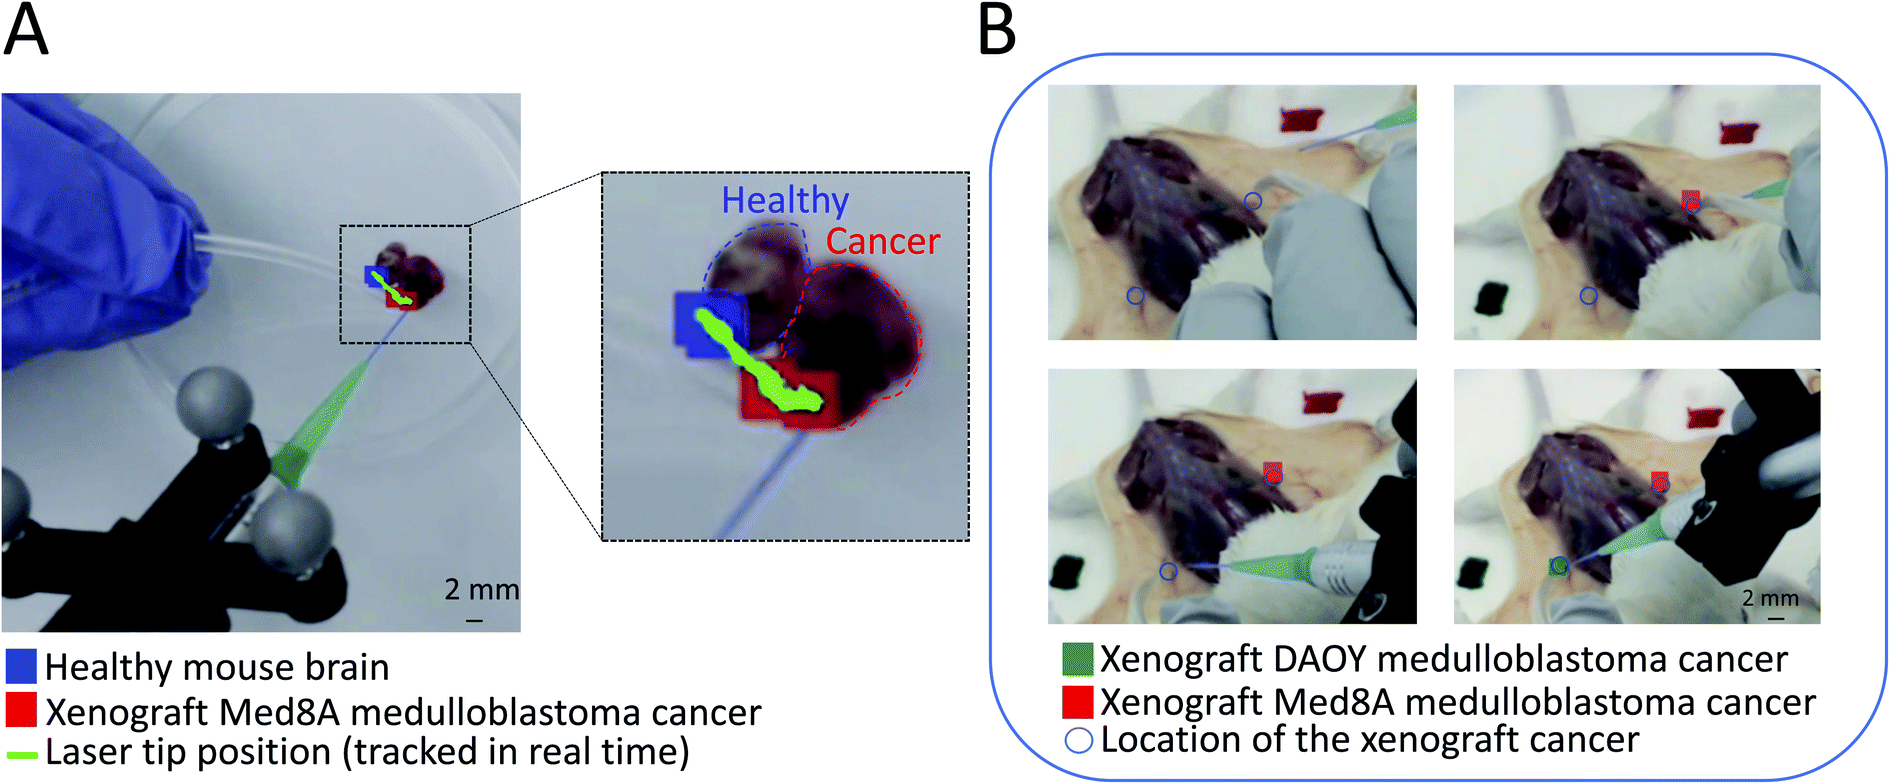 | ||
| Fig. 2 Spatially encoded PIRL-MS sampling of cancer for in situ pathology determinations with real-time display of results. An augmented reality display of false colored tissue pathology classifiers from PCA-LDA modeling of mass spectrometry readout (PIRL-MS) is presented where each classification (i.e. pathology assessment) is color coded at the point of sampling (laser tip) on a camera feed of the sampling field of view. This figure provides example results for both cancer border assessment applications (using ex vivo tissue) as in (A) and for in situ pathology (using sacrificed tumor bearing mice) as in (B). (A) An artificial tissue boundary for the assessment of spatially encoded PIRL-MS results is created by placing a murine xenograft medulloblastoma tumor piece adjacent to a normal mouse brain tissue piece. The PIRL-MS probe was scanned over, and crossed the tissue border at a continuous pace (green trace) where at every 5 seconds classification of the averaged data against a two-component (healthy mouse brain and Med8A cancer) PCA-LDA model using previous data18,19 was made. This classification is displayed at the spatially encoded position that concludes the 5 second sampling period and changes from healthy to cancer as the boundary is crossed. The real-time video that shows the continuous scan and augmented reality display of the classifications as they are made available real-time is provided as a ESI.† (B) Validation of in situ pathology application using tumor bearing mice (summarized in Table 1). Here, subcutaneous bilateral injections of cells for Med8A and DAOY subgroups of medulloblastoma resulted in small 1 mm3 and ∼3.3 mm3 tumors highlighted by circles to guide readers to their locations. These subgroups, previously shown to be classifiable with PIRL-MS,19 were subjected to spatially encoded PIRL-MS classifications using a 3-component DAOY, Med8A19 and muscle tissue signatures. The expected false colored spatially encoded classifications for these small tumors at the site of sampling (laser tip) resulted. A similar validation approach was taken to evaluate the performance over other cancer types summarized in Table 1 where good metrics have been reported. | ||
Fig. 2B shows a snapshot of in situ sampling of a Med8A and DAOY medulloblastoma tumor bearing mouse in combination with a 3-component PCA-LDA statistical model that separates these cancer types from muscle (summarized in Table 1), where both DAOY and Med8A classifications were performed and displayed on site through GTxEyes and AMX coupling. Mice were sacrificed prior to this analysis, hence in situ as opposed to in vivo sampling. For these validations, we averaged 10 seconds of PIRL-MS spectra at each sampled point. Overall, out of the 75 performed spatially encoded PIRL-MS sampling events across 6 different tissue types (5 cancer types plus muscle as detailed in the methods section), 63 correct classifications were achieved, corresponding to a success rate of 84%. As shown in Table 1, Med8A medulloblastoma in the context of the chosen Med8A, DAOY and muscle PCA-LDA model was particularly underperforming where only 5 out of the 12 sampling attempts resulted in correct classification (a 41% success rate). Previous PIRL-MS investigation of Med8A and DAOY tumors suggests that Med8A produces higher PIRL-MS signal compared to DAOY.19 Muscle tissue produces good PIRL-MS signal comparable to Med8A tumors. While low PIRL-MS signal does not preclude reliable analysis due to normalization of spectra to overall signal intensity in PCA-LDA assessments,3 in a 3-component model where only one component (i.e. DAOY) possesses a low signal-to-noise ratio, misclassification of Med8A sampling events as DAOY in case of samples with poor quality signal may be expected. This highlights a potential limitation of the spatially encoded mass spectrometry concept as its output is highly dependent on correct classifiers from the preceding multivariate analysis step. Fig. S1† shows the PIRL-MS spectra of DAOY/Med8A/muscle tissue used for modeling acquired both in situ and ex vivo. The DAOY and Med8A spectra from ex vivo tissue are published previously18 but are reproduced here for the clarity of the discussion. As can be seen in this figure, the PIRL-MS spectra of ex vivo and in situ tissue for each tissue type are fairly similar. In this study, the PCA-LDA model was established using harvested xenografts split in half to expose water rich cores that are amenable to producing classifiable PIRL-MS signal. The in situ sampling, however, was performed on the accessible surface of the tumor after surgically exposing the skin at the site of cancer growth. This resulted in some of our Med8A sampling events possessing low signal intensity (10 fold lower) compared to those obtained previously from ex vivo sampling,19 used in the statistical model. In combination with a higher degree of molecular similarity between Med8A and DAOY, misclassification of poor quality Med8A data points as DAOY due to signal-to- noise disparity between model and query may be expected. Here, exclusion of Med8A data points on this ground from the assessment results in 63 classification attempts where 58 correct classifications were resulted, producing a 92% success rate in correct prediction of tissue pathology across normal tissue, brain, breast and head & neck cancers. As the success of the spatially encoded measurements in situ depends on successful MS modeling of the ex vivo tissue data, in Fig. S2† we have shown the PCA-LDA models used for Table 1 predictions. We have also included the loading plots for each of the said models. Table S1† further reports each model's robustness through a 20% leave out test wherein we have summarized the confusion matrices for each of the ex vivo tissue models used (see Table 1). As can be seen here, all models were highly robust, which contributed to the success of the in situ tissue classifications reported in Table 1. As mentioned above, a failure of the model translates directly to failures of the in situ tissue classifications which is a central tenet of the spatially encoded mass spectrometry concept.
| Tissue type | Cell line | Biological replicates | Attempted classifications | Correct classifications | PCA-LDA models used |
|---|---|---|---|---|---|
| Breast cancer | LM2-4 | 3 | 9 | 8 | MDA-MB-231, LM2-4, muscle |
| Breast cancer | MDA-MB-231 | 3 | 9 | 6 | MDA-MB-231, LM2-4, muscle |
| Medulloblastoma | Med8A | 5 | 12 | 5 | Med8A, DAOY, muscle |
| Medulloblastoma | DAOY | 4 | 8 | 8 | Med8A, DAOY, muscle |
| Head & neck cancer | Cal-33 | 3 | 7 | 7 | Cal-33, muscle |
| Muscle | N/A | 14 | 30 | 29 | Models above |
| Total | 14 | 75 | 63 |
Potential for in vivo use and tissue damage upon sampling
The results above highlight the potential of spatially encoded PIRL-MS pathology results for in situ measurements displayed in augmented reality as 2D overlays. The platform was validated using ex vivo tissue (Fig. 2A, ESI Video 1†) and in situ measurements from tumor bearing sacrificed animals (Fig. 2B, Table 1). Here, the success of in situ measurements (Table 1) over a multi-cancer panel suggests that the method is not adversely affected by presence of biological fluids that have been absent in our previous ex vivo validation works.3,18,19 However, to have applicability as a cancer classification tool for future tumor bed assessment applications in vivo, it must be shown that the PIRL is minimally damaging to the healthy tissue, in particular neuronal tissue where probe-induced damage may create life-long neurologic morbidities. An area of active development is paediatric neurosurgery where recently PIRL-MS has emerged as an attractive tool to provide classification of medulloblastomas into their clinically important subgroups rapidly.3 The availability of medulloblastoma subgroup information in real-time during surgery allows rapid stratification and surgical resection risk determination, allowing surgeons to minimize neurologic morbidity in low risk patients with a known good response to adjuvant therapy.3 This study used ex vivo tumor cores where no significant damage to tissue outside the laser irradiated zone was reported.3 Previous studies have been performed that suggest PIRL causes minimal damage to the mouse skin tissue, and performs slightly better than the surgical scalpel in terms of cellular stress, wound size, scar tissue and healing.28 Favourable outcomes highlighting minimal damage to tissues in skin,29,30 bone,31,32 keratoplasty33 and soft tissue such as vocal cord34 have also been reported. Moreover, some of the previous studies referenced above 28,30,34 compared the performance of PIRL to surgical tools based on CO2 laser ablation, analogous to laser systems utilized recently in conjunction with the rapid evaporative ionization mass spectrometry (REIMS)35 platform previously coupled to electrocautery.2 This combination creates a destructive surgical scalpel with demonstrated superb performance in rapid ex vivo tissue or in vivo tumor core classifications with mass spectrometry6,8 where concerns for tissue damage are either minimal or clinically irrelevant. Capitalizing on the demonstrated 98% success rate of PIRL-MS for medulloblastoma subgroup determination using ex vivo tissue,3 a study that characterizes DNA damage, cell death, and neuronal viability upon PIRL-MS sampling of the neuronal tissue for future spatially encoded in situ brain pathology determinations is currently lacking. To bridge this gap, the exposed brain tissues of anesthetised mice (n = 9) were subjected to PIRL-MS sampling and housing for up to two weeks (two time points of 24 hours for immediate damage and two weeks for long term damage) to assess PIRL-induced damage to brain tissue using immunohistochemical staining. We first show that in vivo PIRL-MS sampling of brain tissue from these anesthetised mice after craniotomy (n = 8) results in classifiable PIRL-MS spectra (in one mouse sampling did not produce any spectrum). The recorded mass spectra could be classified correctly with a PCA-LDA model of mouse organs established from frozen tissue analyzed ex vivo19 (Fig. 3A). Complementing the in situ sampling results provided in Table 1, this observation suggests that in vivo PIRL-MS measurements are possible, and are not hampered by the presence of circulating blood in brain tissue (anesthetized mice subjected to craniotomy for brain exposure as a proxy for human brain surgery). In Fig. S3† we have shown a representative in vivo PIRL-MS spectrum of the brain tissue recorded under anesthesia compared to a mass spectrum of an ex vivo, previously frozen mouse brain specimen. In keeping with the observations made in Fig. 3A, the spectra of in vivo fresh and ex vivo frozen tissue are similar. This highlights a potential utility for PIRL-MS spectral libraries established from previously frozen ex vivo specimens for spatially encoded assessment of in vivo tissue. Surprisingly, despite visible presence of some blood and fluids at the site of craniotomy (i.e. in vivo sampling), no drastic alterations to PIRL-MS spectra were seen. While the mechanism behind PIRL-MS signal is still being investigated, in its current configuration we confirm no ionization in the positive ion mode indicative of proton transfer. While PIRL-MS classifications utilize negatively charged species, lack of further ionization (indicated by lack of positive ion signal in the current implementation) may be a helpful factor in reducing the complexity resulting in little to no interference of the blood signal.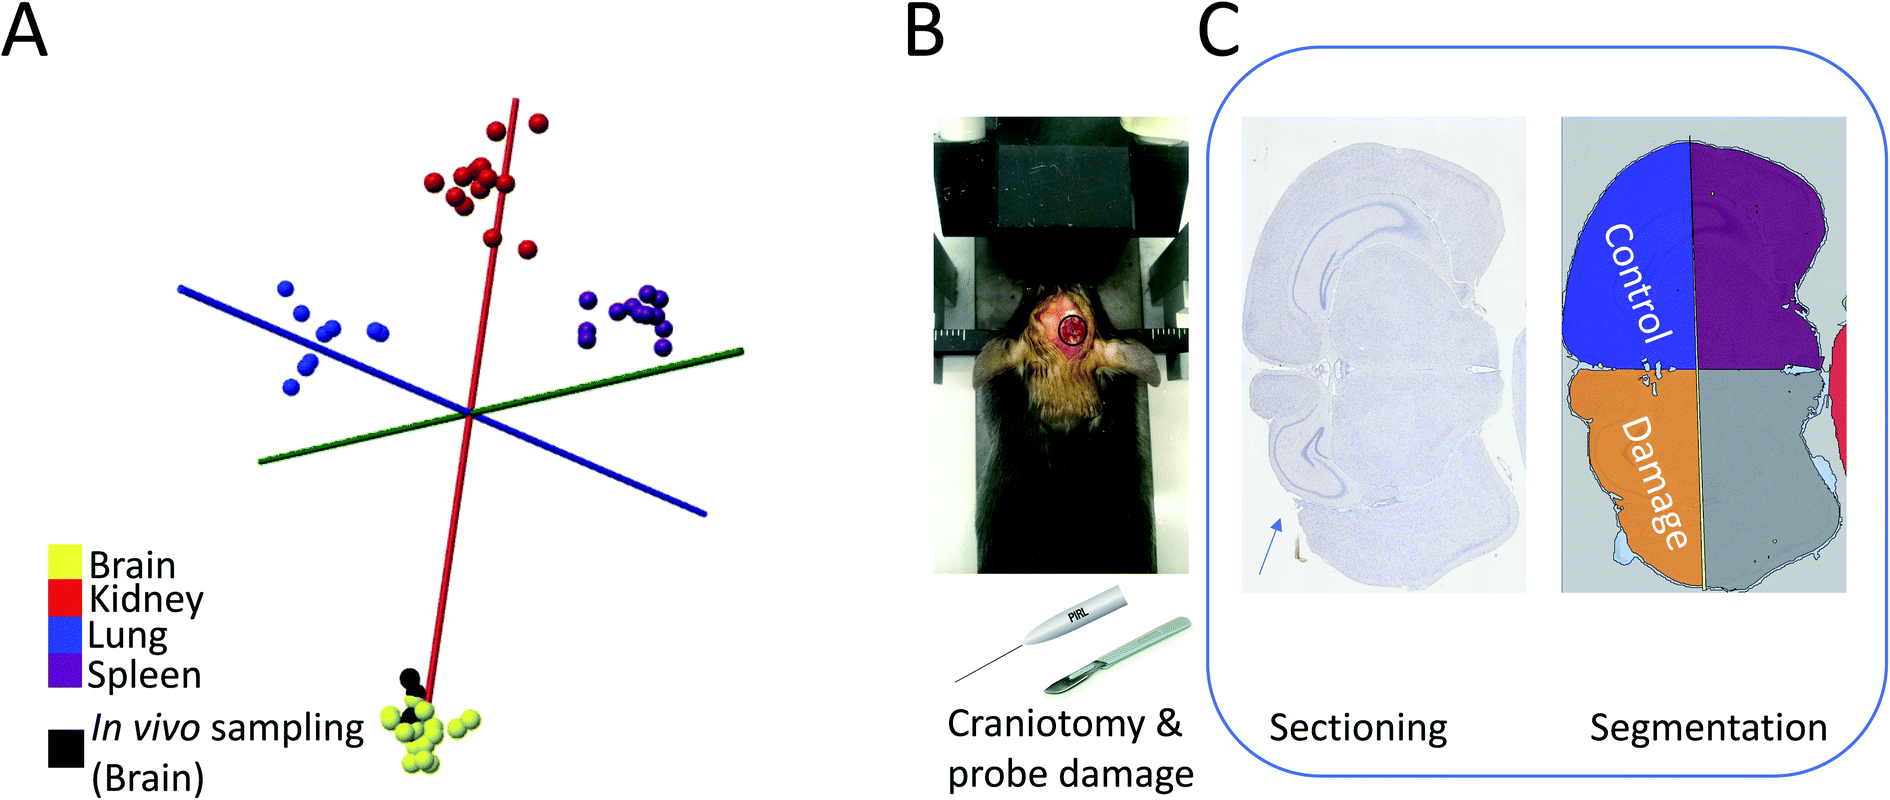 | ||
| Fig. 3 Evaluation of PIRL-MS damage to neuronal tissue using a murine model under real use scenario of producing classifiable PIRL-MS mass spectra. Craniotomy, as described in the experimental section, was performed that allowed laser probe and scalpel access to the brain tissue. Superficial ‘incisions’ with PIRL-MS, while collecting mass spectra (n = 8), and with surgical scalpel (no collection of spectra) were made under anesthesia. (A) PCA-LDA model of mouse organ data from previous results using a mixture of fresh or frozen ex vivo tissue19 where we show in vivo data points acquired from live mice under anesthesia classifying as expected with the organ type suggesting that the presence of blood or body fluids is not hindering the classification. (B) The experimental setup with mouse anesthetized and restrained in stereotactic device before localized craniotomy and application of PIRL probe or scalpel to create superficial incisions . (C) Schematics of the histological workflow for the analysis of the extent of neuronal damage. As detailed in the experimental section, digital pathology was used to quantify the extent of damage from stain positive cells using TUNEL (DNA damage), Caspase-3 (cell death) and NeuN (neuronal viability). Each tissue section at end-point was divided into 4 quadrants as shown in ‘segmentation’ panel where, through taking advantage of the biological symmetry in brain tissue, we compared the extent of probe insult at the damaged quadrant (where the laser probe or the surgical scalpel intersected with the brain matter) to the control quadrant (that did not interact with the laser or scalpel probes). Any damage in the control quadrant results from extraction of brain from the skull after sacrifice. As shown in this panel, probe insult in the damaged quadrant (marked with the arrow) is superficial and is compounded with damage caused by the craniotomy process itself. Therefore, all damage values reported and compared in a relative sense between laser and scalpel are reported as ‘probe + craniotomy’ damage. Control quadrant values are reported to illustrate sensitivity. However, PIRL-MS classifying spectra presented in panel (A) indicate that some level of neurological insult was created under the experimental conditions. | ||
We further designed the study such that the extent of neuronal tissue damage from the laser could be compared to that of the surgical scalpel by subjecting an additional cohort of mice (n = 10) to corticotomy under anesthesia by surgical scalpel. We chose to utilize a surgical scalpel since it is a widely used tool in neurosurgical applications. Mice were housed for up to two weeks (as above for the laser cohort) for the development of lesions and determination of the extent of damage and recovery (if any) using three different antibodies: TUNEL (for DNA damage),36 Caspase 3 (for cell death),37 and NeuN (for neuronal cell viability).38 To most accurately examine the extent of damage, we performed digital pathology measurements of the stained (or positive) cells and took advantage of the biological symmetry of the brain tissue to normalize the results for inevitable, inherent spatial differences in brain tissue architecture that may arise due to possible positional differences in the sampled site for each mouse (we performed a supratentorial approach to the cerebral hemisphere for the craniotomy, see Fig. 3B). For the analysis, we thus divided the brain slices into 4 quadrants, and normalized the number of stain positive cells in the quadrant where the craniotomy and laser or scalpel insult had taken place to the mirror quadrant where no craniotomy or insult had taken place. Fig. 3C provides a schematic of the study design where we have highlighted the sampling and the control quadrants.
We used stereotactic positioning systems to improve the positional accuracy of craniotomy and take, as a basis, a ‘probe + craniotomy’ damage type comparison and interpret the results between different probes using the same craniotomy method performed by the same individual on the same mouse strain using the same tools as described in the experimental section. Here, it must be emphasized that even if we are unable to confidently attribute the measured damage values to those caused solely by each probe's interaction with the brain matter, we confirm that PIRL-MS sampling has been performed correctly as classifiable PIRL-MS spectra is resulted (see Fig. 3A). Therefore, neuronal damage from PIRL-MS measurements must be present in the analyzed specimens. Our results suggest that spatially encoded PIRL-MS pathology is unlikely to result in long lasting damage, as no mice exhibited neurologic and behavioural abnormality through daily monitoring during recovery for two weeks (two mice out of six in the 24 hour cohort did not survive overnight after ‘craniotomy + laser’ insult). This is in keeping with the previous post PIRL-MS histopathology analyses of human brain tumors that suggests little to no damage outside the laser sampled zone.3
To add more precision to the qualitative argument above regarding the suitability of PIRL-MS as an in vivo sampling tool, Fig. 4 shows the detailed digital pathology results quantifying the ‘probe + craniotomy’ damage to mouse brain tissue from immunohistological analysis. TUNEL staining reports a significant neurologic insult (DNA damage) compared to control quadrant (see Fig. 3C) at 24 hours after the sampling that largely recovers after two weeks. To examine whether PIRL sampling was inferior to routinely used surgical scalpel in terms of tissue damage, we subjected the ‘laser + craniotomy’ and ‘scalpel + craniotomy’ stain data for both short (24 hour) and long term (two-week) time points to a two-sample t-test (a = 0.05). Here, the t-test suggested only a statistically significant (p = 0.035) decrease in the TUNEL staining for the long term (two week) cohort, suggesting slightly improved healing after laser sampling. No statistically significant difference between other data groups was seen. Our test results thus suggest that PIRL-MS sampling under conditions that can produce classifiable mass spectra (Fig. 3A) is non-inferior to the surgical scalpel in terms of the damage to neuronal tissue. In keeping with these results, from the same t-test analysis mentioned above, neuronal viability (NeuN stain) in both short and long term time points was also not differentially affected between PIRL-MS and scalpel cohorts further confirming non-inferiority in terms of neuronal viability after sampling. In a similar vein, no statistically significant differences between ‘laser + craniotomy’ and ‘scalpel + craniotomy’ damage in terms of cell death (Caspase 3 stain) over short term (24 hour) time point was seen from the two-sample t-test. Therefore, all tests unequivocally demonstrate that PIRL-MS sampling is non-inferior compared to surgical scalpel in terms of neuronal tissue damage.
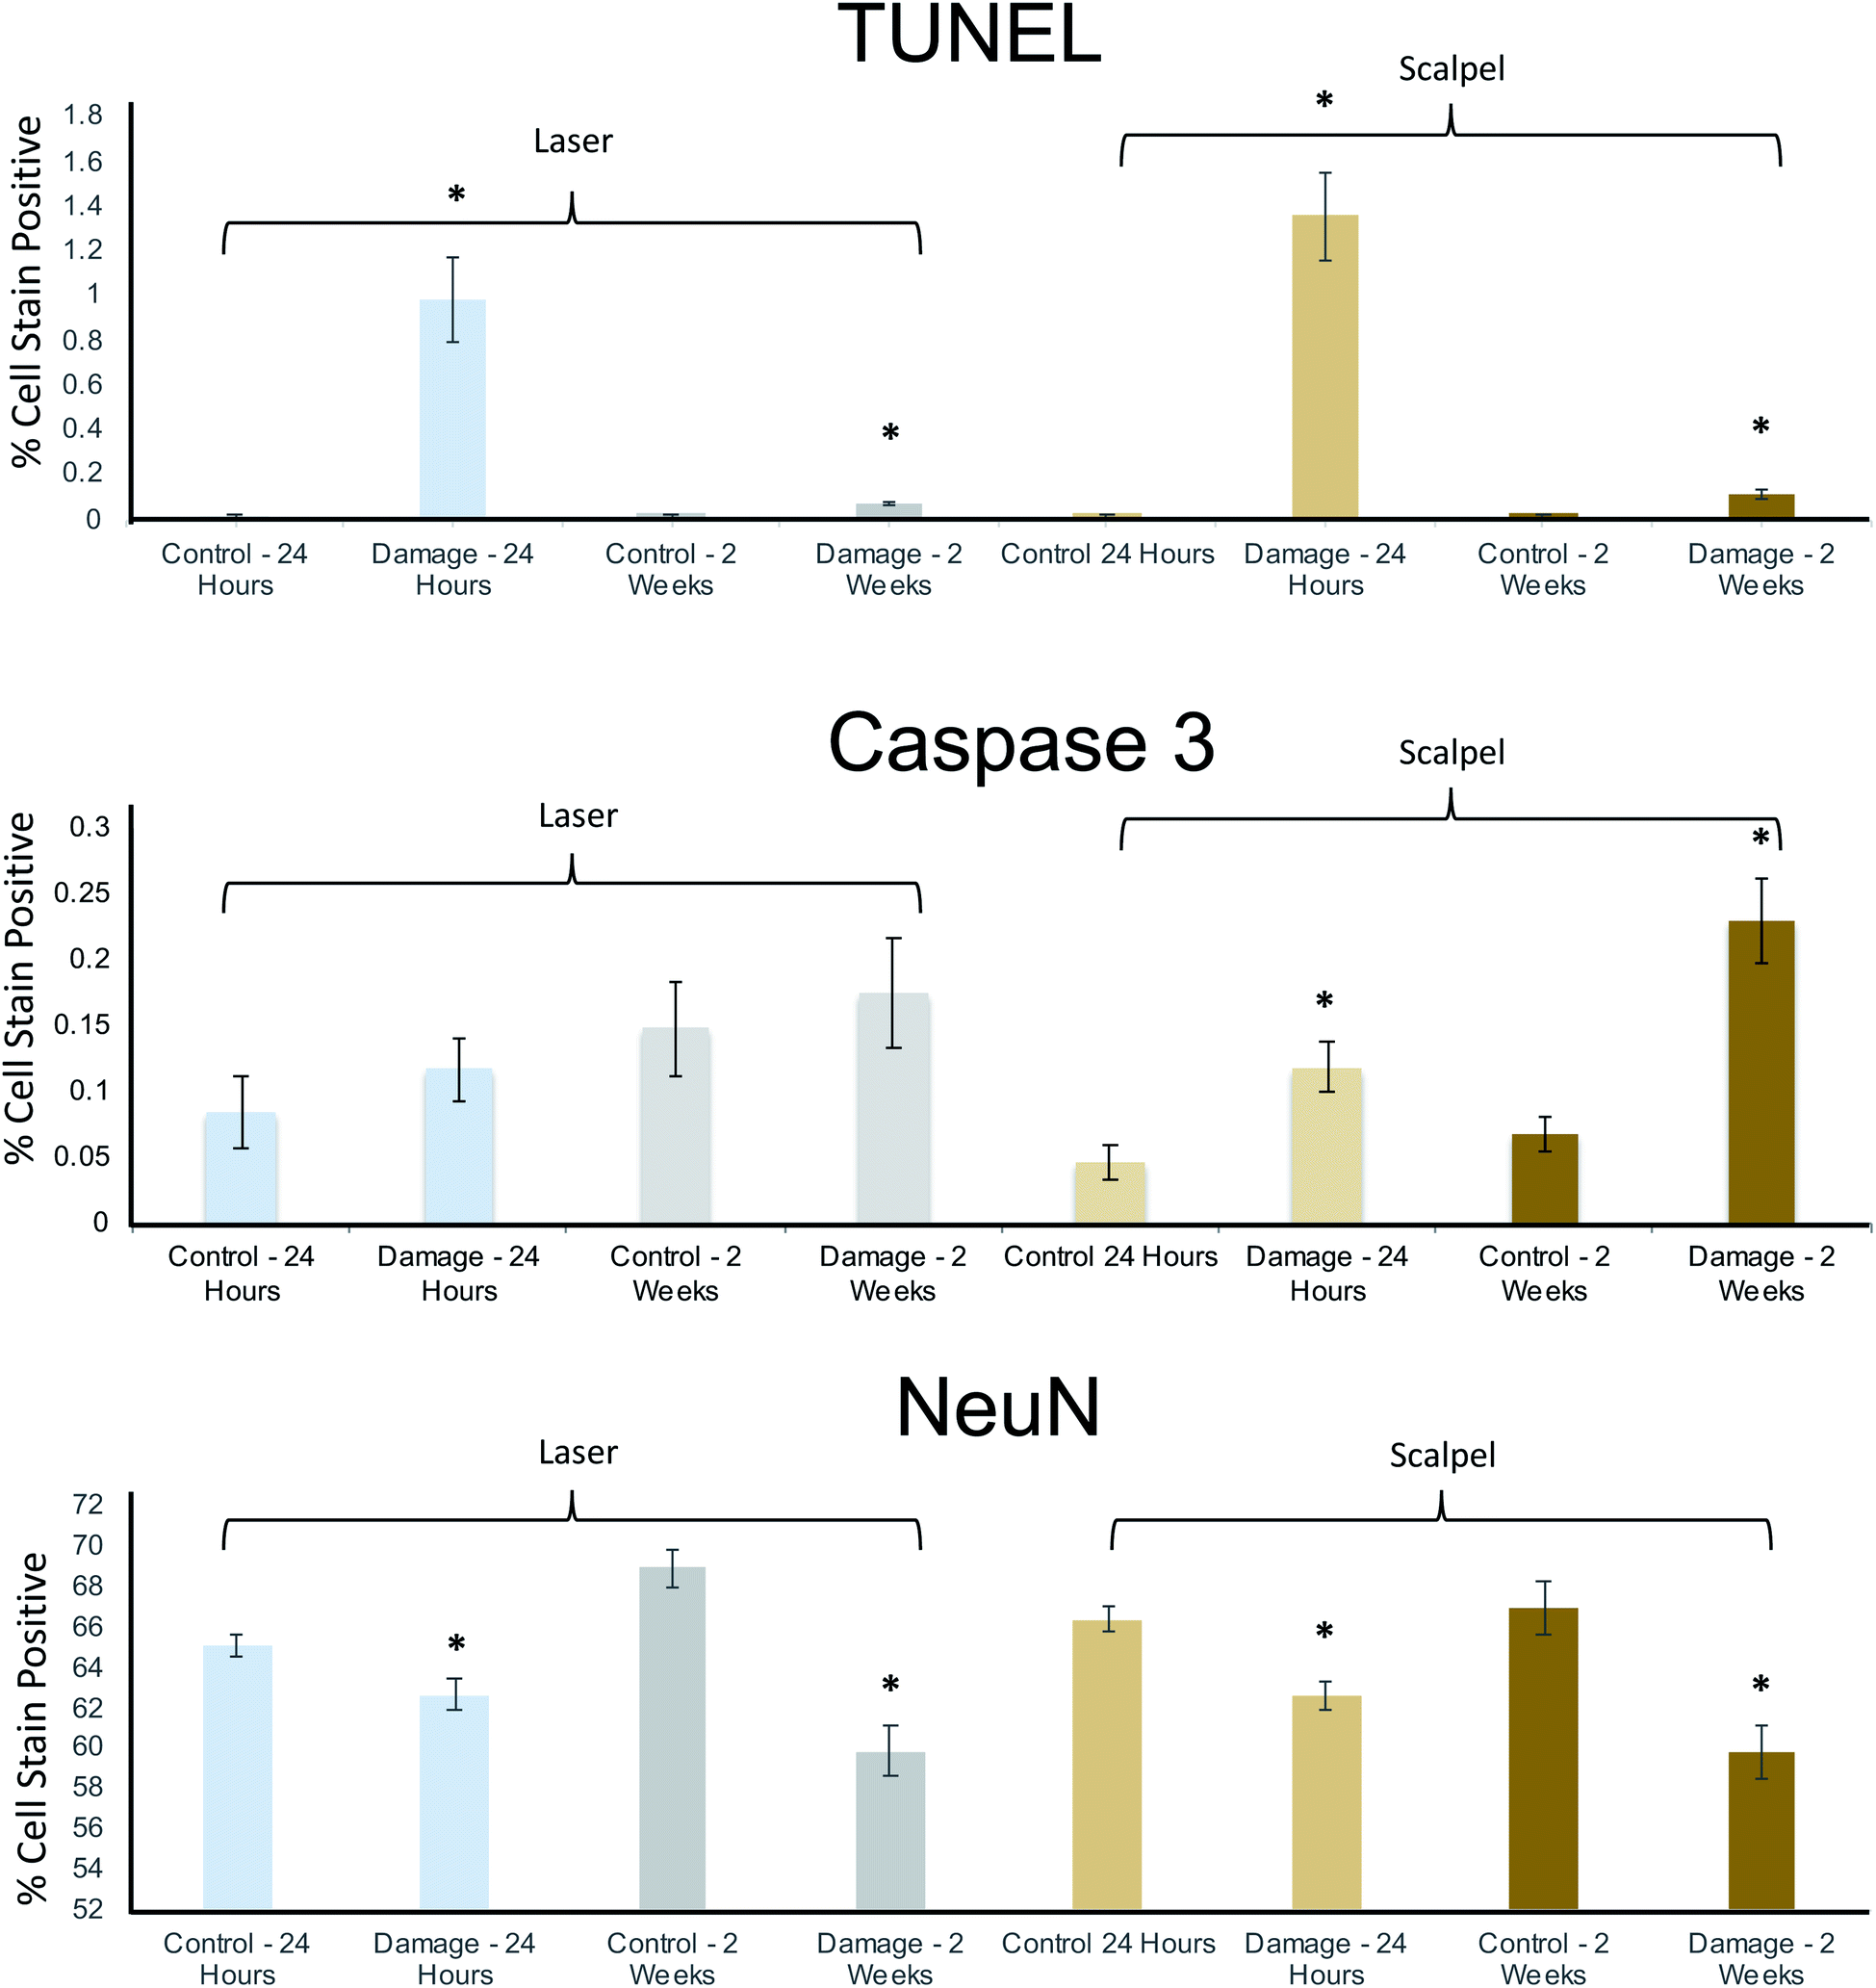 | ||
| Fig. 4 Histopathological analysis of laser-induced damage to neuronal tissue in a mouse model suggests non-inferiority of PIRL compared to surgical scalpel. As detailed in the main text, DNA damage (TUNEL stain), cell death (Caspase 3 stain) and neuronal viability (NeuN stain) were evaluated using 76 histological slides from 19 mice (n = 9 for laser and n = 10 for scalpel) using digital pathology methods that quantify number of stain positive cells. Two endpoints of 24 hours (to quantify immediate neurologic insult) and two weeks (to quantify long term damage) were taken. Control measurements in each bar graph refer to measurements of stain positive cells from the control quadrant per schematics shown in Fig. 3C. Error bars represent standard error of the mean. Even in cases where no drastic differences between control and experimental measurements are seen, the visual inspection of the histopathologic slides suggests removal of some material in the damaged quadrant (see Fig. 3C). With the caveat that ‘missing’ material could contain some of the damaged cells that then do not appear in the analysis, introducing a bias, we confirm mice survived PIRL-MS sampling. Asterisks show statistically significant measurements in each cohort compared to its control. With the exception of Caspase 3 stain statistically significant differences between control and experimental measurements were seen in other cases. The extent of the damage, however, was not different between laser and scalpel suggesting non-inferiority. This observation held true over the three stains. The onset of immediate DNA damage (TUNEL stain) insult seen with the laser and scalpel (that largely recovered over two weeks), is likely due to the invasiveness of the craniotomy process itself (Fig. S4†). To compare laser and scalpel damage two-sample t-tests (assuming unequal variance, a = 0.05) were conducted for the laser and scalpel damaged regions at 24 hours and 2 weeks. There was a statistically significant decrease in TUNEL staining in the 2 week laser-damaged group relative to the 2 week scalpel-damaged group (p = 0.035). In all other cases, differences were not statistically significant. Therefore, our tests suggest non-inferior performance for PIRL-MS sampling in terms of neuronal tissue damage compared to the surgical scalpel. | ||
The observations described above held true over 19 independent mice and 76 tissue slices (4 slices from the damaged site per brain per stain) subjected to three different immunohistochemical assessments of common types of neuronal tissue damage, suggesting that PIRL-MS is non-inferior compared to the surgical scalpel in terms of damage to brain matter under real use sampling conditions. Therefore, spatially encoded PIRL-MS has a potential for in vivo measurements without concern for imparting drastic damage to normal brain tissue beyond what may occur (and is largely clinically acceptable) during the use of the surgical scalpels. However, it is important to note that in this study design, it is not warranted to distinguish between the probe (laser or scalpel) insult and the damage induced by the craniotomy process itself. We have, however, performed craniotomy alone control experiments evaluated using the same three stains (n = 10 mice; and same number of histological slides as above) to quantify the extent of neurologic insult solely from craniotomy. In Fig. S4† we have shown the ratio of positively stained cells of ‘damage’ to ‘control’ regions (see Fig. 3C) for craniotomy only (no laser or scalpel interactions) experiments. Following the same analysis above, the craniotomy process itself does not drastically damage the brain matter compared to control quadrants except for immediate (24 hour) insult in terms of DNA damage (TUNEL stain). Therefore, we suspect that the damage reported in Fig. 4 for TUNEL stain to be largely due to the neurologic insult produced by the craniotomy process itself. The same argument can be made for Caspase 3 and NeuN reporters in keeping with the previous findings that PIRL is not drastically damaging to the biological tissues.3,28,29,31,33,34 Thus, as expected, neither scalpel nor PIRL probe (under real use scenario of producing classifiable spectra as in Fig. 3A) are shown to drastically damage the brain matter further beyond what is caused by the craniotomy itself.
Caveats and future directions
In this study, spatially encoded PIRL-MS results are validated for use in neurosurgical applications where no appreciable increase in damage to neuronal tissue is detected compared to surgical scalpel. The platform for spatially encoded mass spectrometry developed, demonstrated and validated herein using PIRL-MS can be adapted for use in conjunction with other hand-held mass spectrometry probes such as the iKnife2 and its laser based iterations,35 the MasSpec Pen1 and SpiderMass.4 These probes offer a spectrum of spatial resolution, degree of damage to tissue and can modify performance metrics reported here for spatially encoded PIRL-MS in terms of classification success rate as well as effective pixel error.While in our evaluation we assumed little-to-no tissue movement during PIRL-MS sampling, continuous registration/co-registration methods exist to account for the effects of motion as the mass spectrometry sampling proceeds.39–42 These include application of surface and deformable registration methods from output of stereo camera or depth camera setups to surface models generated from MR or CT. The utilization of continuous registration, however, is expected to result in larger error values compared to what has been demonstrated here, factored by the depth resolution and surface reconstruction accuracy from the camera setups and surface registration errors. In addition, it must be noted that the acceptable tolerance in cancer border assessment may vary from one neurosurgical application to another. For example, the current implementation may have a more immediate utility in applications where tissue movements is restrained. It goes without saying that strategies to mitigate tissue movement's impact on spatially encoded mass spectrometry results must be employed prior to clinical deployment. Here, utilization of electromagnetic tracking coupled with feature-based deformable registration synchronized with tissue movement (such as pulse or respiratory motions), used in imaging,43 as a form of image stabilization may constitute attractive avenues to address this important point. Nevertheless, the low millimeter accuracy of the spatially encoded mass spectrometry method demonstrated in this study is a key attribute that can lead to a reduction in resection induced neurologic morbidity for tumors situated in close proximity to critical nervous system structures.
This study further assumes that molecular transition from cancer to healthy tissue is ‘sharp’, and does not involve gradual changes in molecular content reminiscent of a population weighted averaging expected in mass spectrometry signal of mixed samples. While the assumption above holds true in case of a number of solid tumors known to be present in the central nervous systems (CNS), artificial intelligence and machine learning methods44,45 can be coupled to MS recognition and modeling step(s) to increase performance at highly infiltrating CNS tumor margins where population weighted mass spectra based on the degree of infiltration (i.e. percent cancer cells versus healthy cells in the pixel(s) examined) comprise the signals. Contrary to our assumption, many types of brain cancers are highly infiltrative. Molecular modelling can be performed to contain dedicated ‘infiltrative’ class, or many thereof based on the degree of infiltration as opposed to the simple two-state healthy-cancer model utilized in our proof of principle demonstrations of the spatially encoded mass spectrometry concept in this work. This limitation relates more to MS classification in case of population averaging of the observables rather than the registration aspects demonstrated herein, but nevertheless, may impact the success of the proposed spatially encoded mass spectrometry concept. Furthermore, all MS classification methods that use metabolites as observables of the analysis stipulate metabolic homogeneity on the length scale of the regions examined. This assumption needs further independent validation especially in cases where presence of cancer could result in swelling of the brain and edema where metabolic heterogeneity in morphometrically identical tissue regions may be resulted. Lastly, the performance of our proposed label-free spatially encoded mass spectrometry pathology platform should be compared to competing methodologies, such as other image based optical or fluorescence-based methods,46 and eventually scored against surgical outcomes to evaluate reduced neurologic morbidity, low local failure rate (recurrence) and/or improved outcomes. It will be of special interest to evaluate the method in its true 3D sampling capacity as opposed to augmented reality display of its 2D projections as is done here in this first step.
Author contributions
Designed research: DAJ, AZ-A, JQ, RW, M. Woolman, CMKF, I. Ferry.Performed research: JQ, MW, DD, FD, CMKF, I. Ferry.
Created and provided reagents: M. Wu, MV, NB, HC, I. Fricke.
Analyzed results: AZ-A, M. Woolman, JQ, FD, DD, LK, MZ.
Provided supervisory and support: AZ-A, JI, BGW, SD, HJG, JTR.
Wrote the manuscript: AZ-A, M. Woolman, CMKF.
Ethical statement
This study was performed under animal use protocol 4135 which was approved by the Princess Margaret Hospital Animal Care Committee, University Health Network. All animal work was carried out as per the requirements of the Policies and Guidelines of The Canadian Council on Animal Care, Requirements of the Animals for Research Act and Institutional policies which includes a focus on 3Rs and Humane Use of Animals in Biomedical research.Conflicts of interest
There are no conflicts to declare.Acknowledgements
This work was financially supported by the Natural Sciences and Engineering Research Council of Canada (NSERC, RGPIN-2018-04611), Princess Margaret Hospital TECHNA Funds (Toronto, Canada), St. Michael's Hospital (Toronto, Canada). We acknowledge support from Michael D. Taylor (Hospital for Sick Children), and thank STTARR Innovation Centre (http://www.sttarr.com) and its affiliated funders and Waters Corporation (Milford, MA, USA) for technical advice. We are grateful to Stacey Krumholtz (Hospital for Sick Children) for assistance in preparation of illustrations for this manuscript.References
- J. Zhang, et al., Nondestructive tissue analysis for ex vivo and in vivo cancer diagnosis using a handheld mass spectrometry system, Sci. Transl. Med., 2017, 9, eaan3968, DOI:10.1126/scitranslmed.aan3968.
- J. Balog, et al., Intraoperative tissue identification using rapid evaporative ionization mass spectrometry, Sci. Transl. Med., 2013, 5, 194ra193, DOI:10.1126/scitranslmed.3005623.
- M. Woolman, et al., Picosecond Infrared Laser Desorption Mass Spectrometry Identifies Medulloblastoma Subgroups on Intrasurgical Timescales, Cancer Res., 2019, 79, 2426–2434, DOI:10.1158/0008-5472.CAN-18-3411.
- P. Saudemont, et al., Real-Time Molecular Diagnosis of Tumors Using Water-Assisted Laser Desorption/Ionization Mass Spectrometry Technology, Cancer Cell, 2018, 34, 840–851, DOI:10.1016/j.ccell.2018.09.009.
- K. C. Schafer, et al., Real time analysis of brain tissue by direct combination of ultrasonic surgical aspiration and sonic spray mass spectrometry, Anal. Chem., 2011, 83, 7729–7735, DOI:10.1021/ac201251s.
- Z. Takats, N. Strittmatter and J. S. McKenzie, Ambient Mass Spectrometry in Cancer Research, Adv. Cancer Res., 2017, 134, 231–256, DOI:10.1016/bs.acr.2016.11.011.
- D. R. Ifa and L. S. Eberlin, Ambient Ionization Mass Spectrometry for Cancer Diagnosis and Surgical Margin Evaluation, Clin. Chem., 2016, 62, 111–123, DOI:10.1373/clinchem.2014.237172.
- C. L. Feider, A. Krieger, R. J. DeHoog and L. S. Eberlin, Ambient Ionization Mass Spectrometry: Recent Developments and Applications, Anal. Chem., 2019, 91, 4266–4290, DOI:10.1021/acs.analchem.9b00807.
- K. C. Sachfer, et al., In situ, real-time identification of biological tissues by ultraviolet and infrared laser desorption ionization mass spectrometry, Anal. Chem., 2011, 83, 1632–1640, DOI:10.1021/ac102613m.
- L. S. Eberlin, et al., Molecular assessment of surgical-resection margins of gastric cancer by mass-spectrometric imaging, Proc. Natl. Acad. Sci. U. S. A., 2014, 111, 2436–2441, DOI:10.1073/pnas.1400274111.
- Z. Bodai, et al., Effect of Electrode Geometry on the Classification Performance of Rapid Evaporative Ionization Mass Spectrometric (REIMS) Bacterial Identification, J. Am. Soc. Mass Spectrom., 2018, 29, 26–33, DOI:10.1007/s13361-017-1818-5.
- B. Fatou, et al., In vivo Real-Time Mass Spectrometry for Guided Surgery Application, Sci. Rep., 2016, 6, 25919, DOI:10.1038/srep25919.
- J. Bilkey, et al., Variations in the Abundance of Lipid Biomarker Ions in Mass Spectrometry Images Correlate to Tissue Density, Anal. Chem., 2016, 88, 12099–12107, DOI:10.1021/acs.analchem.6b02767.
- R. Elfring, M. de la Fuente and K. Radermacher, Assessment of optical localizer accuracy for computer aided surgery systems, Comput. Aided Surg., 2010, 15, 1–12, DOI:10.3109/10929081003647239.
- A. D. Wiles, D. G. Thompson and D. D. Frantz, Accuracy assessment and interpretation for optical tracking systems, Proc. Soc. Photo-Opt. Instrum. Eng., 2004, 5367, 421–432, DOI:10.1117/12.536128.
- S. Santagata, et al., Intraoperative mass spectrometry mapping of an onco-metabolite to guide brain tumor surgery, Proc. Natl. Acad. Sci. U. S. A., 2014, 111, 11121–11126, DOI:10.1073/pnas.1404724111.
- D. Calligaris, et al., Mass spectrometry imaging as a tool for surgical decision-making, J. Mass Spectrom., 2013, 48, 1178–1187, DOI:10.1002/jms.3295.
- M. Woolman, et al., Rapid determination of medulloblastoma subgroup affiliation with mass spectrometry using a handheld picosecond infrared laser desorption probe, Chem. Sci., 2017, 8, 6508–6519, 10.1039/c7sc01974b.
- M. Woolman, et al., Optimized Mass Spectrometry Analysis Workflow with Polarimetric Guidance for ex vivo and in situ Sampling of Biological Tissues, Sci. Rep., 2017, 7, 468, DOI:10.1038/s41598-017-00272-y.
- M. Daly, et al., Fusion of intraoperative cone-beam CT and endoscopic video for image-guided procedures, Proc. SPIE, 2010, 7625 DOI:10.1117/12.844212.
- A. Sternheim, et al., Cone-Beam Computed Tomography-Guided Navigation in Complex Osteotomies Improves Accuracy at All Competence Levels: A Study Assessing Accuracy and Reproducibility of Joint-Sparing Bone Cuts, J. Bone Jt. Surg., Am. Vol., 2018, 100, e67, DOI:10.2106/JBJS.16.01304.
- R. A. Weersink, et al., Improving superficial target delineation in radiation therapy with endoscopic tracking and registration, Med. Phys., 2011, 38, 6458–6468, DOI:10.1118/1.3658569.
- J. Tokuda, et al., OpenIGTLink: an open network protocol for image-guided therapy environment, Int. J. Med. Robot, 2009, 5, 423–434, DOI:10.1002/rcs.274.
- E. Chamma, et al., Optically-tracked handheld fluorescence imaging platform for monitoring skin response in the management of soft tissue sarcoma, J. Biomed. Opt., 2015, 20, 076011, DOI:10.1117/1.JBO.20.7.076011.
- J. Qiu, et al., Displaying 3D radiation dose on endoscopic video for therapeutic assessment and surgical guidance, Phys. Med. Biol., 2012, 57, 6601–6614, DOI:10.1088/0031-9155/57/20/6601.
- T. Anayama, et al., Localization of Pulmonary Nodules Using Navigation Bronchoscope and a Near-Infrared Fluorescence Thoracoscope, Ann. Thorac. Surg., 2015, 99, 224–230, DOI:10.1016/j.athoracsur.2014.07.050.
- A. Sternheim, et al., Navigated pelvic osteotomy and tumor resection: a study assessing the accuracy and reproducibility of resection planes in Sawbones and cadavers, J. Bone Jt. Surg., Am. Vol., 2015, 97, 40–46, DOI:10.2106/JBJS.N.00276.
- S. Amini-Nik, et al., Ultrafast mid-IR laser scalpel: protein signals of the fundamental limits to minimally invasive surgery, PLoS One, 2010, 5, e13053, DOI:10.1371/journal.pone.0013053.
- N. Jowett, et al., Heat generation during ablation of porcine skin with erbium:YAG laser vs. a novel picosecond infrared laser, Otolaryngol.--Head Neck Surg., 2013, 139, 828–833, DOI:10.1001/jamaoto.2013.3974.
- H. Petersen, et al., Comparative study of wound healing in rat skin following incision with a novel picosecond infrared laser (PIRL) and different surgical modalities, Lasers Surg. Med., 2016, 48, 385–391, DOI:10.1002/lsm.22498.
- N. Jowett, et al., Bone ablation without thermal or acoustic mechanical injury via a novel picosecond infrared laser (PIRL), Otolaryngol.--Head Neck Surg., 2014, 150, 385–393, DOI:10.1177/0194599813517213.
- H. Petersen, et al., Picosecond Infrared Laser (PIRL) Application in Stapes Surgery-First Experience in Human Temporal Bones, Otol. Neurotol., 2018, 39, e224–e230, DOI:10.1097/MAO.0000000000001753.
- S. J. Linke, et al., Perspectives of laser-assisted keratoplasty: current overview and first preliminary results with the picosecond infrared laser (lambda = 3 microm), Ophthalmologe, 2014, 111, 523–530, DOI:10.1007/s00347-013-2995-7.
- M. Hess, et al., Picosecond infrared laser (PIRL): an ideal phonomicrosurgical laser?, Arch. Oto-Rhino-Laryngol., 2013, 270, 2927–2937, DOI:10.1007/s00405-013-2561-6.
- M. Genangeli, R. M. A. Heeren and T. Porta Siegel, Tissue classification by rapid evaporative ionization mass spectrometry (REIMS): comparison between a diathermic knife and CO2 laser sampling on classification performance, Anal. Bioanal. Chem., 2019, 411, 7943–7955, DOI:10.1007/s00216-019-02148-8.
- C. de Torres, F. Munell, I. Ferrer, J. Reventos and A. Macaya, Identification of necrotic cell death by the TUNEL assay in the hypoxic-ischemic neonatal rat brain, Neurosci. Lett., 1997, 230, 1–4, DOI:10.1016/s0304-3940(97)00445-x.
- M. Vakkala, P. Paakko and Y. Soini, Expression of caspases 3, 6 and 8 is increased in parallel with apoptosis and histological aggressiveness of the breast lesion, Br. J. Cancer, 1999, 81, 592–599, DOI:10.1038/sj.bjc.6690735.
- X. Wang, S. S. Tay and Y. K. Ng, An immunohistochemical study of neuronal and glial cell reactions in retinae of rats with experimental glaucoma, Exp. Brain Res., 2000, 132, 476–484, DOI:10.1007/s002210000360.
- D. Aiger, N. Mitra and D. Cohen-Or, 4-Points Congruent Sets for Robust Pairwise Surface Registration, ACM Trans. Graph., 2008, 27, 85 CrossRef.
- N. Mellado, D. Aiger and N. Mitra, Super 4PCS: Fast Global Pointcloud Registration via Smart Indexing, Comput. Graph. Forum, 2014, 33, 205–215 CrossRef.
- X. Fan, S. Ji, A. Hartov, D. W. Roberts and K. D. Paulsen, Stereovision to MR image registration for cortical surface displacement mapping to enhance image-guided neurosurgery, Med. Phys., 2014, 41, 102302, DOI:10.1118/1.4894705.
- Y. Fan, X. Yao, T. Hu and X. Xu, An Automatic Spatial Registration Method for Image-Guided Neurosurgery System, J. Craniofac. Surg., 2019, 30, e344–e350, DOI:10.1097/SCS.0000000000005330.
- I. Y. Ha, M. Wilms, H. Handels and M. P. Heinrich, Model-Based Sparse-to-Dense Image Registration for Realtime Respiratory Motion Estimation in Image-Guided Interventions, IEEE Trans. Biomed. Eng., 2019, 66, 302–310, DOI:10.1109/TBME.2018.2837387.
- N. Verbeeck, R. M. Caprioli and R. Van de Plas, Unsupervised machine learning for exploratory data analysis in imaging mass spectrometry, Mass Spectrom. Rev., 2020, 39, 245–291, DOI:10.1002/mas.21602.
- Z. Zhou and R. N. Zare, Personal Information from Latent Fingerprints Using Desorption Electrospray Ionization Mass Spectrometry and Machine Learning, Anal. Chem., 2017, 89, 1369–1372, DOI:10.1021/acs.analchem.6b04498.
- N. E. Wojtynek and A. M. Mohs, Image-guided tumor surgery: The emerging role of nanotechnology, Wiley Interdiscip. Rev.: Nanomed. Nanobiotechnol., 2020, e1624, DOI:10.1002/wnan.1624.
- M. Woolman and A. Zarrine-Afsar, Platforms for rapid cancer characterization by ambient mass spectrometry: advancements, challenges and opportunities for improvement towards intrasurgical use, Analyst, 2018, 143, 2717–2722, 10.1039/c8an00310f.
Footnotes |
| † Electronic supplementary information (ESI) available. See DOI: 10.1039/d0sc02241a |
| ‡ These authors contributed equally to this work. |
| This journal is © The Royal Society of Chemistry 2020 |