DOI:
10.1039/D0SC01700K
(Edge Article)
Chem. Sci., 2020,
11, 8273-8287
Melting temperature measurement and mesoscopic evaluation of single, double and triple DNA mismatches†
Received
23rd March 2020
, Accepted 23rd July 2020
First published on 23rd July 2020
Abstract
Unlike the canonical base pairs AT and GC, the molecular properties of mismatches such as hydrogen bonding and stacking interactions are strongly dependent on the identity of the neighbouring base pairs. As a result, due to the sheer number of possible combinations of mismatches and flanking base pairs, only a fraction of these have been studied in varying experiments or theoretical models. Here, we report on the melting temperature measurement and mesoscopic analysis of contiguous DNA mismatches in nearest-neighbours and next-nearest neighbour contexts. A total of 4032 different mismatch combinations, including single, double and triple mismatches were covered. These were compared with 64 sequences containing all combinations of canonical base pairs in the same location under the same conditions. For a substantial number of single mismatch configurations, 15%, the measured melting temperatures were higher than the least stable AT base pair. The mesoscopic calculation, using the Peyrard–Bishop model, was performed on the set of 4096 sequences, and resulted in estimates of on-site and nearest-neighbour interactions that can be correlated to hydrogen bonding and base stacking. Our results confirm many of the known properties of mismatches, including the peculiar sheared stacking of tandem GA mismatches. More intriguingly, it also reveals that a number of mismatches present strong hydrogen bonding when flanked on both sites by other mismatches. To highlight the applicability of our results, we discuss a number of practical situations such as enzyme binding affinities, thymine DNA glycosylase repair activity, and trinucleotide repeat expansions.
Introduction
The hydrogen bonding strength of canonical AT and GC base pairs in duplex DNA is essentially independent of the flanking base pairs. The stacking interaction strength between nearest-neighbours is also largely independent of next-nearest-neighbours. As a consequence, the number of different interactions of canonical base pairs is fairly small and it is relatively simple to construct efficient thermodynamic models. In contrast, there are eight additional mismatched base-pair combinations, namely AA, AC, AG, CC, CT, GG, GT and TT and, unlike canonical base pairs, their properties depend strongly on their nearest-neighbour configurations.1 As a result, the number of configuration dependent properties is very large and to date only a few of these have been analysed experimentally or theoretically. The situation with two or three consecutive mismatches becomes even more complicated and even fewer of these possible configurations have been studied. The properties of mismatches are very sensitive to experimental conditions such as pH and salt concentrations, which further complicates comparative studies. To date there is still no study that considers all mismatch configurations under the same conditions.
Mismatches can occur in genomic DNA and are produced by a range of factors, such as replication errors,2 misincorporation3 and cytosine methylation.4 When they do occur, they are checked and corrected by an extensive array of repair mechanisms.5 However, if left uncorrected they give rise to mutations. A central aspect for repairing a mismatch defect is its recognition by specialized enzymes such as MutS,6–8 Msh2–Msh6,9,10 and Rad4/XPC.11 Mismatch recognition is also known to be important for base pair substitution in Cas9-induced DNA breaks.12 Furthermore, mismatch recognition can be performed by a substantial number of small organic molecules and metal complexes with the potential for acting as drugs.13 In most cases, the efficiency of mismatch recognition depends strongly on the type of mismatch as well as on its neighbouring base pairs.14,15 Similarly, mismatch repair may depend on the type of flanking base pair. For instance, the thymine excision efficiency of GT mismatches, due to thymine-DNA glycosylase, has a well known dependency on the type of base-pairs neighbouring GT.16–18
Evaluating the dependence of the thermal and structural properties of mismatches with nearly all possible nearest neighbours, which we will refer to as the context, is a challenging problem. Few theoretical models can deal simultaneously with the large amount of sequences that would cover that many mismatch contexts. These models need to be computationally efficient which requires a considerable level of simplification. For instance the nearest-neighbour (NN) model is simple enough to be numerically efficient, but does not provide the desired level of structural information. However, mesoscopic models have a comparable numerical efficiency to NN models, yet can provide details on intramolecular interactions.19,20
In the NN model, the parameters for single mismatches can be derived from a relatively small set of melting temperatures21–24 and are generally sufficient for melting temperature prediction. However, in general, NN models provide little insight into the detailed intramolecular interactions. More elaborate models, such as mesoscopic models,19,20 can provide some information about intramolecular interactions, but they require a much more complete and diverse set of melting temperatures. Therefore, the existing set of published melting temperatures has been insufficient for applying mesoscopic models to the task of providing information on hydrogen bonds and stacking interactions. Larger sets for specific conditions do exist as for instance, a microarray probe set by Hooyberghs et al.25 with single mismatches. However, hybridization to immobilized probes in microarrays can affect the melting temperatures,26 and to date there are no validated mesoscopic models for this experimental situation.
Early studies on melting temperatures established that guanine mismatches (GT, GG, and AG) are the most stable and cytosine (AC, CC) the least stable base pair.27–29 Werntges et al.,30 using melting temperatures, classified mismatched base pairs as wobble pairs (GT, GG, AC, AA and AG), open pairs (TT, CT, TC and CC) and weak base pairs (GT, AC, and AG). Tandem AG mismatches were found to be particularly stable,31 and the influence of flanking base pairs and the terminal position is also well established.32–35 In an important work, a larger set of melting temperatures was published21–24 covering all eight single mismatch types, including a few sequences from previous studies.28,36 Further thermodynamic studies focused on terminal mismatched base pairs,37 changes in buffer conditions,38–41 and the use of scanning differential calorimetry (DSC).42–44
While melting temperatures are mostly calculated with NN-type models,21–24 it is possible to use more elaborate statistical physics approaches such as the Peyrard–Bishop (PB) model.19 The PB models use simple potentials for the basic intramolecular interactions. Specifically, a Morse potential is used to describe base-pair dependent interactions, which are mostly hydrogen bonds, and an elastic potential that mimics the stacking interactions. Both are effective potentials, that is, they cover all interactions that are either base-pair or nearest-neighbour dependent. The model Hamiltonian describes the energy contributions of these two potentials and is used to evaluate the classical partition function over all possible DNA configurations.45 We showed that it is possible, with suitable parameters, to derive an index from the partition function which can be used to calculate melting temperatures.19 We demonstrated that it is also possible to run the procedure in reverse, starting from melting temperatures to calculate model parameters.20 The parameters obtained from melting temperatures in this way were shown to be consistent with existing knowledge of hydrogen bonds and stacking interactions in a number of situations: RNA,46 GU mismatches in RNA,47 deoxyinosine,48 and more recently DNA–RNA hybrids.49 In all cases the temperature-derived parameters reproduced all the main characteristics of these nucleic acids.
Here we report the measurement and mesoscopic analysis of 4096 fixed length sequences where the central three base pairs cover all possible combinations of the bases A, C, G and T. Therefore, as well as the 64 sequences that only contain the canonical base pairs AT and CG, we include 576 single, 1728 double and 1728 triple mismatches. Single and double mismatches are covered in all nearest-neighbour contexts, except for terminal mismatches which are not considered here. The mesoscopic analysis is performed with the Peyrard–Bishop (PB) statistical physics model using microscopic potentials, taking into account the effective hydrogen bonding and stacking interactions.45 Despite the computational efficiency of the PB model calculation,46 the large number of context dependent nucleotide configurations, the large number of sequences and the large number of parameters to evaluate has required a considerable computational effort. The final parameters, are comprised of 440 Morse potentials and 3084 elastic constants which can be related to hydrogen bonds and stacking interactions, respectively. The analysis of these parameters has confirmed several well-known properties of DNA mismatches, but has also yielded numerous unknown results, of which perhaps the most intriguing one is the surprising stability of several mismatch triplets. In terms of stacking parameters we observed very large interactions for the well-known GA–AG mismatches in a sheared stacking conformation. To exemplify some possible applications of the new parameters we evaluated triplet mismatches related to enzyme binding, trinucleotide repeats, and thymine DNA glycosylase, and found positive correlations with experimental results.
Materials and methods
The mesoscopic model
We used the model proposed by Peyrard and Bishop45 with harmonic stacking interactions which has provided good results in a variety of situations.20,46,48 The model starts from a Hamiltonian where two potentials describe the hydrogen bonding and stacking interactions. From this Hamiltonian, we calculate the classical partition function for heterogeneous DNA sequences using the method developed by Zhang et al.50 This partition function can then be used to derive an index, which can be correlated to the experimental melting temperatures.19 In the following, we will describe the main components of the Hamiltonian that are relevant for understanding the results of this work.
The main components of this model are the hydrogen bond represented by a Morse potential,
| | | V(yi) = Di (e−yi/λi − 1)2 | (1) |
where
D and
λ are the potential depth and width, respectively.
y is the relative displacement between the bases, see
Fig. 1. The stacking interaction is
| | 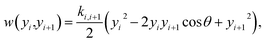 | (2) |
where
k is the elastic constant. Unlike the Morse potential of
eqn (1), which only depends on the base pair of index
i, the stacking potential depends on consecutive base pairs
i and
i + 1. The small angle (0.01 rad)
θ was introduced to avoid numerical problems in the partition function integral.
19
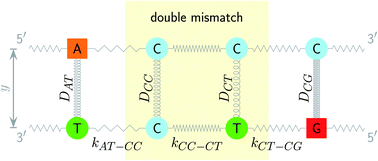 |
| | Fig. 1 Schematic diagram of the intramolecular interactions in the PB model, exemplified for a double mismatch (shaded area). The hydrogen bonds are represented here by the Morse potential depth D for each base pair (coils) and the stacking interactions are represented by the elastic constant k for each nearest neighbour (zigzag lines). | |
The two potentials, eqn (1) and (2), are combined into the configurational part of the Hamiltonian
| | | U(yi,yi+1) = w(yi,yi+1) + V(yi). | (3) |
The two main model parameters are the Morse potential depth D and the stacking constant k. Fig. 1 shows an example of these interactions, represented by their main parameters, for the case of a double mismatch CC and CT. Eqn (3) is summed over all base pairs N in the partition function
| | 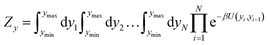 | (4) |
where
β = 1/(
kBT),
kB is the Boltzmann constant and
T the absolute temperature. The boundary condition is represented by
U(
yN,
y1) where we set
w(
yN,
y1) = 0 to represent an open ended duplex. The integral of
eqn (4) is carried out over all possible configurations of base pair displacements
yi. Therefore, all Morse potentials and stacking interactions, of all base pairs, are considered simultaneously in the evaluation of
eqn (4).
The partition function, eqn (4), is used to calculate an adimensional index τ which can be correlated to experimental melting temperatures, as described in the next section. For the integration of the partition function (see for instance eqn (14) of ref. 51) we used 400 points over the interval ymin = −0.1 nm to ymax = 20.0 nm, and a cut-off of P = 10 from eqn (22) of ref. 51. The calculation of the thermal index τ is carried out at 370 K. Please note that this temperature is unrelated to the temperatures obtained from the regression method. For further details on the model implementation please see ref. 20,51 and 52.
For the analysis of some particular sequences we calculated the average displacement 〈ym〉, at the mth position in the sequence which is obtained from
| | 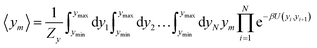 | (5) |
as for the partition function,
eqn (4), its calculation is carried out at an absolute temperature
T which is not related to the melting temperatures obtained from the regression method. For details on this type of calculation see
ref. 52.
Melting temperature prediction
Given a set of tentative model parameters P = {p1, p2…pL} consisting of Morse potentials D and stacking parameters k, we calculated an adimensional melting index τi(P) for each sequence i from the partition function, eqn (4), of the Peyrard–Bishop Hamiltonian.19 The melting temperature  , resulting from the tentative set of parameters P, is then obtained from the following linear equation,
| | 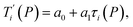 | (6) |
Experimental data used
4096 sequences were melted under buffer conditions of 50 mM sodium chloride and 10 mM sodium phosphate pH 7.4, total strand concentration 1.0 µM. All melting analyses were performed using a Roche LightCycler™ as previously described,53 and the melting temperatures were estimated from the maxima in the first derivative. All sequences and their respective measured melting temperatures are shown in ESI Table S1.† Oligonucleotides were prepared by standard phosphoramidite chemistry and were labelled with 5′-fluorescein on one strand and 3′-dabcyl on the complementary strand.
Sequence decomposition and notation
All 4096 sequences are of type
| 5′-CGACGTGCN1N3N5ATGTGCTG-3′ |
| 3′-GCTGCACGN2N4N6TACACGAC-5′ |
where Ni is A, C, G or T. We will refer to the variable part N1N3N5/N2N4N6 as the central trimer.
Context dependent base-pair notation
The properties of mismatched base pairs are known to be dependent on their immediate neighbours, that is, on their context. Consider for instance a base pair BP in the following context
The context represented by the flanking base pairs N1N2 and N3N4 will be given by an index, say α, such that BPα means a BP base pair in this particular context, and its Morse potential will be represented by DBPα. For example, in the three base pair sequence 5′-ATG-3′/3′-TGT-5′, the central GT mismatch will be labelled as GTav (BP = GT, α = av), according to the rules laid out in the ESI Table S2.†
Base pair context groups
The data set of 4096 sequences contains a total of 2082 unique context trimers of type N1BN3/N2PN4 which therefore would result in an equal number of different base pair Morse parameters. However, as will be discussed in the following sections, this also implies 8768 stacking parameters, that is a total of 10![[thin space (1/6-em)]](https://www.rsc.org/images/entities/char_2009.gif) 850 parameters would be required, exceeding by far the number of available sequences. To reduce this excessive number of parameters, while still considering context-dependence in broader sense, we regroup similar context base pairs into a single index as follows
850 parameters would be required, exceeding by far the number of available sequences. To reduce this excessive number of parameters, while still considering context-dependence in broader sense, we regroup similar context base pairs into a single index as follows
| N1BN3/N2PN4, N2BN3/N1PN4, N2BN4/N1PN3, N1BN4/N2PN3, N1PN3/N2BN4, N2PN3/N1BN4, N2PN4/N1BN3, N1PN4/N2BN3 |
in other words, we group all context trimers in terms of similar base-pairs. This set of contexts will be collectively referred to as {N1![[B with combining low line]](https://www.rsc.org/images/entities/char_0042_0332.gif) N3/N2
N3/N2![[P with combining low line]](https://www.rsc.org/images/entities/char_0050_0332.gif) N4}, with the central base pair underlined for clarity. To exemplify, all the context trimers of base pair GTah (BP = GT) are grouped together as
N4}, with the central base pair underlined for clarity. To exemplify, all the context trimers of base pair GTah (BP = GT) are grouped together as
{C![[c with combining low line]](https://www.rsc.org/images/entities/char_0063_0332.gif) a/G a/G![[t with combining low line]](https://www.rsc.org/images/entities/char_0074_0332.gif) g} = Cca/Gtg, Cta/Gcg, Gca/Ctg, acC/gtG, acG/gtC, atC/gcG, atG/gcC, gcC/atG g} = Cca/Gtg, Cta/Gcg, Gca/Ctg, acC/gtG, acG/gtC, atC/gcG, atG/gcC, gcC/atG |
In this way, we need to consider only 440 Morse potentials each in their specific context. Due to symmetry considerations, context groups may contain less than 8 trimer contexts, or even just one as for instance aaa/aaa (AAa). The complete set of context dependence groups is shown in ESI Table S2.†
Canonical and mismatch notation
We generally represent a trimer by uppercase letters for canonical base pairs (AT, CG) and lowercase for mismatches. For instance, 5′-ATG-3′/3′-TGT-5′ will be shown as Atg/Tgt, a canonical AT, a mismatch TG followed by another mismatch GT.
Context dependent nearest-neighbour notation
Adapting the typical intra-strand notation, say 5′-ATα-3′/3′-TAβ-5′ to the notation above would rapidly become impractical. Instead we keep a base-pair oriented notation ATα–TAβ, that is, a base pair AT in context α followed by another TA in context β, and drop the 5′ and 3′ notation. The stacking parameter in this example will be kATα–TAβ.
Nearest neighbour context groups
The stacking interaction involves two nearest neighbour (NN) base pairs, by considering also the flanking base pairs to each side of the NN, this results in 8768 possible context combinations present in this dataset. Using the BP context groups, this number can be reduced by introducing NN context groups formed by the intersection of BP groups sharing the same sequence steps, which we describe as follows. For two consecutive mismatch base pairs B1P1 and B2P2, each in its own trimer context, we need effectively to consider tetramer contexts such as
In a similar way as for BP context groups, we will combine all possible NN contexts into a group
which is formed by the intersection of groups
and
. In this way, the 440 different BP groups result in 3084 NN context groups. The NN groups will be represented in square brackets, underlining two base pairs to distinguish them from the BP group notation. For example,

refers to the intersection of the {A
c/T
t} and {C
c/G
c} trimer groups related to CC
y–CT
e nearest neighbours, see
Fig. 2. Note that in some cases, when one of the base pairs is canonical, without its own trimer context, the NN context reduces to a group of trimers, as for instance

for AC
au–AT. Note that the group

does not contain all trimer of AC
au {A
![[a with combining low line]](https://www.rsc.org/images/entities/char_0061_0332.gif)
g/T
g} but only the ones where the nearest neighbour is AC–TA. The NN context groups are given in ESI Table S3.
†
 |
| | Fig. 2 Schematic diagram of context groups, exemplified for the same double mismatch of Fig. 1. BP context groups are shown in the upper part and respective Morse potentials are displayed in the same colour. Similarly, NN context groups are shown in the lower part and their associated stacking potential constants k are colour coded accordingly. | |
Notation for transitions and transversions patterns
Transition mismatched base pairs,54 sometimes also called transduction base pairs,55 are formed by purine–pyrimidine base pairs AC and GT and we will refer to them by a lowercase t. The non-mismatched purine–pyrimidine base pairs AT and CG will be referred to by an uppercase T although they are strictly speaking not involved in mutations. Transversion base pairs are formed either by purine–purine or pyrimidine–pyrimidine pairs,54 and we will refer to them as v, always lowercase. For instance, Aga/Ttg in the transition/transversion notation will be represented as Ttv, similarly the cgg/tgg trimer will be represented as vvv. Note that within a BP context group all trimers will share the same transition–transversion pattern. The transition/transversion patterns for all BP contexts are shown in ESI Table S2.†
Minimization procedure
Optimization method.
Here, we briefly outline the optimization method used to obtain the model parameters, which is described in detail in ref. 19 and 20.
For each tentative set of model parameters Pj we calculated the predicted melting temperatures  , eqn (6), and compared them to the experimental temperatures Ti. The model parameters (Pj) were then varied until we minimized the squared differences
| |  | (7) |
The minimization was implemented numerically by the Nelder–Mead or downhill simplex method,20 using eqn (7) as objective function and finding its minimum in the multidimensional space represented by the model parameters Pj. Due to the large number of possible mismatch contexts the minimization procedure of eqn (7) was carried out in several separate minimization rounds, as will be discussed in the next sections.
We also refer in this work to an average melting temperature deviation
| | 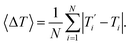 | (8) |
Seed parameters.
In all optimizations we varied the ith initial parameters pi randomly in an interval| | | pi ∈ [(1 − f)si, (1 + f)si] | (9) |
that is, within a fraction ±f of a seed value si. For instance f = 0.2 would result in an interval [0.8si, 1.2si].
Optimization of canonical base pairs (CBP).
We started with separating 64 sequences and their corresponding melting temperatures that contained no mismatches and optimized their parameters separately. Here we used as seed values the DNA parameters at 69 mM [Na+] obtained previously.20 We will refer to this as the canonical base pair (CBP) optimization round and a total of 500 minimizations with different initial parameters were performed, chosen according to eqn (9) with f = 0.2. For the unoptimized parameters we had χ2 = 29.3 °C2 which decreased to χ2 = 20.4 °C2 after optimization, corresponding to a 〈ΔT〉 of 0.510 °C reduced to 0.444 °C. In the following optimization steps the parameters of the canonical base pairs AT and CG were kept fixed.
Context independent (CI) mismatch optimization.
Before trying to optimize the large number of context-dependent parameters, we first optimized a smaller number of mismatch parameters without taking into account the context. In other words, we considered all mismatches as independent from their flanking base-pairs, we will refer to this as the context independent (CI) parameter optimization. A total of 134 parameters were optimized in this step, 8 being Morse potential parameters and the remaining 126 are stacking parameters. We used f = 0.4 as an interval for randomly selecting initial parameters, the seed parameters were 32.4 meV for the Morse potential D and 2.5 eV nm−2 for the stacking parameter k. Non-mismatched parameters were kept fixed at the values obtained in the CBP optimization. Before optimization, the quality parameter of eqn (7) was χ2 = 37600 °C2, corresponding to 〈ΔT〉 = 2.35 °C. After optimization we obtained χ2 = 11000 °C2 and 〈ΔT〉 = 1.20 °C. Here we performed 400 minimization rounds, in parallel, which required a total of 4.3 years single-processor equivalent computing time operating at 2.6 GHz.
Context dependent (CD) mismatch optimization.
Considering context dependence we calculated 3084 stacking parameters and 440 Morse potentials. The seed parameters were those of the CI optimization, described in the previous paragraph, chosen randomly in an interval of f = 0.2. For this we could perform only 40 individual rounds, due to limited computational resources, which required a total of 0.5 year per round. In total, 1.8 × 10⁸ different parameter sets Pj were evaluated in this process. Convergence was considered sufficient if Δ(χ2) between two full local minimizations was less than 0.1 °C2. After the optimization we obtained the quality parameters χ2 = 7350 °C2 and 〈ΔT〉 = 0.984 °C. The complete procedure of parameter optimizations, CBP, CI and CD, is summarized as a schematic work-flow in Fig. 3.
 |
| | Fig. 3 Work-flow of the optimization procedure. | |
Availability
All sequences, their respective melting temperatures and all calculated parameters are included in our updated software package TfReg52 and are freely available. All results presented here can be verified with this software. A simplified web site for searching through the large number of parameters is accessible at https://bioinf.fisica.ufmg.br/app/search-mismatch.pl.
Results
Melting temperature measurements
All measured melting temperatures are shown in ESI Table S1,† in decreasing order i of the temperature Ti. The data set contains 576 sequences with single, 1728 with double and 1728 with triple mismatches. Only the triple mismatches are not fully covered in all possible nearest neighbour configurations. First, we will analyse the thermal stability trend for single mismatches. For this we evaluated the overall logarithmic rank R over all i belonging to the central base pair N3N4| |  | (10) |
The logarithmic rank, shown in Table 1, provides a simple measure to evaluate the thermal stability trend
| GA ≈ GT > GG > AG > TG > AA ≈ TT > AC ≈ TC > CA > CT > CC |
which correlates well with established trends, such as GG > TT ≈ AA > CC by Peyret
et al.,
24 and GT ≥ GA > CT > AC by Allawi and SantaLucia.
22 Unfortunately, summarizing the mismatch stabilities in this way, while being common practice, can be misleading. For instance, there is a clear overlap if one considers the average melting temperature 〈
T〉 and the standard deviation std(
T) as shown in
Table 1, though it still suggests an ordered sequence of mismatch stability. However, the notion of a stability trend breaks down when we inspect all mismatches with higher melting temperatures than that of the canonical trimer ATT/TAA, which has a melting temperature of 60.7 °C and ranks lowest of all canonical trimers at position 159. There are 88 single, 4 double and one triple mismatches with higher melting temperatures than ATT/TAA. The single mismatch trimer with highest melting temperature is GGC/CGG, ranking 28 with 65.9 °C, which is higher than 37 canonical trimers. This implies that less than half of the all-canonical sequences have higher temperatures than any other sequence containing mismatches.
Table 1 Stability trends calculated according to logarithmic rank of canonical base pairs and single mismatches. Also shown are the average melting temperatures 〈T〉 and their standard deviations std(T) given in °C
| BP |
R
|
〈T〉 ± std(T) |
BP |
R
|
〈T〉 ± std(T) |
| GC |
6.1 |
66.1 ± 1.9 |
CG |
6.3 |
65.8 ± 2.2 |
| AT |
6.8 |
64.1 ± 1.8 |
TA |
7.0 |
63.8 ± 1.8 |
| GA |
8.3 |
60.2 ± 2.4 |
GT |
8.3 |
59.9 ± 2.2 |
| GG |
8.5 |
59.9 ± 3.0 |
AG |
8.6 |
59.7 ± 3.0 |
| TG |
8.7 |
59.2 ± 2.8 |
AA |
8.9 |
57.8 ± 1.9 |
| TT |
8.9 |
57.9 ± 2.0 |
AC |
9.2 |
57.1 ± 2.2 |
| TC |
9.2 |
56.8 ± 1.8 |
CA |
9.3 |
56.7 ± 2.7 |
| CT |
9.4 |
56.4 ± 2.2 |
CC |
9.8 |
54.7 ± 2.6 |
Having 15% of all possible single mismatches with higher melting temperatures than the canonical ATT/TAA has important consequences for applications such as SNP detection, which rely critically on the ability to distinguish mismatches and canonical base pairs.56,57
Mesoscopic calculations
The calculations were conducted in three parts, first we separated out the sequences without any mismatches, that is, only with canonical base pairs (CBP) AT and CG. The second step was to use the CBP parameters as seed parameters for all sequences, but without considering the mismatch context, which we called context independent (CI) calculation. The final step was to use the results of the CI calculation as input for the context dependent (CD) calculations. This procedure was necessary to reduce the computational effort, especially for the CD part. The complete workflow is outlined in the Methods section. The resulting CBP parameters are overall very similar to the parameters we had obtained previously for DNA at low salt concentrations20 and are summarized in ESI Tables S4 and S5.† Note that we have not considered explicitly the influence of the fluorescent markers, however the overall similarity of the new canonical parameters with those of ref. 20 indicates that those had little influence over the thermal stability and these are identical for all sequences that we have examined.
Context independent (CI) parameters
The CI Morse potentials D, eqn (1), are shown in Fig. 4 and for most mismatches they are very small, with the notable exception of AG and GG. As we will discuss later, all these Morse potentials will spread considerably when context dependence is considered. Nevertheless, it is interesting that we already see a good agreement with quantum chemical calculations, which show that GG is much more closely bonded than CC.58 These results also follow very closely the trend observed by Peyret et al.24 for similar mismatches.
 |
| | Fig. 4 Calculated Morse potentials for CI (red bullets) type base pairs. The dashed grey line is the value of the Morse potential of the canonical AT base pair. See also ESI Table S4.† | |
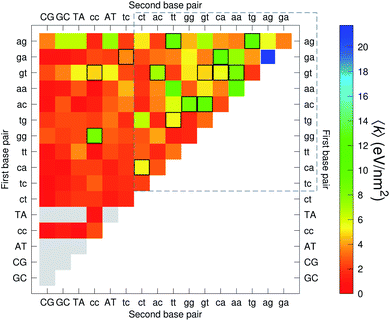
The CI stacking parameters k, eqn (2), are shown as a heat map in Fig. 5. The rows and columns were ordered in such a way that the rows with largest sum of k are displayed towards the top, and the columns are ordered with the largest sum of k displayed to the right. In this way, most of the largest k values are clustered towards the top-right corner of the heat map, highlighted by the dashed area in Fig. 5. Several of the stacking parameters are much larger than typically found for non-mismatched base pairs, but there is also an equally large amount of very low stacking parameters, as represented by the many dark-red boxes in Fig. 5. For the larger stacking parameters, one case that stands out is the single blue box in Fig. 5, which is GA–AG with 17.3 eV nm−2. In general, nearest neighbours involving AG mismatches are amongst those with highest stacking interactions. We will return to this later when we analyse the context dependent (CD) results. It is interesting to note that there are very few cases of large stacking parameters involving canonical base pairs.
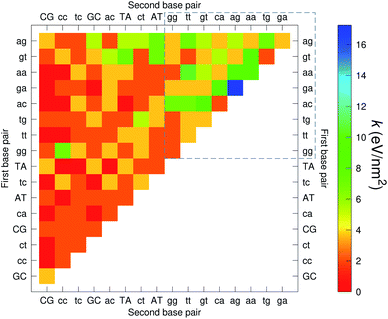 |
| | Fig. 5 Heat map of stacking interactions k of CI nearest-neighbours in form BP1–BP2, that is, first base pair followed by second base pair. Lower case letters refer to mismatched base pairs. The matrix was ordered by row and column such that the highest values are clustered in the top-right corner of the map, represented by the dashed box. Note that the matrix is symmetrical towards the antidiagonal (bottom-right to top-left), for instance aa–gg is the same as gg–aa, therefore we left the lower part empty for clarity. The actual values are shown in ESI Table S5.† | |
Context dependent (CD) parameters
For the CD optimization we had to consider 440 Morse potentials, and even those represent only a subset of all possible context configurations which were grouped according to base pair similarity. As the Morse parameters are now discriminated by flanking base pairs, see Fig. 2, we are effectively referring to trimers, even though they are strictly on-site parameters. The complete table with all context groups is given in ESI Table S2.† To better illustrate the main characteristics of the new parameters, we also classified each base pair as a transition (t) or transversion (v), following the notation outlined in the Methods section. Fig. 6 and 7 highlight the Morse potentials that deviate by a large amount in comparison to their corresponding CI parameters. The complete set of Morse potentials is shown in ESI Table S6 and ESI Fig. S1–S8.†
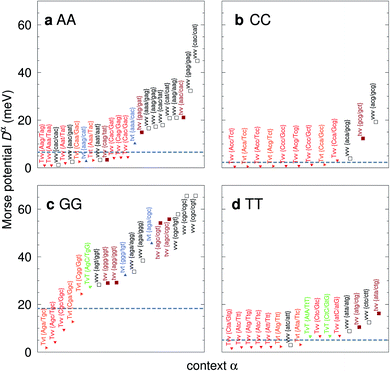 |
| | Fig. 6 Context dependent (CD) Morse potentials for (a) AA, (b) CC, (c) GG and (d) TT mismatches. Shown are only those Morse potentials that deviate by more than 30% from the seed CI potentials, shown as dashed grey lines. Also shown are the transition/transversion characteristic and the BP context group α. Colour coding is as follows: vvv (black); tvv and vtv (brown); tvt and ttv (blue); Tvt, Tvv and TTv (red to orange); TvT and TtT (green to lime). The complete set is shown in ESI Fig. S1–S4 and ESI Table S6, and the full context groups are given in ESI Table S2.† | |
 |
| | Fig. 7 Context dependent (CD) Morse potentials for (a) AC, (b) CT, (c) AG and (d) GT mismatches. Shown are only those Morse potentials that deviate by more than 30% (panels a–c), or 50% for panel (d), from the seed CI potentials, shown as dashed grey lines. Colour coding for the transition/transversion characteristic is as follows: vvv (black); tvv and vtv (brown); tvt and ttv (blue); Tvt, Tvv and TTv (red to orange); TvT and TtT (green to lime). The complete set is shown in ESI Fig. S5–S8 and ESI Table S6.† | |
The majority of the 440 calculated mismatch Morse potentials are quite small, 314 are smaller than 10 meV, of which 209 are less than 5 meV. This is to be expected, given that the general nature of the mismatches is to destabilize the duplex. In addition, this low potential is essentially equivalent to a flat Morse potential, giving support to studies using the PB model which had considered a flat potential for mismatches.59,60
The potentials exceeded an AT-like value of 25 meV only in 19 cases, of which 5 are in the region of CG-like potentials. However, the result that stands out very clearly is that almost all the largest Morse potentials occur for mismatches that are flanked on both sides by other mismatches. The single exception is GT where the largest Morse potential is flanked by canonical base pairs, Fig. 7d.
In Fig. 6 we show the potentials for like-with-like type mismatches, which are all transversions. For three of these mismatches the highest potentials are of type vvv, that is a transversion flanked on both sides also by transversions, and one case of type tvv. In all these cases the Morse potentials are substantially larger than the seed CI parameters. In several cases the Morse potentials are very strong, as for instance in {c![[g with combining low line]](https://www.rsc.org/images/entities/char_0067_0332.gif) c/ct} context, Fig. 6c, which exceeds 60 meV and is almost equivalent in strength to an ordinary CG base pair. Note that this does not mean that such a cgc/cgt trimer is particularly stable as a whole, but that a GG mismatch when surrounded by a CC and CT has by itself a large potential. Consider for example the duplex ACGCA/TCGTT, the GGaq mismatch, {cc/ct}, with Morse potential depth 65.6 meV, which is flanked by CCag with 0.800 meV and a CTau with 0.620 meV. These results indicate that in many cases, in a trimer consisting only of mismatches, the central mismatch appears to have enough freedom to arrange itself in a very stable configuration when flanked by highly unstable mismatches. Indeed, there is only one case, the {AC/TG} context, where the GGx mismatch has an increased Morse potential of 27.4 meV, while being flanked by two canonical base pairs, see Fig. 6. A very similar conclusion can be drawn from Fig. 7 where we show AC, AG, CT and GT. Here, AC and GT are the only two transition base pairs. For GT in particular, Fig. 7d, we find the only case {AC/TG} where the highest potential is not flanked solely by mismatches, though its value of 17.5 meV is still comparatively small. For the transversions CT and AG, Fig. 7b and c, we observe again that the vvv patterns have the highest potentials.
c/ct} context, Fig. 6c, which exceeds 60 meV and is almost equivalent in strength to an ordinary CG base pair. Note that this does not mean that such a cgc/cgt trimer is particularly stable as a whole, but that a GG mismatch when surrounded by a CC and CT has by itself a large potential. Consider for example the duplex ACGCA/TCGTT, the GGaq mismatch, {cc/ct}, with Morse potential depth 65.6 meV, which is flanked by CCag with 0.800 meV and a CTau with 0.620 meV. These results indicate that in many cases, in a trimer consisting only of mismatches, the central mismatch appears to have enough freedom to arrange itself in a very stable configuration when flanked by highly unstable mismatches. Indeed, there is only one case, the {AC/TG} context, where the GGx mismatch has an increased Morse potential of 27.4 meV, while being flanked by two canonical base pairs, see Fig. 6. A very similar conclusion can be drawn from Fig. 7 where we show AC, AG, CT and GT. Here, AC and GT are the only two transition base pairs. For GT in particular, Fig. 7d, we find the only case {AC/TG} where the highest potential is not flanked solely by mismatches, though its value of 17.5 meV is still comparatively small. For the transversions CT and AG, Fig. 7b and c, we observe again that the vvv patterns have the highest potentials.
The analysis of 3084 different stacking potentials is difficult, not only because of the large number of parameters, but also for the complexity introduced by the context dependence, see Fig. 2. Here we employed a similar analysis as for the CI parameters, but using the average and standard deviation of groups of stacking parameters. We collected all parameters matching the pattern notation BP1α–BP2β as set out in the Methods section, and then calculated the average 〈k〉 and arranged these in a BP1 × BP2 matrix as shown in Fig. 8. Similarly, we calculated the associated standard deviation std(k) which is shown in Fig. 9. The largest average stacking interaction is for GA–AG of 21.8 eV nm−2 shown by a single blue box in Fig. 8, and its standard deviation is in the region of 6.7 eV nm−2 in Fig. 8.
 |
| | Fig. 8 Heat map of the average stacking interactions 〈k〉 of CD nearest-neighbours in form BP1–BP2. The matrix was ordered by row and column, such that the highest values are clustered in the top-right corner of the map, represented by the dashed box. Note that the matrix is symmetrical towards the antidiagonal, for instance aa–gg is the same as gg–aa, therefore we left the lower part empty for clarity. Grey boxes refer to canonical base pairs that were not included in the CD-type optimization. Boxes with black or white border represent the cases where the standard deviation exceeds 4.0 eV nm−2. | |
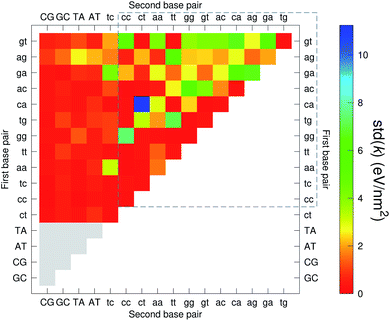 |
| | Fig. 9 Heat map of the standard deviation of stacking interactions std(k) of CD nearest-neighbours in form BP1–BP2. The matrix was ordered by row and column, such that the highest values are clustered in the top-right corner of the map, represented by the dashed box. Note that the matrix is symmetrical towards the antidiagonal, for instance ca–ct is the same as tc–ac, therefore we left the lower part empty for clarity. Grey boxes refer to canonical base pairs that were not included in the CD-type optimization. | |
Discussion
Here we will attempt to compare the main characteristics of our results with measurements from other experimental techniques such as X-ray diffraction and nuclear magnetic resonance (NMR), as well as with theoretical calculations such as molecular dynamics (MD) and density functional theory (DFT). We will briefly review the existing knowledge for each type of mismatch and how it relates to our findings.
AA
AA mismatches in the contexts {CC/GG} and {AC/TG} were found to have a single hydrogen bond61,62 which compares to Morse potentials of 4.66 meV and 7.73 meV, respectively. Other contexts do not indicate substantial hydrogen bonding, for instance the context {Aa/Tg} with 4.70 meV, was found not to form hydrogen bonds.63 MD of poly-dA duplexes has suggested several possible configurations for the AA mismatch with either Watson–Crick or Hoogsteen hydrogen bonds.40 In our case the AA mismatch flanked by other AAs, {aa/aa}, resulted in a small potential of 5.62 meV. The smallest Morse potential found for AA was 0.989 meV, in the context {Ag/Tg}, which clearly suggests the absence of any important hydrogen bond or other localized inter-strand interactions. At the other extreme there are several situations where two hydrogen bonds would seem plausible, for example with {cc/ct}, an AA mismatch flanked by CC and CT, with 44.9 meV, see also Fig. 7a. We not aware of any experimental results for an AA mismatch in this particular context.
CC
CC mismatches have been reported to be the least stable mismatch24,43 and we found that the Morse potentials for this mismatch are generally very small, see Fig. 6b. For instance, for {AC/TG} we obtained 2.29 meV, which is supported by reports of negligible bonding.64,65 DFT calculations also suggest weak hydrogen bonding due to steric repulsion.58 On the other hand, there are some reports of single24 and double hydrogen bonds66 for {AC/TG}, which is in contrast to the other experimental results. Other contexts, such as {AA/TT} (2.26 meV) and {CC/GG} (2.62 meV) were also reported as negligibly bonded.65 In general the Morse potentials for CC shown in Fig. 6b clearly show a complete absence of any sizeable hydrogen bond strength, except for a moderate potential of 19.2 meV {ag/gg} and 12.3 meV {gg/gt}, in both cases flanked by a GG mismatch. Also note the common gcg motif in this case.
GG
GG mismatches were found to have a configuration in anti–syn or syn–anti with two hydrogen bonds for contexts {CC/GG}67,68 corresponding to 18.8 meV and {AA/TT}69 with 19.4 meV. For {AC/TG} the experimental findings are mixed with weak,70 single,71 double72 and bifurcated hydrogen bonds.73,74 In our case we found 27.4 meV for {AC/TG}, which is a strong Morse potential, comparable to an AT base pair, which would be consistent with double hydrogen bonding.
TT
TT flanked by CG base pairs, {CC/GG}, are known, from NMR measurements, not to be hydrogen bonded,32 or to contain only a single hydrogen bond.62 This is consistent with the low Morse potentials 6.80 meV. In {AC/TG} a stacked mismatch with weaker bonding was measured,61,64 for which we obtained 6.47 meV. The stacking interactions found were  with 2.34 eV nm−2 and
  with 2.64 eV nm−2, which are in the same range as for canonical DNA. On the other hand, for {AC/TG} that has been reported not to show wobble conformations due to increased CH/π interactions (W2 sequence of ref. 75), we obtained 6.47 meV and moderately larger stacking interactions of 3.44 meV nm−2 and 3.93 meV nm−2, for
  and
and  , respectively. Specific TT hydrogen pairing modes were observed at low temperature for {CC/GG}, {AC/TG} and {AA/TT},76 however all these contexts resulted in very similar Morse potentials, 6.80, 6.47 and 6.60 meV, respectively.
AC
AC type mismatches are generally thought to have one77 or even two hydrogen bonds in anti–anti,27,67,78–83 and DFT calculations also suggest this.84,85 However, the Morse potentials for AC shown in Fig. 7a, with few exceptions, do not appear to support the presence of strong hydrogen bonds. Some AC contexts were measured by NMR, typically at pH between 4.5 and 5.5: {AC/TG},78,81,83 2.30 meV; {CC/GG},67,77,79,80 2.45 meV; {cg/tt},27 2.22 meV; and {AA/TT},82 2.82 meV. Some moderate Morse potentials were observed only for AC when flanked by other mismatches, the largest being 16.9 meV {cc/ct}, see Fig. 7a, typically in vtv or ttv patterns.
CT
CT mismatches generally show very low Morse potentials, as small as 0.199 meV for {Aa/Tc}, which does not correlate with quantum mechanical calculations that reported several interstrand interactions.86 The {AC/TG} context measured by NMR66 was reported to have two hydrogen bonds, though we determined a Morse potential of only 1.15 meV with stacking interactions of 1.24 eV nm−2 and 1.45 eV nm−2 for,  and
and  . The only context with larger potential has 34.4 meV for {ag/ag}, see Fig. 7b. Stacking interactions are usually not very large, with the notable exception of
  with the extreme value of 71.8 eV nm−2. CG flanked stacking however can be very small as for instance 0.245 eV nm−2 for
  . The measurements by Tibanyenda et al.27 involve a {cg/tt} mismatch, for which we obtained 2.22 meV, but the authors were not conclusive about its hydrogen bonding.
AG
AG mismatches in the context {AC/TG}, for which we obtained 18.8 meV, have been previously studied by X-ray diffraction87–89 and were reported to be in an A(syn).G(anti) or A(anti).G(syn)90 conformation with two hydrogen bonds. In some circumstances a looped out structure has been shown by NMR.91 In another context {CC/GG}, with a Morse potential of 18.2 meV, a double hydrogen bonded A(anti).G(anti) conformation was observed for neutral pH.92 In both cases, the calculated Morse potentials are consistent with a double hydrogen bond. Tandem GA–AG stacking is a very special case, which we will discuss later.
GT
GT mismatches are the only ones where the largest Morse potential {AC/TG}, 17.5 meV, was found in a context in which it is flanked by canonical bases pairs (TtT). Since most studies on mismatches have been performed for this type of context, there is a substantial body of research related to the {AC/TG} mismatch, especially concerning its interaction with mismatch repair enzymes such as MutS.6,93 X-ray diffraction94 and NMR83,95–98 established the existence of two hydrogen bonds which seems consistent with the Morse potential of 17.5 meV found for this GT context. The {AC/TG} context also has some large stacking interactions depending on its neighbours. For instance for the step  we found 6.72 eV nm−2. This step occurs in the sequences used by Isaacs and Spielmann97 and the average displacement profile is shown in Fig. 10 where we also show the corresponding canonical profile. Fig. 10 bears some qualitative similarities to the helical parameters calculated from the molecular dynamics trajectories from Isaacs and Spielmann,97 see Fig. 5 of ref. 97. They also noted that in sequences containing GT, all base pairs display lower kinetic stability resulting in larger displacements than their canonical counterparts, which we also observe in Fig. 10. The large stacking of step
  correlates with a larger stacking overlap seen in the structure of this sequence, shown in Fig. S9.† Apart from {AC/TG}, all remaining contexts show Morse potentials that are in the range of 5–10 meV, though stacking interactions can be as high as 37.6 meV nm−2 for
  . An important occurrence of GT mismatches in genomic DNA, is the deamination of 5-methylcytosine, which are repaired by thymine DNA glycosylase (TDG) through base excision.99 The repair efficiency of TDG depends on the 5′ base pair flanking GT, which is much lower for neighbouring AT base pairs on the 5′ side.16–18 This is the context {AC/TG} with highest Morse potential depth, suggesting that a stronger hydrogen bonding could play a role in slowing the TDG repair activity.
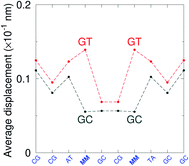 |
| | Fig. 10 Average displacements for sequences with GTal mismatches {AC/TG} (red curves) and corresponding canonical base pairs (dark grey curves). The calculation was carried out at 180 K, which has no relation to the melting temperatures. Sequences from ref. 97. | |
Double mismatches
There are not many experimental studies concerning the structure of double mismatches. One of them100 reports on consecutive GG and CC mismatches in the contexts {Ac/Tc} and {Ag/Tg}, which have Morse potentials of 4.21 meV and 0.800 meV, respectively. For this sequence, the stacking interactions are also very small 0.293 meV nm−2 for steps  . The molecular dynamics for this particular case suggested100 that the mismatched base pairs rearranged to gain stability through hydrogen bonding and increased stacking. In particular it was observed that GG base pairs interact with one of the C bases of the adjacent CC mismatch, in a hydrogen bonding triad.100 The extremely low Morse and stacking potentials involving the CC mismatch suggest that there is no interaction between the two C bases in this situation.
Sheared stacking
Sheared stacking was observed in some tandem mismatches, especially for GA–AG, for which there are numerous reports of this type of strong stacking.29,31,33,34,101–106 X-ray diffraction experiments showed that this tandem step involves extensive intra-strand stacking.104 Thermodynamic analysis using a continuum electrostatic model, has shown a very favourable Gibbs free energy in a sheared configuration.107 For the context independent (CI) calculation we had a large stacking potential of 17.3 eV nm−2 for GA–AG steps. In comparison, values for canonical steps are in the range of 2–4 eV nm−2. This becomes even larger for the CD calculations, with the largest stacking of 35.2 eV nm−2 for  . The Morse potentials in this case are of moderate intensity, 16.3 meV for both context groups, see also Fig. 7. A stacking stability of this magnitude was not observed in our previous work. Until now, the largest stacking potential found with the mesoscopic model was 12.5 eV nm−2 for inosine–guanosine stacked onto CG, which was correlated to its inosine(syn)–guanosine(anti) configuration.48 A very large stacking potential suggests a correlation with the sheared G(anti)–A(anti) configuration in which they are often observed.108,109 For the
  context, for which the sheared stacking has been observed by NMR,102 we obtained 17.3 eV nm−2. We determined a value of 25.4 eV nm−2 for
  for which sheared stacking has been observed in X-ray diffraction.110 For
  the value was 18.3 eV nm−2.111 GA–AA mismatches with sheared stacking have been observed in quadruple mismatches,112 involving the context
  , with moderately increased stacking of 6.84 eV nm−2. AA–AA mismatches were also reported in this work,112 however these were in a context that is not covered by the CD type parameters. For the CI parameters we obtained a stacking parameter of 9.23 eV nm−2.
While the stacking potential of the GA–AG double mismatch is very large, it is not the largest. The largest stacking was 71.8 eV nm−2, for  , which suggest that a similar sheared stacking might be taking place. A considerable number of double mismatches resulted in a stacking potential of the magnitude as that of observed for GA–AG. In ESI Table S3† we highlight all stacking parameters that exceed their average values by twice the standard deviation, which may be useful as candidate sequences for further experimental studies. However we are not aware of any experimental results for this or other mismatch configurations with large stacking parameters. Note that there is also a substantial number of very low stacking potentials as for instance AA–CC, CC–TT and CA–GC.
Triple mismatches
In our results, certain configurations of triple mismatches stand out with the highest Morse potentials, see Fig. 6 and 7. The sole exception is for GT where the highest Morse potential is for the {AC/TG}. For six type of mismatches, AA, CC, GG, CT and AG this corresponds to triplet transversions (vvv), and for TT a mixed triplet mismatch of type tvv. For AC, a transition mismatch, the three highest are flanked by transversions (vtv). To our knowledge, this unexpected pattern of triple transversions, presenting such large Morse potentials and hence a likely strong hydrogen bonding has not previously been reported. We not are aware of any experimental studies with these triplet mismatches, with which we could cross-correlate our findings.
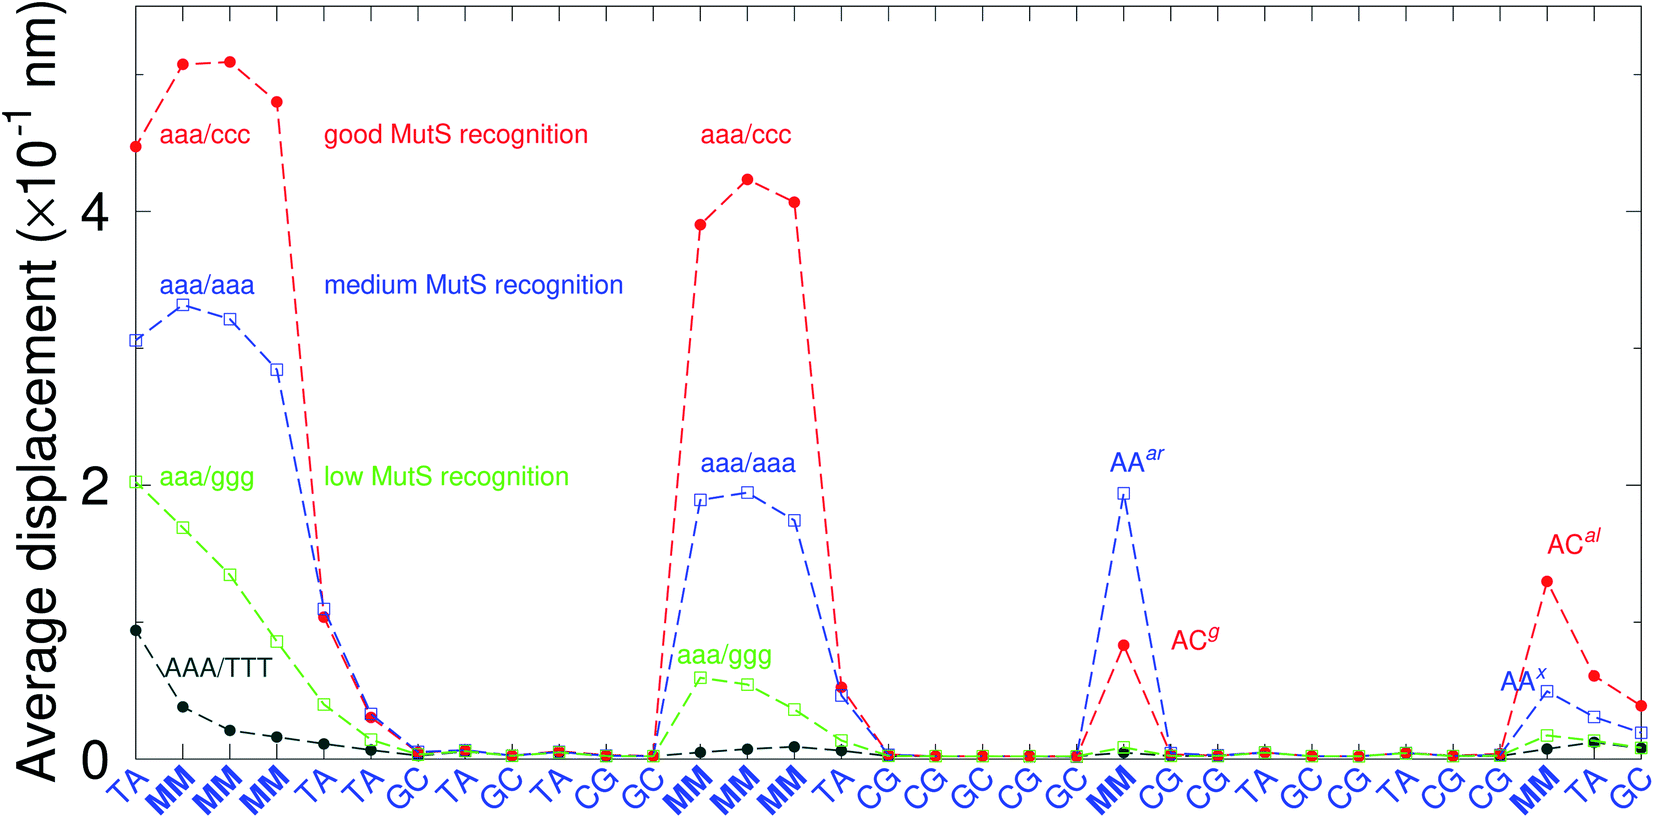
There have been a few experimental studies on binding affinities for some types of triple mismatches where the affinity is dependent on the mismatch stability. Using the average displacement for specific sequences it is possible to attempt to correlate those to the reported binding affinities. Tests on Rad4 nucleotide excision repair complex, that recognizes diverse DNA lesions,11,113 is one of very few studies comparing the binding efficiency of different triplet mismatches, ccc/ccc, tat/tat and ttt/ttt. Fig. 11 shows the average displacement profiles for these three mismatches, with higher Rad4 binding specificity correlating to larger opening profiles. Triplet mismatches have also been studied with MutS recognition, for which it was found that certain types of mismatches are better recognized than others.14 In Fig. 12 we show a few examples containing triplet mismatches using the sequences from ref. 14. The best recognition was for AC triplets with very low Morse potentials of 1.43 meV, while poorest recognition was for AG triplet mismatches with moderate Morse potentials around 15.9 meV. Therefore, similarly to the Rad4 binding affinities, better MutS recognition appears to be correlated to larger hydrogen bond displacements and lower Morse potentials.
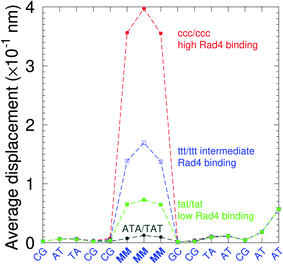 |
| | Fig. 11 Average displacements of the sequences with central triple mismatches, ccc/ccc (red bullets), ttt/ttt (blue squares), tat/tat (green boxes) and their reported Rad4 binding specificities.11 For comparison, a sequence without a mismatch is also shown (grey bullets). The calculation was carried out at 150 K, which has no relation to the melting temperatures. Sequences are TGACTCGACATCCMMMGCTACAA/ACTGAGCTGTAGGCMMMGATGTT based on ref. 11 and, only the central part around the mismatched region MMM/MMM is shown. | |
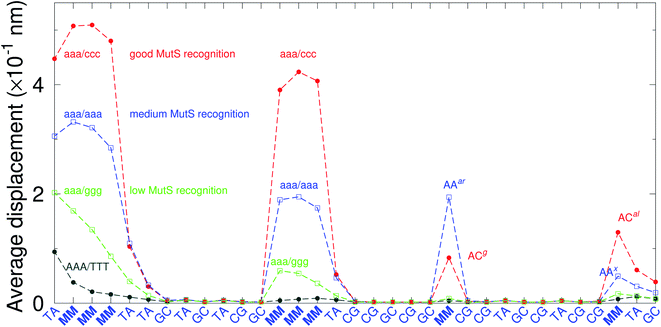 |
| | Fig. 12 Average displacements of the sequences with triple mismatches, aaa/ccc (red bullets), aaa/aaa (blue squares), aaa/ggg (green boxes) and their reported MutS recognition.14 For comparison, a sequence without a mismatch is also shown (grey bullets). The calculation was carried out at 150 K, which has no relation to the melting temperatures. Sequences used are K (red bullets), L (blue squares), M (green boxes) and WT (grey bullets), from Table 1 of ref. 14. | |
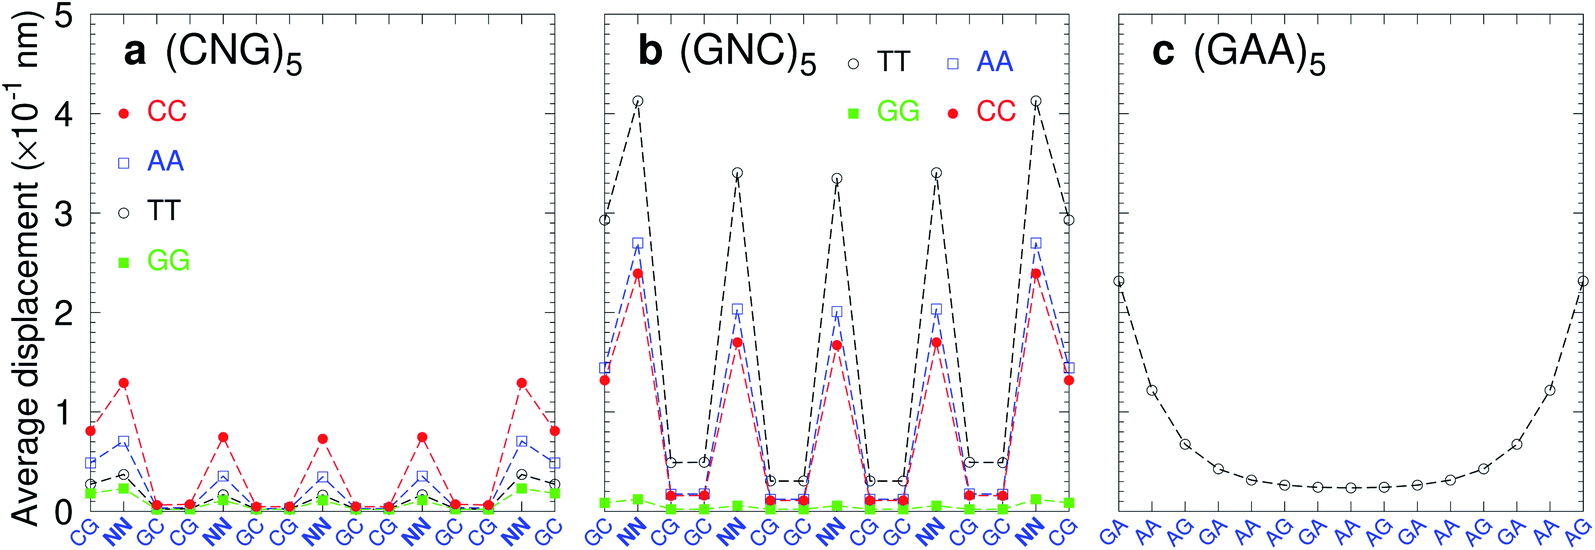
Trinucleotide repeat expansions are an important source of inherited neurological diseases, mostly formed by repetitions of type (CNG)n, with N = A, C, G or T, which may form DNA hairpins with central NN mismatches.114,115 Interestingly, repeats of (GNC)5 are less frequent or completely absent in genomic DNA.115,116 In Fig. 13a we show the average displacement profiles for (CNG)5 which are generally very stable with small strand displacements at the mismatch positions. The stability trends of (CNG)n are the same as observed in other melting experiments.117–119 However, for (GNC)5 repeats with N = A, C, or T, Fig. 13b, the displacements are very large. The exception is (GGC)5 (N = G) with very low displacements, and which is known to form stable hairpins.120 Another important type of trinucleotide repeat is (GAA)n,114 shown in Fig. 13c for n = 5, which is calculated with CI-type parameters, as our CD parameters do not cover the mismatch context for this particular sequence. In this case, the central part of the sequence is stabilised by the large stacking interaction of the AA–AG step with 8.37 eV nm−2 (CI), therefore it is possible that this repeat may form stable hairpins.117 Our stability results for the trinucleotide repeats appear to be consistent with their presence in genomic DNA when the repeat has low displacements, and its absence in case of highly unstable mismatches with large displacements.
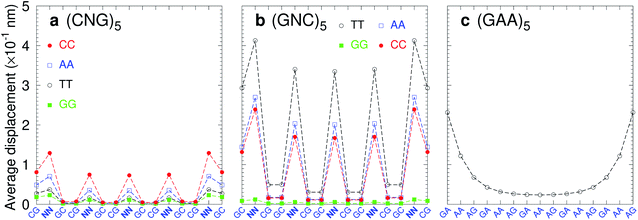 |
| | Fig. 13 Average displacements of tandem trinucleotide repeats of type (a) (CNG)5 and (b) (GNC)5, with central mismatches AA (blue boxes), CC (red bullets), GG (green boxes) and TT (black circles). Panel (c) shows repeats of type (GAA)5 formed solely of mismatches calculated with CI parameters. The calculation was carried out at 150 K, which has no relation to the melting temperatures. | |
Conclusion
We have measured and analysed mismatches in all nearest-neighbour and next-nearest-neighbour configurations under the same experimental conditions. The melting temperatures were used in a mesoscopic model which considered simultaneously 4096 sequences and calculated 440 Morse potentials and 3084 stacking interactions. The results allow the comparison of the properties between any type of mismatch, under the same experimental conditions and within the same theoretical framework.
The majority of the measured melting temperatures confirmed the destabilizing nature of mismatches, however a substantial 15% of single mismatches had higher melting temperatures than the least stable canonical AT base pair, a finding that has important implications for applications such as PCR primer and probe design.121 The mesoscopic calculation, used for interpretation of the measured melting temperatures, revealed a number of unexpected results. One of these is the common occurrence of stable mismatches, when they are flanked on both sides by other mismatches. In several tandem configurations we found very large stacking interaction potentials. This happens for the well known GA–AG tandem mismatch which presents a sheared stacking configuration. From our results, we speculate that there may be other tandem mismatches that possess this unusual stacking configuration. In most cases, the Morse potentials which represent the hydrogen bonds in the model, correlate with known hydrogen bond configurations from NMR or X-ray diffraction studies. However, for CT mismatches we obtained very low Morse potentials which are at odds with the double hydrogen bond configurations that were reported elsewhere. The reasons for the discrepancy with this particular mismatch are unclear. For triple mismatches we found good correlations with Rad4 binding affinities and MutS recognition which suggests that our results could be used for a more extensive analysis of this kind. Another potential application is for understanding the stability of trinucleotide repeats, such as (CNG)n and (GNC)n, which appears to correlate with its frequency in genomic DNA.
Conflicts of interest
There are no conflicts to declare.
Abbreviations
| PB | Peyrard–Bishop |
| NMR | Nuclear magnetic resonance |
| NN | Nearest-neighbour |
| BP | Base pair |
| MD | Molecular dynamics |
| SNP | Single-nucleotide polymorphism |
Acknowledgements
L. O. Oliveira and G. Weber acknowledge support by Fundação de Amparo a Pesquisa do Estado de Minas Gerais (Fapemig, Brazil); Conselho Nacional de Desenvolvimento Científico e Tecnológico (CNPq, Brazil) and Coordenação de Aperfeiçoamento de Nível Superior (Capes, Brazil). Adam S. Long acknowledges funding and support by The Forensic Science Service®, Solihull Parkway, Birmingham Business Park, Birmingham, B37 7YN, UK.
References
- T. S. Hall, P. Pancoska, P. V. Riccelli, K. Mandell and A. S. Benight, J. Am. Chem. Soc., 2001, 123, 11811–11812 CrossRef CAS PubMed.
- B. Liu, Q. Xue, Y. Tang, J. Cao, F. P. Guengerich and H. Zhang, Mutat. Res., Rev. Mutat. Res., 2016, 768, 53–67 CrossRef CAS PubMed.
- J. Yang, B. Li, X. Liu, H. Tang, X. Zhuang, M. Yang, Y. Xu, H. Zhang and C. Yang, Biochem. Biophys. Res. Commun., 2018, 496, 1076–1081 CrossRef CAS PubMed.
- J. A. Law and S. E. Jacobsen, Nat. Rev. Genet., 2010, 11, 204–220 CrossRef CAS PubMed.
- Z. Li, A. H. Pearlman and P. Hsieh, DNA Repair, 2016, 38, 94–101 CrossRef CAS PubMed.
- M. H. Lamers, A. Perrakis, J. H. Enzlin, H. H. K. Winterwerp, N. de Wind and T. K. Sixma, Nature, 2000, 407, 711–717 CrossRef CAS PubMed.
- J. Brown, T. Brown and K. R. Fox, Biochem. J., 2001, 354, 627 CrossRef CAS PubMed.
- P. D. Hoffman, H. Wang, C. W. Lawrence, S. Iwai, F. Hanaoka and J. B. Hays, DNA Repair, 2005, 4, 983–993 CrossRef CAS PubMed.
- A. Mazurek, C. N. Johnson, M. Germann and R. Fishel, Proc. Natl. Acad. Sci. U. S. A., 2009, 106, 4177–4182 CrossRef CAS PubMed.
- J. Zhai and M. M. Hingorani, Proc. Natl. Acad. Sci. U. S. A., 2010, 107, 680–685 CrossRef CAS PubMed.
- S. Chakraborty, P. J. Steinbach, D. Paul, H. Mu, S. Broyde, J.-H. Min and A. Ansari, Nucleic Acids Res., 2017, 46, 1240–1255 CrossRef PubMed.
- T. Harmsen, S. Klaasen, H. van de Vrugt and H. te Riele, Nucleic Acids Res., 2018, 46, 2945–2955 CrossRef CAS PubMed.
- A. Granzhan, N. Kotera and M.-P. Teulade-Fichou, Chem. Soc. Rev., 2014, 43, 3630–3665 RSC.
- A. Joshi and B. J. Rao, J. Biosci., 2001, 26, 595–606 CrossRef CAS PubMed.
- N. Nag, B. Rao and G. Krishnamoorthy, J. Mol. Biol., 2007, 374, 39–53 CrossRef CAS PubMed.
- Sibghat-Ullah, P. Gallinari, Y.-Z. Xu, M. F. Goodman, L. B. Bloom, J. Jiricny and R. S. Day, Biochemistry, 1996, 35, 12926–12932 CrossRef CAS PubMed.
- T. R. Waters and P. F. Swann, J. Biol. Chem., 1998, 273, 20007 CrossRef CAS PubMed.
- M. E. Fitzgerald and A. C. Drohat, J. Biol. Chem., 2008, 283, 32680–32690 CrossRef CAS PubMed.
- G. Weber, N. Haslam, N. Whiteford, A. Prügel-Bennett, J. W. Essex and C. Neylon, Nat. Phys., 2006, 2, 55–59 Search PubMed.
- G. Weber, J. W. Essex and C. Neylon, Nat. Phys., 2009, 5, 769–773 Search PubMed.
- H. T. Allawi and J. SantaLucia Jr, Biochemistry, 1997, 36, 10581–10594 CrossRef CAS PubMed.
- H. T. Allawi and J. SantaLucia Jr, Biochemistry, 1998, 37, 9435–9444 CrossRef CAS PubMed.
- H. Allawi and J. SantaLucia Jr, Biochemistry, 1998, 37, 2170–2179 CrossRef CAS PubMed.
- N. Peyret, P. A. Seneviratne, H. T. Allawi and J. SantaLucia Jr, Biochemistry, 1999, 38, 3468–3477 CrossRef CAS PubMed.
- J. Hooyberghs, P. Van Hummelen and E. Carlon, Nucleic Acids Res., 2009, 37, e53 CrossRef CAS PubMed.
- S. Mishra, S. Ghosh and R. Mukhopadhyay, Anal. Chem., 2013, 85, 1615–1623 CrossRef CAS PubMed.
- N. Tibanyenda, S. H. De Bruin, C. A. Haasnoot, G. A. van der Marel, J. H. van Boom and C. W. Hilbers, Eur. J. Biochem., 1984, 139, 19–27 CrossRef CAS PubMed.
- F. Aboul-Ela, D. Koh, I. Tinoco Jr and F. H. Martin, Nucleic Acids Res., 1985, 13, 4811–4824 CrossRef CAS PubMed.
- Y. Li, G. Zon and W. D. Wilson, Biochemistry, 1991, 30, 7566–7572 CrossRef CAS.
- H. Werntges, G. Steger, D. Riesner and H.-J. Fritz, Nucleic Acids Res., 1986, 14, 3773–3790 CrossRef CAS PubMed.
- S. Ebel, A. N. Lane and T. Brown, Biochemistry, 1992, 31, 12083–12086 CrossRef CAS PubMed.
- F. H. Arnold, S. Wolk, P. Cruz and I. Tinoco Jr, Biochemistry, 1987, 26, 4068–4075 CrossRef CAS PubMed.
- Y. Li and S. Agrawal, Biochemistry, 1995, 34, 10056–10062 CrossRef CAS PubMed.
- S.-H. Ke and R. M. Wartell, Nucleic Acids Res., 1996, 24, 707–712 CrossRef CAS PubMed.
- S. Lokhov and D. Pyshnyi, FEBS Lett., 1997, 420, 134–138 CrossRef CAS PubMed.
- M. B. Arghavani, J. SantaLucia and L. J. Romano, Biochemistry, 1998, 37, 8575–8583 CrossRef CAS PubMed.
- J. C. Morales and E. T. Kool, Biochemistry, 2000, 39, 2626–2632 CrossRef CAS PubMed.
- K. Nakatani, S. Sando and I. Saito, Nat. Biotechnol., 2001, 19, 51–55 CrossRef CAS.
- N. W. Schlientz and G. B. Schuster, J. Am. Chem. Soc., 2003, 125, 15732–15733 CrossRef CAS PubMed.
- I. S. Joung, Ö. Persil Çetinkol, N. V. Hud and T. E. Cheatham III, Nucleic Acids Res., 2009, 37, 7715–7727 CrossRef CAS PubMed.
- Y. Teng, S. Pramanik, H. Tateishi-Karimata, T. Ohyama and N. Sugimoto, Biochem. Biophys. Res. Commun., 2018, 496, 601–607 CrossRef CAS PubMed.
- A. Tikhomirova, N. Taulier and T. V. Chalikian, J. Am. Chem. Soc., 2004, 126, 16387–16394 CrossRef CAS PubMed.
- A. Tikhomirova, I. V. Beletskaya and T. V. Chalikian, Biochemistry, 2006, 45, 10563–10571 CrossRef CAS PubMed.
- S. Alemayehu, D. J. Fish, G. P. Brewood, M. T. Horne, F. Manyanga, R. Dickman, I. Yates and A. S. Benight, J. Phys. Chem. B, 2009, 113, 2578–2586 CrossRef CAS PubMed.
- M. Peyrard and A. R. Bishop, Phys. Rev. Lett., 1989, 62, 2755–2757 CrossRef CAS PubMed.
- G. Weber, Nucleic Acids Res., 2013, 41, e30 CrossRef CAS PubMed.
- T. D. Amarante and G. Weber, J. Chem. Inf. Model., 2016, 56, 101–109 CrossRef CAS PubMed.
- R. V. Maximiano and G. Weber, Chem. Phys. Lett., 2015, 631–632, 87–91 CrossRef CAS.
- E. d. O. Martins, V. B. Barbosa and G. Weber, Chem. Phys. Lett., 2019, 715, 14–19 CrossRef.
- Y.-L. Zhang, W.-M. Zheng, J.-X. Liu and Y. Z. Chen, Phys. Rev. E: Stat. Phys., Plasmas, Fluids, Relat. Interdiscip. Top., 1997, 56, 7100–7115 CrossRef CAS.
- G. Weber, N. Haslam, J. W. Essex and C. Neylon, J. Phys.: Condens. Matter, 2009, 21, 034106 CrossRef PubMed.
- G. Weber, Bioinformatics, 2013, 29, 1345–1347 CrossRef CAS PubMed.
- R. A. Darby, M. Sollogoub, C. McKeen, L. Brown, A. Risitano, N. Brown, C. Barton, T. Brown and K. R. Fox, Nucleic Acids Res., 2002, 30, e39 CrossRef PubMed.
- P. Modrich and R. Lahue, Annu. Rev. Biochem., 1996, 65, 101–133 CrossRef CAS PubMed.
- G. Rossetti, P. D. Dans, I. Gomez-Pinto, I. Ivani, C. Gonzalez and M. Orozco, Nucleic Acids Res., 2015, 43, 4309–4321 CrossRef CAS PubMed.
- K. Astakhova, Chemosensors, 2014, 2, 193–206 CrossRef.
- T. Yamada, T. Iwai, G. Takahashi, H. Kan, M. Koizumi, A. Matsuda, S. Shinji, A. Yamagishi, Y. Yokoyama and A. Tatsuguchi, Cancer Sci., 2016, 107, 936–943 CrossRef CAS PubMed.
- S. C. van der Lubbe and C. Fonseca Guerra, Chem.–Eur. J., 2017, 23, 10249–10253 CrossRef CAS PubMed.
- N. Singh and Y. Singh, Phys. Rev. E: Stat., Nonlinear, Soft Matter Phys., 2001, 64, 042901 CrossRef CAS PubMed.
- A. Singh and N. Singh, Phys. Rev. E: Stat., Nonlinear, Soft Matter Phys., 2015, 92, 032703 CrossRef PubMed.
- V. Gervais, J. A. Cognet, M. Le Bret, L. C. Sowers and G. V. Fazakerley, Eur. J. Biochem., 1995, 228, 279–290 CrossRef CAS PubMed.
- C. Lee, H.-K. Cheong, J.-H. Cho and C. Cheong, J. Anal. Sci. Technol., 2010, 1, 37–48 CrossRef CAS.
- K. Maskos, B. M. Gunn, D. A. LeBlanc and K. M. Morden, Biochemistry, 1993, 32, 3583–3595 CrossRef CAS PubMed.
- M. Kouchakdjian, B. F. Li, P. F. Swann and D. J. Patel, J. Mol. Biol., 1988, 202, 139–155 CrossRef CAS PubMed.
- K. S. Ng and S. L. Lam, J. Magn. Reson., 2015, 252, 87–93 CrossRef CAS PubMed.
- Y. Boulard, J. Cognet and G. Fazakerley, J. Mol. Biol., 1997, 268, 331–347 CrossRef CAS PubMed.
- V. A. Roongta, C. R. Jones and D. G. Gorenstein, Biochemistry, 1990, 29, 5245–5258 CrossRef CAS PubMed.
- A. N. Lane and B. Peck, Eur. J. Biochem., 1995, 230, 1073–1087 CrossRef CAS PubMed.
- P. K. Bhattacharya, J. Cha and J. K. Barton, Nucleic Acids Res., 2002, 30, 4740–4750 CrossRef CAS PubMed.
- K. L. Borden, T. C. Jenkins, J. V. Skelly, T. Brown and A. N. Lane, Biochemistry, 1992, 31, 5411–5422 CrossRef CAS PubMed.
- V. Faibis, J. A. Cognet, Y. Boulard, L. C. Sowers and G. V. Fazakerley, Biochemistry, 1996, 35, 14452–14464 CrossRef CAS PubMed.
- J. Cognet, J. Gabarro-Arpa, M. L. Bret, G. v. d. Marel, J. v. Boom and G. Fazakerley, Nucleic Acids Res., 1991, 19, 6771–6779 CrossRef CAS PubMed.
- J. V. Skelly, K. J. Edwards, T. C. Jenkins and S. Neidle, Proc. Natl. Acad. Sci. U. S. A., 1993, 90, 804–808 CrossRef CAS PubMed.
- R. Satange, C.-Y. Chuang, S. Neidle and M.-H. Hou, Nucleic Acids Res., 2019, 47, 8899–8912 CrossRef CAS PubMed.
- T. G. Gantchev, S. Cecchini and D. J. Hunting, J. Mol. Model., 2005, 11, 141–159 CrossRef CAS PubMed.
- G. He, C. K. Kwok and S. L. Lam, FEBS Lett., 2011, 585, 3953–3958 CrossRef CAS PubMed.
- D. J. Patel, S. A. Kozlowski, S. Ikuta and K. Itakura, Biochemistry, 1984, 23, 3218–3226 CrossRef CAS PubMed.
- W. N. Hunter, T. Brown, N. N. Anand and O. Kennard, Nature, 1986, 320, 552–555 CrossRef CAS PubMed.
- X. Gao and D. Patel, J. Biol. Chem., 1987, 262, 16973–16984 CAS.
- M. H. Sarma, G. Gupta, R. H. Sarma, R. Bald, U. Engelke, S. L. Oei, R. Gessner and V. A. Erdmann, Biochemistry, 1987, 26, 7707–7715 CrossRef CAS PubMed.
- M. Kalnik, M. Kouchakdjian, B. F. Li, P. F. Swann and D. J. Patel, Biochemistry, 1988, 27, 100–108 CrossRef CAS PubMed.
- C. Wang, H. Gao, B. L. Gaffney and R. A. Jones, J. Am. Chem. Soc., 1991, 113, 5486–5488 CrossRef CAS.
- S. R. Bhaumik and K. V. Chary, J. Biomol. Struct. Dyn., 2002, 20, 199–206 CrossRef CAS PubMed.
- C. Fonseca Guerra, F. Bickelhaupt, S. Saha and F. Wang, J. Phys. Chem. A, 2006, 110, 4012–4020 CrossRef CAS PubMed.
- J. Basumatary, B. Bezbaruah, R. Kalita, T. K. Barman and C. Medhi, J. Theor. Comput. Chem., 2017, 16, 1750027 CrossRef CAS.
- O. O. Brovarets' and D. M. Hovorun, J. Comput. Chem., 2013, 34, 2577–2590 CrossRef PubMed.
- O. Kennard, J. Biomol. Struct. Dyn., 1985, 3, 205–226 CrossRef CAS PubMed.
- W. N. Hunter, T. Brown and O. Kennard, J. Biomol. Struct. Dyn., 1986, 4, 173–191 CrossRef CAS PubMed.
- G. A. Leonard, E. D. Booth and T. Brown, Nucleic Acids Res., 1990, 18, 5617–5623 CrossRef CAS PubMed.
- T. Brown, G. A. Leonard, E. D. Booth and J. Chambers, J. Mol. Biol., 1989, 207, 455–457 CrossRef CAS.
- G. Fazakerley, E. Quignard, A. Woisard, W. Guschlbauer, G. Van der Marel, J. Van Boom, M. Jones and M. Radman, EMBO J., 1986, 5, 3697–3703 CrossRef CAS PubMed.
- X. Gao and D. J. Patel, J. Am. Chem. Soc., 1988, 110, 5178–5182 CrossRef CAS.
- L. E. Sass, C. Lanyi, K. Weninger and D. A. Erie, Biochemistry, 2010, 49, 3174–3190 CrossRef CAS PubMed.
- W. N. Hunter, T. Brown, G. Kneale, N. N. Anand, D. Rabinovich and O. Kennard, J. Biol. Chem., 1987, 262, 9962–9970 CAS.
- M. W. Kalnik, M. Kouchakdjian, B. F. Li, P. F. Swann and D. J. Patel, Biochemistry, 1988, 27, 108–115 CrossRef CAS PubMed.
- R. J. Isaacs, W. S. Rayens and H. P. Spielmann, J. Mol. Biol., 2002, 319, 191–207 CrossRef CAS PubMed.
- R. J. Isaacs and H. P. Spielmann, J. Am. Chem. Soc., 2004, 126, 583–590 CrossRef CAS PubMed.
- P. Várnai, M. Canalia and J. L. Leroy, J. Am. Chem. Soc., 2004, 126, 14659–14667 CrossRef PubMed.
- D. Cortázar, C. Kunz, Y. Saito, R. Steinacher and P. Schär, DNA Repair, 2007, 6, 489–504 CrossRef PubMed.
- A. Ghosh, R. K. Kar, J. Krishnamoorthy, S. Chatterjee and A. Bhunia, ChemMedChem, 2014, 9, 2059–2064 CrossRef CAS PubMed.
- Y. Li, G. Zon and W. D. Wilson, Proc. Natl. Acad. Sci. U. S. A., 1991, 88, 26–30 CrossRef CAS PubMed.
- M. Katahira, H. Sato, K. Mishima, S. Uesugi and S. Fujii, Nucleic Acids Res., 1993, 21, 5418–5424 CrossRef CAS PubMed.
- M. Ortiz-Lombardía, A. Cortés, D. Huertas, R. Eritja and F. Azorín, J. Mol. Biol., 1998, 277, 757–762 CrossRef PubMed.
- Y.-G. Gao, H. Robinson, R. Sanishvili, A. Joachimiak and A. H.-J. Wang, Biochemistry, 1999, 38, 16452–16460 CrossRef CAS PubMed.
- N. Špačková, I. Berger and J. Šponer, J. Am. Chem. Soc., 2000, 122, 7564–7572 CrossRef.
- F. Seela, S. Budow, K. I. Shaikh and A. M. Jawalekar, Org. Biomol. Chem., 2005, 3, 4221–4226 RSC.
- J. Berashevich and T. Chakraborty, J. Chem. Phys., 2009, 130, 015101 CrossRef PubMed.
- J.-W. Cheng, S.-H. Chou and B. R. Reid, J. Mol. Biol., 1992, 228, 1037–1041 CrossRef CAS PubMed.
- K. L. Greene, R. L. Jones, Y. Li, H. Robinson, A. H.-J. Wang, G. Zon and W. D. Wilson, Biochemistry, 1994, 33, 1053–1062 CrossRef CAS PubMed.
- G. G. Privé, K. Yanagi and R. E. Dickerson, J. Mol. Biol., 1991, 217, 177–199 CrossRef.
- S. H. Chou, J. W. Cheng, O. Y. Fedorov, V. P. Chuprina and B. R. Reid, J. Am. Chem. Soc., 1992, 114, 3114–3115 CrossRef CAS.
- W. Shepard, W. B. Cruse, R. Fourme, E. de la Fortelle and T. Prangé, Structure, 1998, 6, 849–861 CrossRef CAS PubMed.
- Y. Velmurugu, X. Chen, P. S. Sevilla, J.-H. Min and A. Ansari, Proc. Natl. Acad. Sci. U. S. A., 2016, 113, E2296–E2305 CrossRef CAS PubMed.
- H. T. Orr and H. Y. Zoghbi, Annu. Rev. Neurosci., 2007, 30, 575–621 CrossRef CAS PubMed.
- A. R. La Spada and J. P. Taylor, Nat. Rev. Genet., 2010, 11, 247–258 CrossRef CAS PubMed.
- P. Kozlowski, M. de Mezer and W. J. Krzyzosiak, Nucleic Acids Res., 2010, 38, 4027–4039 CrossRef CAS PubMed.
- M. Mitas, Nucleic Acids Res., 1997, 25, 2245–2253 CrossRef CAS PubMed.
- A. M. Paiva and R. D. Sheardy, Biochemistry, 2004, 43, 14218–14227 CrossRef CAS PubMed.
- J. Huang and S. Delaney, J. Phys. Chem. B, 2016, 120, 4195–4203 CrossRef CAS.
- S. Santhana Mariappan, P. Catasti, X. Chen, R. Ratliff, R. K. Moyzis, E. Morton Bradbury and G. Gupta, Nucleic Acids Res., 1996, 24, 784–792 CrossRef.
- R. Stadhouders, S. D. Pas, J. Anber, J. Voermans, T. H. Mes and M. Schutten, J. Mol. Diagn., 2010, 12, 109–117 CrossRef CAS PubMed.
Footnotes |
| † Electronic supplementary information (ESI) available: All sequences and melting temperatures used in this work are given in Table S1. Tables S4 and S5 show Morse and stacking potentials, respectively, for canonical base pairs and context independent mismatches. Context groups are given in Table S2. Context dependent Morse and stacking potentials are shown in Tables S6 and S3, respectively. Fig. S1–S8 show the context dependent Morse potentials for mismatches. Fig. S9 shows some stacking steps of the sequence from ref. 96. See DOI: 10.1039/d0sc01700k |
| ‡ Present address RNA Biology of Fungal Pathogens Unit, Department of Mycology, Pasteur Institute, France. |
| § Present Address: School of Human Sciences, University of Derby, Kedleston Road, Derby, DE22 1GB, UK. |
|
| This journal is © The Royal Society of Chemistry 2020 |
Click here to see how this site uses Cookies. View our privacy policy here. 
 Open Access Article
 This Open Access Article is licensed under a Creative Commons Attribution-Non Commercial 3.0 Unported Licence
 a,
Adam S.
Long§
a,
Adam S.
Long§
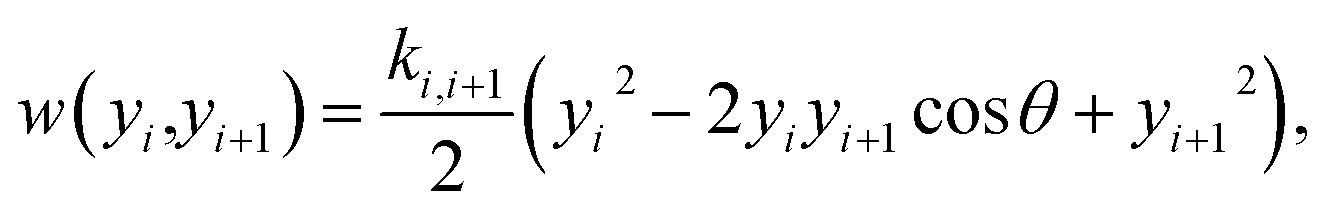


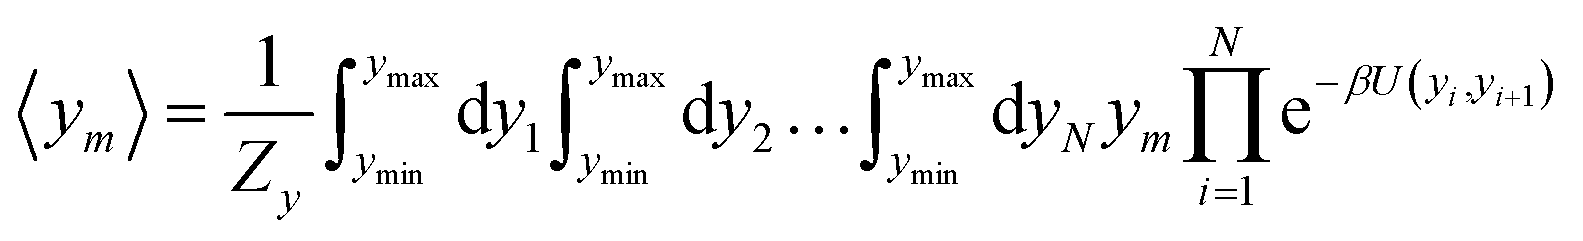
 , resulting from the tentative set of parameters P, is then obtained from the following linear equation,
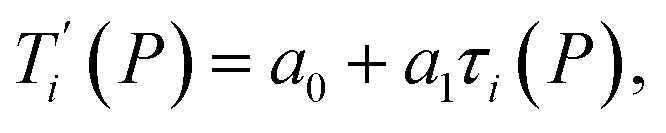
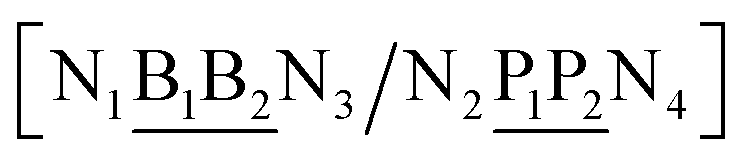
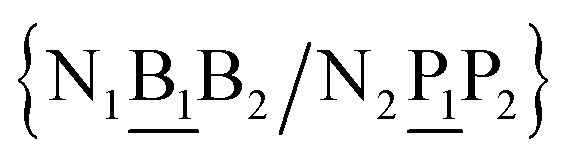 and
and 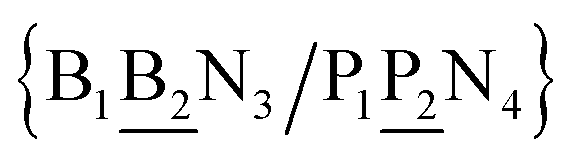 . In this way, the 440 different BP groups result in 3084 NN context groups. The NN groups will be represented in square brackets, underlining two base pairs to distinguish them from the BP group notation. For example,
 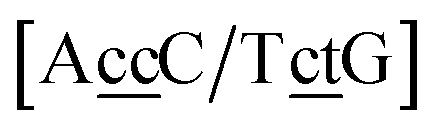 refers to the intersection of the {A
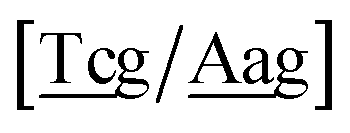 for ACau–AT. Note that the group
  does not contain all trimer of ACau {A
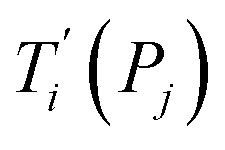 , eqn (6), and compared them to the experimental temperatures Ti. The model parameters (Pj) were then varied until we minimized the squared differences
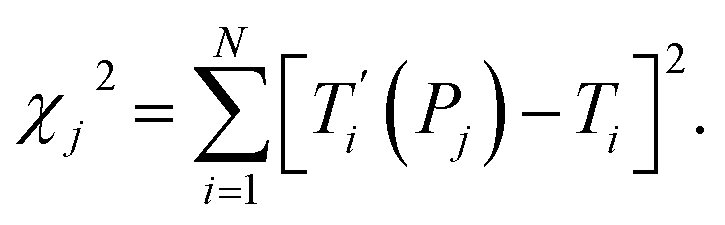
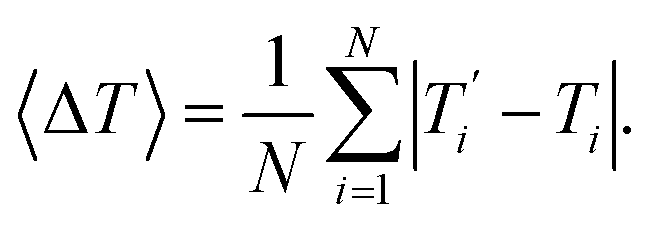
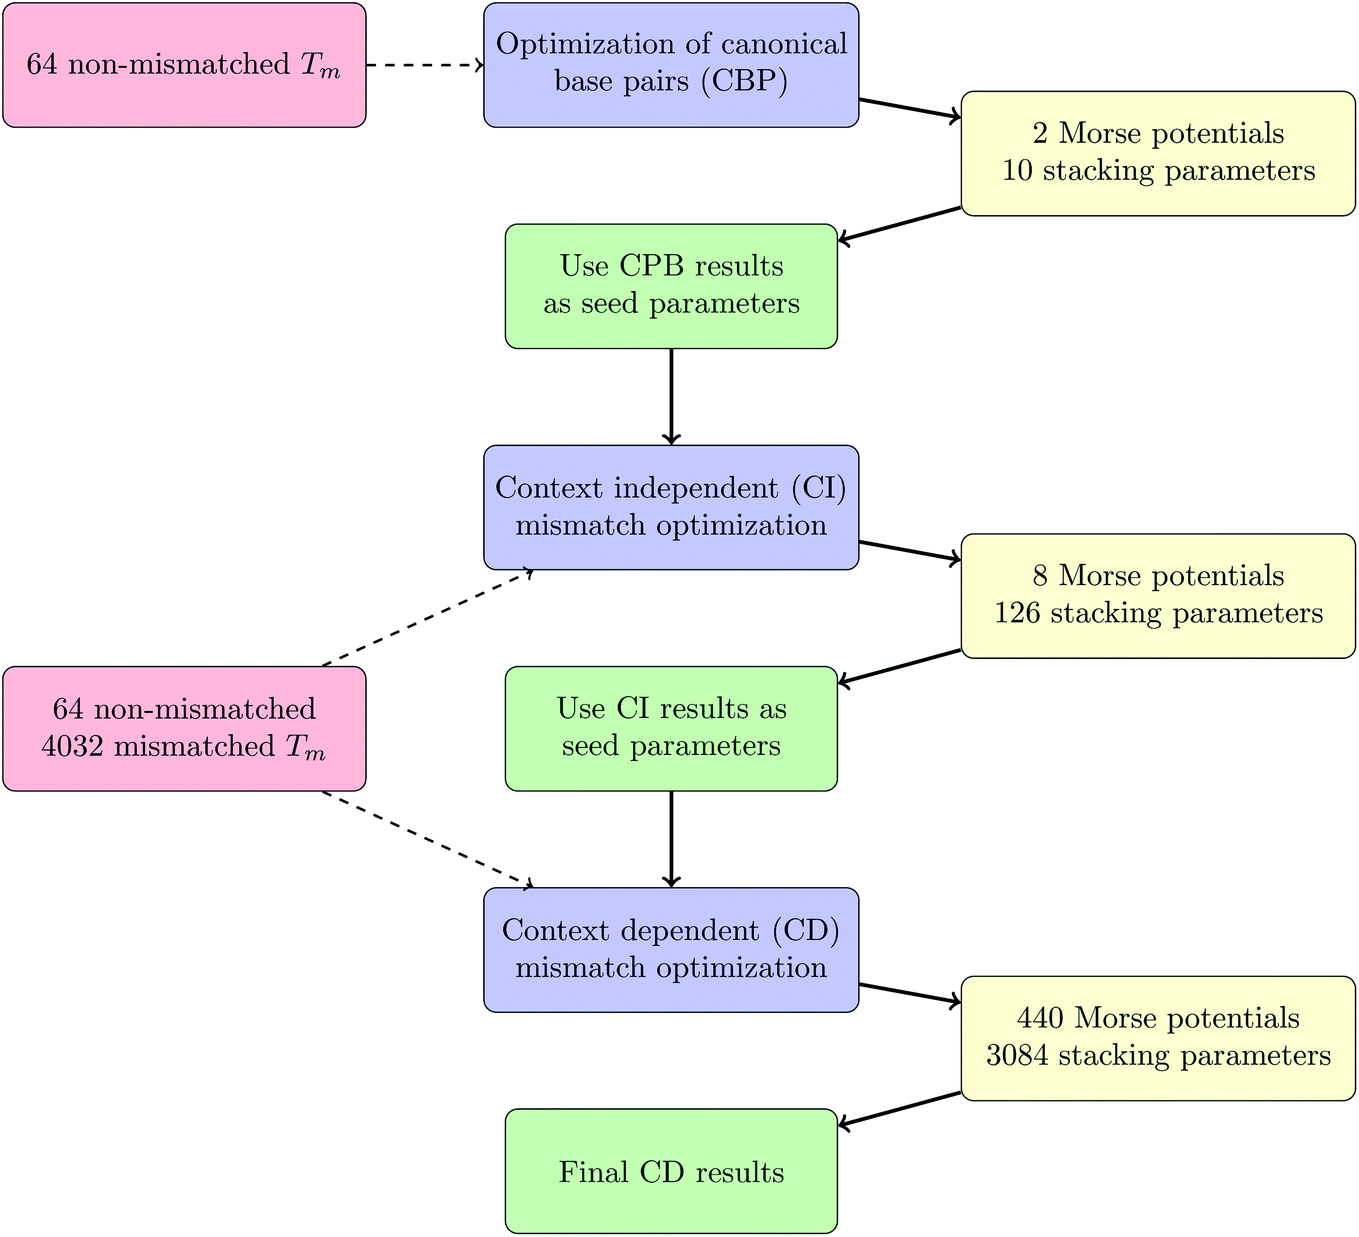
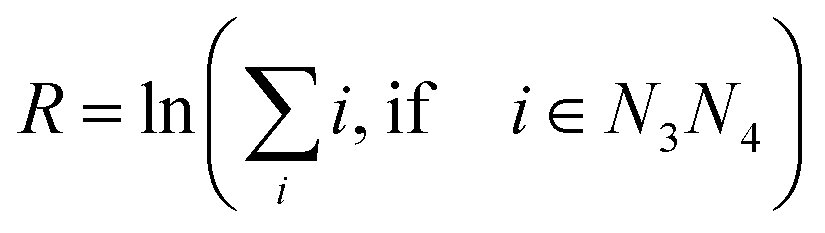


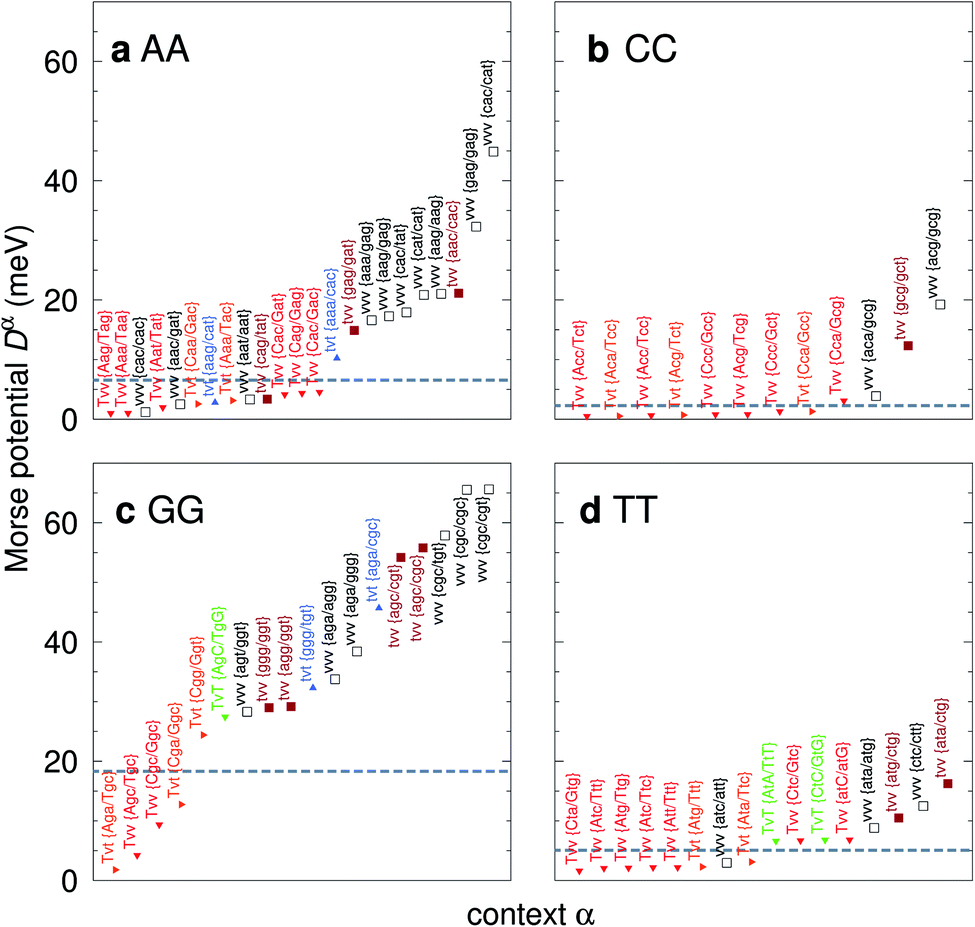
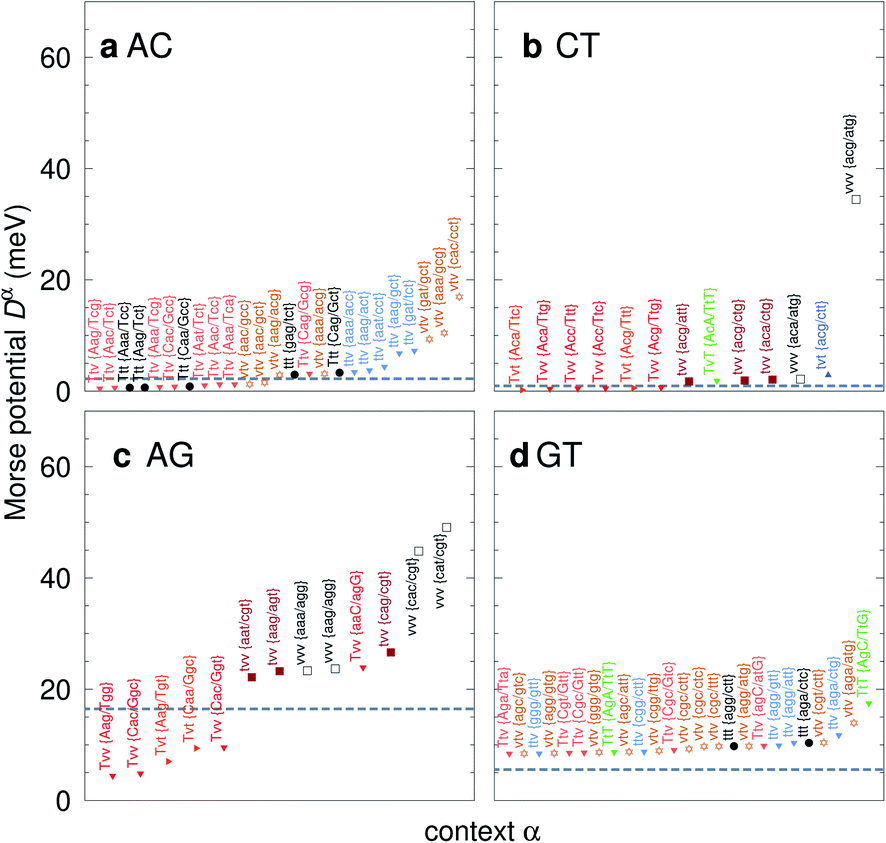

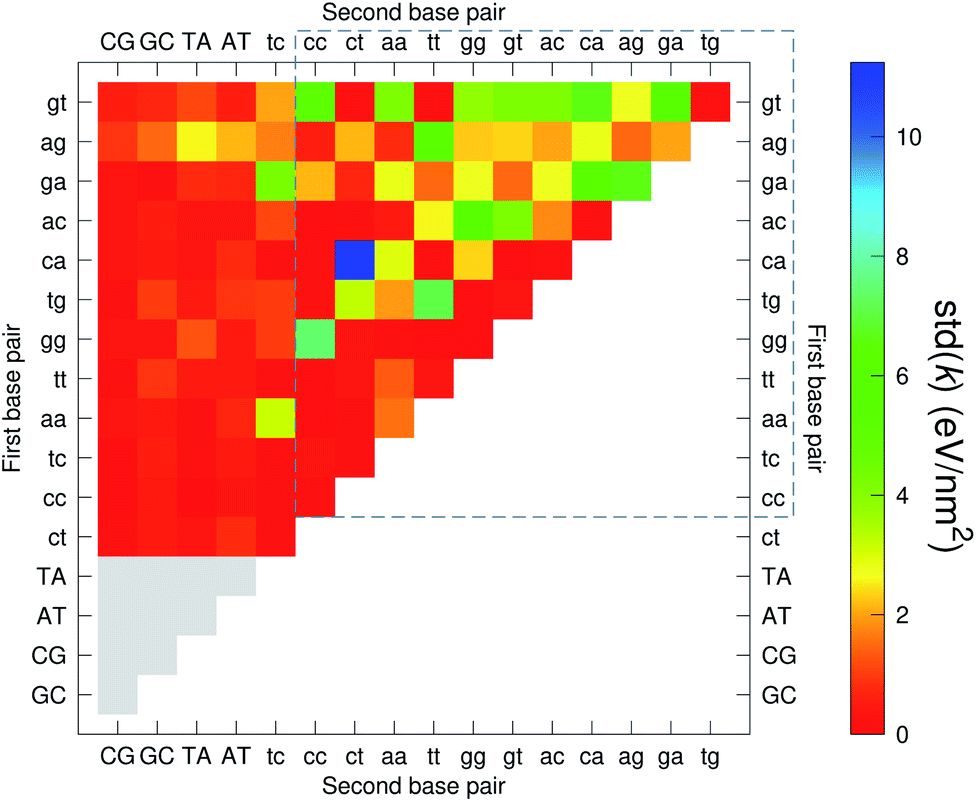
 with 2.34 eV nm−2 and
 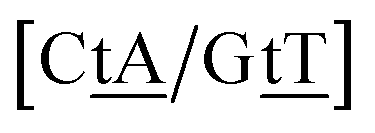 with 2.64 eV nm−2, which are in the same range as for canonical DNA. On the other hand, for {A
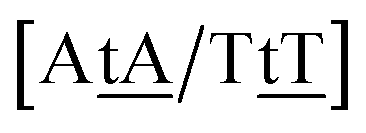 and
and 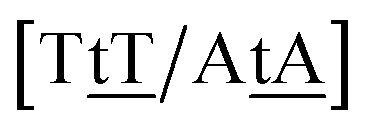 , respectively. Specific TT hydrogen pairing modes were observed at low temperature for {C
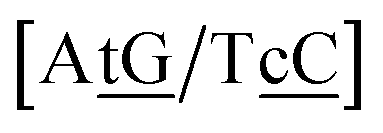 and
and 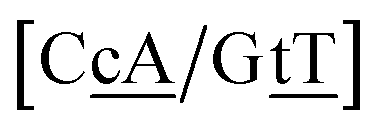 . The only context with larger potential has 34.4 meV for {a
 with the extreme value of 71.8 eV nm−2. CG flanked stacking however can be very small as for instance 0.245 eV nm−2 for
 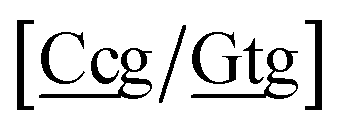 . The measurements by Tibanyenda et al.27 involve a {c
 we found 6.72 eV nm−2. This step occurs in the sequences used by Isaacs and Spielmann97 and the average displacement profile is shown in Fig. 10 where we also show the corresponding canonical profile. Fig. 10 bears some qualitative similarities to the helical parameters calculated from the molecular dynamics trajectories from Isaacs and Spielmann,97 see Fig. 5 of ref. 97. They also noted that in sequences containing GT, all base pairs display lower kinetic stability resulting in larger displacements than their canonical counterparts, which we also observe in Fig. 10. The large stacking of step
 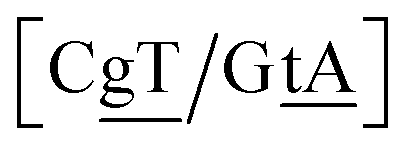 correlates with a larger stacking overlap seen in the structure of this sequence, shown in Fig. S9.† Apart from {A
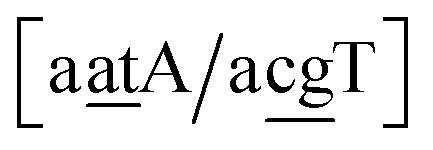 . An important occurrence of GT mismatches in genomic DNA, is the deamination of 5-methylcytosine, which are repaired by thymine DNA glycosylase (TDG) through base excision.99 The repair efficiency of TDG depends on the 5′ base pair flanking GT, which is much lower for neighbouring AT base pairs on the 5′ side.16–18 This is the context {A
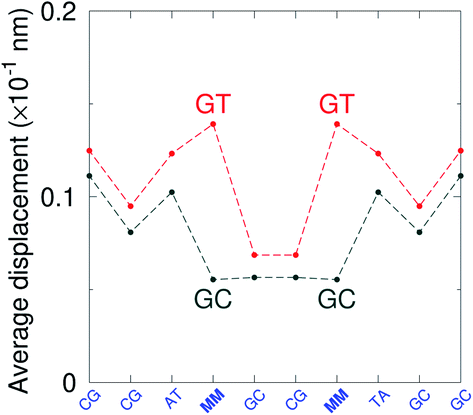
 . The molecular dynamics for this particular case suggested100 that the mismatched base pairs rearranged to gain stability through hydrogen bonding and increased stacking. In particular it was observed that GG base pairs interact with one of the C bases of the adjacent CC mismatch, in a hydrogen bonding triad.100 The extremely low Morse and stacking potentials involving the CC mismatch suggest that there is no interaction between the two C bases in this situation.
 . The Morse potentials in this case are of moderate intensity, 16.3 meV for both context groups, see also Fig. 7. A stacking stability of this magnitude was not observed in our previous work. Until now, the largest stacking potential found with the mesoscopic model was 12.5 eV nm−2 for inosine–guanosine stacked onto CG, which was correlated to its inosine(syn)–guanosine(anti) configuration.48 A very large stacking potential suggests a correlation with the sheared G(anti)–A(anti) configuration in which they are often observed.108,109 For the
 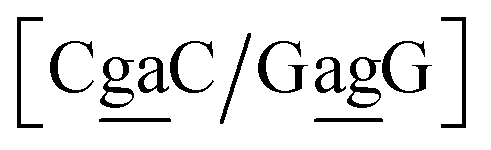 context, for which the sheared stacking has been observed by NMR,102 we obtained 17.3 eV nm−2. We determined a value of 25.4 eV nm−2 for
 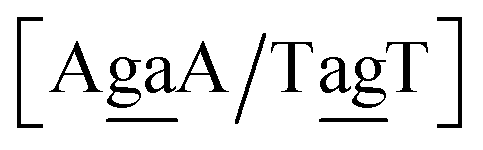 for which sheared stacking has been observed in X-ray diffraction.110 For
 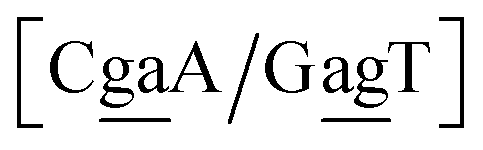 the value was 18.3 eV nm−2.111 GA–AA mismatches with sheared stacking have been observed in quadruple mismatches,112 involving the context
 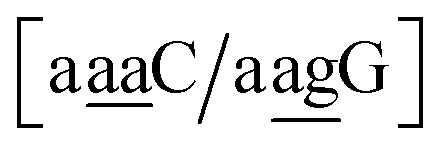 , with moderately increased stacking of 6.84 eV nm−2. AA–AA mismatches were also reported in this work,112 however these were in a context that is not covered by the CD type parameters. For the CI parameters we obtained a stacking parameter of 9.23 eV nm−2.
 , which suggest that a similar sheared stacking might be taking place. A considerable number of double mismatches resulted in a stacking potential of the magnitude as that of observed for GA–AG. In ESI Table S3† we highlight all stacking parameters that exceed their average values by twice the standard deviation, which may be useful as candidate sequences for further experimental studies. However we are not aware of any experimental results for this or other mismatch configurations with large stacking parameters. Note that there is also a substantial number of very low stacking potentials as for instance AA–CC, CC–TT and CA–GC.