 Open Access Article
The role of porphyrin peripheral substituents in determining the reactivities of ferrous nitrosyl species†
Sk
Amanullah
 and
Abhishek
Dey
 *
*
School of Chemical Sciences, Indian Association for the Cultivation of Science, 2A & 2B Raja SC Mullick Road, Kolkata, India – 700032. E-mail: icad@iacs.res.in
First published on 7th May 2020
Abstract
Ferrous nitrosyl {FeNO}7 species is an intermediate common to the catalytic cycles of Cd1NiR and CcNiR, two heme-based nitrite reductases (NiR), and its reactivity varies dramatically in these enzymes. The former reduces NO2− to NO in the denitrification pathway while the latter reduces NO2− to NH4+ in a dissimilatory nitrite reduction. With very similar electron transfer partners and heme based active sites, the origin of this difference in reactivity has remained unexplained. Differences in the structure of the heme d1 (Cd1NiR), which bears electron-withdrawing groups and has saturated pyrroles, relative to heme c (CcNiR) are often invoked to explain these reactivities. A series of iron porphyrinoids, designed to model the electron-withdrawing peripheral substitution as well as the saturation present in heme d1 in Cd1NiR, and their NO adducts were synthesized and their properties were investigated. The data clearly show that the presence of electron-withdrawing groups (EWGs) and saturated pyrroles together in a synthetic porphyrinoid (FeDEsC) weakens the Fe–NO bond in {FeNO}7 adducts along with decreasing the bond dissociation free energies (BDFENH) of the {FeHNO}8 species. The EWG raises the E° of the {FeNO}7/8 process, making the electron transfer (ET) facile, but decreases the pKa of {FeNO}8 species, making protonation (PT) difficult, while saturation has the opposite effect. The weakening of the Fe–NO bonding biases the {FeNO}7 species of FeDEsC for NO dissociation, as in Cd1NiR, which is otherwise set-up for a proton-coupled electron transfer (PCET) to form an {FeHNO}8 species eventually leading to its further reduction to NH4+.
Introduction
Nitrite plays a vital role in the biochemical N-cycle.1,2 Being generated from nitrate by the action of a molybdenum-containing nitrate reductase,3 nitrite is consumed via several pathways which involve multiple heme and non-heme enzymes (Scheme 1A).2 Assimilatory ammonification, catalyzed by siroheme containing nitrite reductase (CSNiR), and dissimilatory nitrite reduction, catalyzed by multi-c heme-containing nitrite reductase (CcNiR, Fig. 1A), lead to the formation of ammonium ion (NH4+) directly, without releasing any intermediate nitrogenous species.4 Alternatively, denitrification involves the reduction of nitrite to nitric oxide (NO), catalyzed by heme cd1 containing nitrite reductase (Cd1NiR, Fig. 1B).5 Further reduction of nitric oxide generates nitrous oxide,6 which is eventually reduced further to dinitrogen.7,8 Thus, CcNiR reduces nitrite to NH4+ without releasing any intermediate, and Cd1NiR reduces nitrite to release NO. Both of these enzymes have heme cofactors in their active site with a very similar distal environment and electron transfer partners (Fig. 1).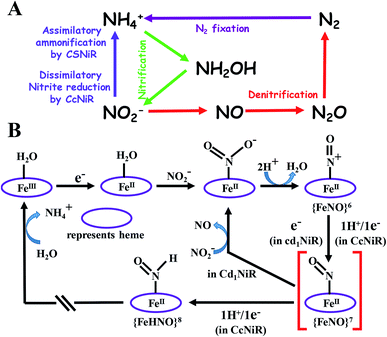 | ||
| Scheme 1 (A) Selected components of the biochemical cycle of “N” and (B) proposed mechanistic pathways of nitrite reduction catalyzed by CcNiR and Cd1NiR.2 | ||
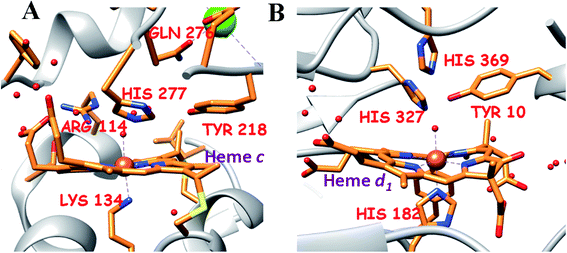 | ||
| Fig. 1 The active site structure of the nitrite reductases at resting state; (A) CcNiR (pdb: 1FS7)24 and (B) Cd1NiR (pdb: 1NIR);25 the figures are redrawn using the software package Chimera 1.12rc. | ||
The proposed mechanistic pathways of both Cd1NiR and CcNiR are quite similar (Scheme 1B).2 The nitrite binds to the reduced ferrous iron center. With two protons from the distal residues, a molecule of water is released, forming a {FeNO}6 intermediate (Enemark–Feltham notation).5,9,10 The CcNiR avoids the formation of the dead-end intermediate, {FeNO}7 through two consecutive proton-coupled electron transfer (PCET) to the {FeNO}6 species, generating an {FeHNO}8 intermediate,11 which, on further reduction, leads to the generation of NH4+.9 Alternatively, Cd1NiR forms {FeNO}7 through an electron transfer (ET) from cytochrome c, and releases NO with the concomitant binding of nitrite to the ferrous heme-d1 and the cycle continues.12–14 The different reactivity of {FeNO}7 species compels investigating the difference in the active sites that controls the competition between the PCET process and NO release. A {FeNO}7 adduct generally possesses a very strong Fe–NO bond with a Kd ∼ 10−9 and this displacement of NO by nitrite is rather unexpected.15 Although the N–O stretch of the {FeNO}7 species of CcNiR is not reported, the N–O stretch of Cd1NiR is higher than that of other known heme proteins like hemoglobin and myoglobin.16–18 We find a strong positive correlation between the reported rate of NO dissociation and the corresponding N–O frequency (Fig. 2A). It suggests that the rate of NO dissociation is reflected by the strength of the Fe–NO bond, which is reflected in the N–O stretching vibration.16–21 Similar correlation is also present between the N–O stretching frequency and the rate of NO displacement by pyridine in different synthetic meso-phenyl substituted Fe-porphyrins (Fig. 2B).22 Iron-porphyrins bearing electron-withdrawing groups (EWGs), having higher N–O stretching frequency, release NO easier. Previous work from our group demonstrated that the iron-porphyrins bearing EWGs and/or saturated β-pyrrolic carbons form weaker iron-nitrosyls due to the competitive back-bonding between macrocycle π* and NO π*-orbitals from the filled Fe-dπ orbitals.23
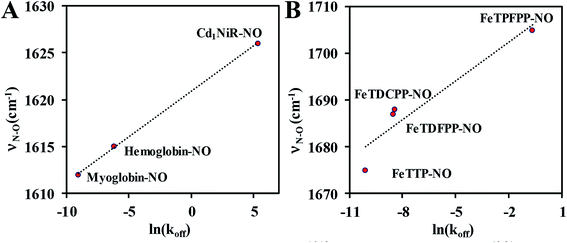 | ||
| Fig. 2 Correlation between N–O stretching frequency16–18 and rate of NO dissociation:19–21 (A) in six-coordinate heme nitrosyls in enzyme systems; (B) in synthetic Fe-porphyrin nitrosyl complexes, TTP (p-tolyl), TDFPP (2,6-difluorophenyl), TDCPP (2,6-dichlorophenyl), TPFPP (pentafluorophenyl). | ||
CcNiR and Cd1NiR possess basic 2nd sphere distal residues and primarily σ-donor histidine or lysine axial ligands and the same redox partner (cytochrome c). These residues assist in NO2− binding, proton translocation and are likely to affect the dissociation constants of NOx ligands.9,11,26,27 Another major distinction is the difference in the nitrite binding sites: heme c in CcNiR, and heme d1 in Cd1NiR (Fig. 1).24,25 The major difference in heme d1, relative to heme c is the presence of two saturated β-pyrroles (i.e., sp3 hybridized peripheral carbons) along with two electron-withdrawing keto-groups (Fig. 3).28,29 Therefore, their divergent reactivity may stem from differences in the structure of iron-porphyrinoid macrocycles. To evaluate this possibility, the electrochemistry of synthetic iron-porphyrin model complexes (FeTPP, FeOEP, FeOEPone and Fe(2,4-OEPdione), Fig. 3) and their nitrosyl adducts has been investigated by several groups.30–39 Under coulometric conditions, nitrite could be reduced to ammonium ion by the synthetic complexes mediated by a hydroxylamine bound species.40–43 The rate of the reaction was strongly directed by the macrocycle i.e., FeOEP reacted faster than FeTPP and the reaction was very slow in the Fe(2,4-OEPdione) complex. The basicity of {FeNO}8 species could potentially explain the difference in reactivity.42 Alternatively, the greater Lewis acidity of {Fe(2,4-OEPdione)–NO}7 (as suggested by the facile pyridine binding to the Fe) was suggested to enhance the His-coordination with heme d1 which might help the release of the trans NO.33 These results herald the intrinsic nature of the macrocycle as a determinant of the different reactivity of the {FeNO}7 species, i.e., NO release vs. PCET. An {FeHNO}8 species (converted after PCET to {FeNO}7) is quite reactive and so far could only be transiently observed in protected environments such as proteins,44,45 or in bis-picket fence porphyrin46 or in highly electron-rich FeOEP in the presence of weak acids such as substituted phenols.41 Alternatively, under electrochemical conditions, {FeNO}8 yields the parent {FeNO}7 species and H2.43 It is important to understand the role of these peripheral modifications in the electronic structure and reactivity of these iron nitrosyls, to understand the different reactivities of the {FeNO}7 species exhibited by these enzymes.
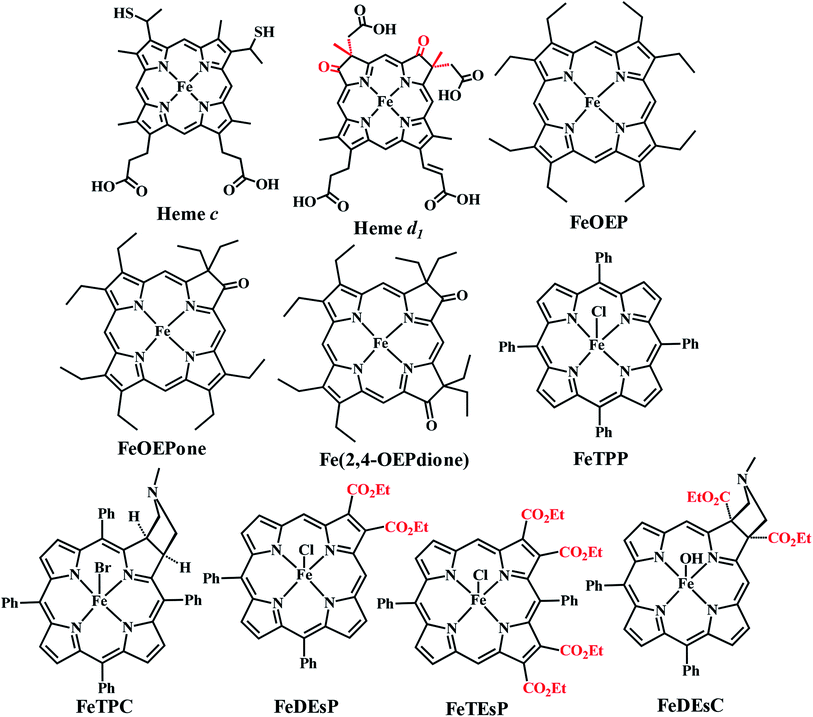 | ||
| Fig. 3 Structure of the naturally occurring heme and synthetic Fe-porphyrinoids. FeOEP, FeOEPone, and Fe(2,4-OEPdione) were synthesized previously.32,47,48 | ||
In this manuscript, a series of synthetic iron-porphyrins were developed for systematically varying their peripheral substituents. By introducing EWGs and/or saturation at the β-pyrrolic positions, we were able to decode the role of each substituent on the basic iron-porphyrin skeleton in the electronic structure and reactivity of their corresponding {FeNO}7 species. The electrochemical and spectroscopic data of their NO adducts and density functional theory (DFT) calculations help delineate the contribution of reduction potential and pKa to the bond dissociation free energy (BDFENH) of the N–H bond in the {FeHNO}8 species. The results indicate a definitive role of EWG and saturation in tuning the Fe–NO bond strength, the reduction potential of {FeNO}7 and pKa of {FeNO}8 species, which can likely explain the origin of differences in the reactivity of CcNiR and Cd1NiR.
Results
Synthesis
The heme involved in the nitrite binding sites of CcNiR and Cd1NiR is heme c and heme d1, respectively. The major difference between these is the presence of two electron-withdrawing-keto groups and two saturated β-pyrrolic carbons in heme d1 (Fig. 3). To rationalize the effect of the EWG and/or saturation, a series of iron-porphyrinoids were synthesized (Fig. 3), namely, iron-tetraphenylporphyrin (FeTPP, fully unsaturated); iron-diesterporphyrin (FeDEsP, having two electron-withdrawing ester groups); iron-tetraesterporphyrin (FeTEsP, having four ester groups); iron-tetraphenylchlorin (FeTPC, having two saturated β-pyrrolic carbons) and iron-diesterchlorin (FeDEsC, having two ester groups and two saturated β-pyrrolic carbons). The EWGs were designed to qualitatively emulate the −I (inductive) effect of the keto-groups in heme d1. FeTPP, FeTPC, FeDEsP, and FeDEsC complexes were synthesized following previously reported procedures.23,49FeTEsP was synthesized to introduce four electron-withdrawing substitutions on the porphyrin ring. TEsP (5 in Scheme 2) was synthesized by the propionic acid condensation of two dipyrromethanes (Scheme 2), one of which (TEsbpyr-dial, 3 in Scheme 2) contained four ester groups (at the 3 and 4 positions of the respective pyrroles) as well as two aldehyde groups (at the 2 positions of the respective pyrroles) and the other half was 5-phenyldipyrromethane (4 in Scheme 2). Base induced cyclization of diethyl fumarate and p-toluenesulfonylmethylisocyanide (TosMIC) leads to the formation of a pyrrole bearing two ester groups (DEspyr, 1 in Scheme 2). The dipyrromethane of DEspyr (TEsbpyr, 2 in Scheme 2) was obtained by the condensation with benzaldehyde under harsh acidic conditions. A Vilsmeier–Haack reaction was performed upon TEsbpyr to obtain the corresponding dialdehyde, TEsbpyr-dial (3 in Scheme 2).
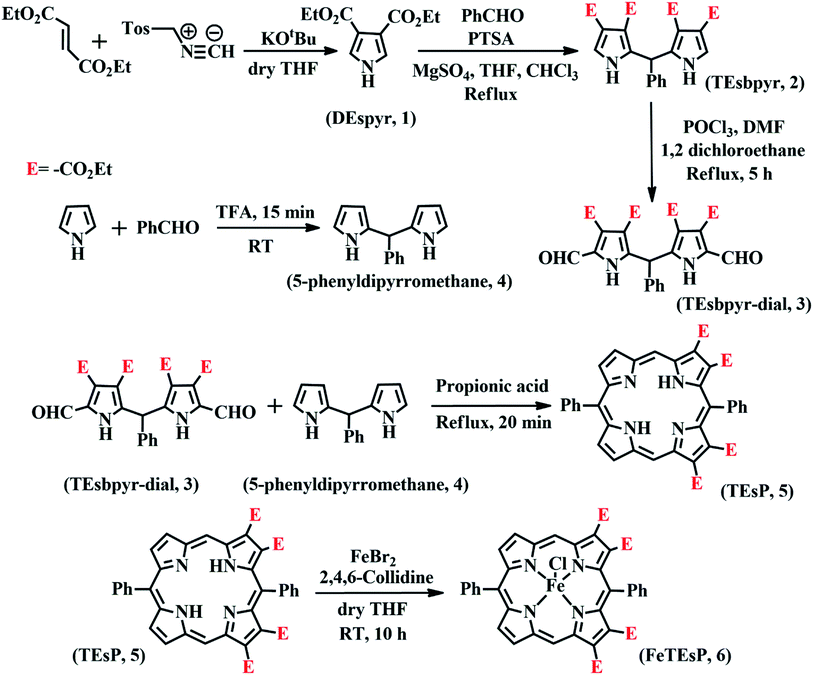 | ||
| Scheme 2 Synthetic strategy of FeTEsP. In some cases, the –CO2Et group is abbreviated as “E” for clarity in representation. | ||
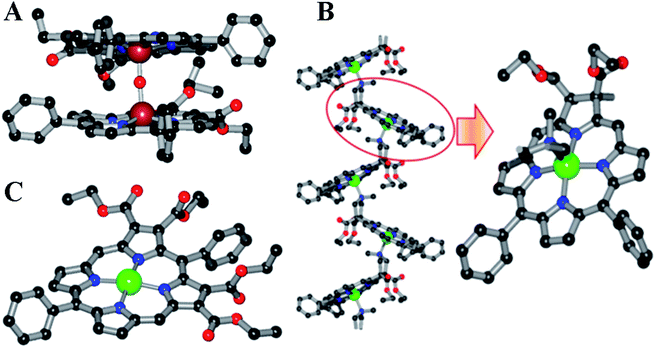
The other half, i.e., the 5-phenyldipyrromethane (4 in Scheme 2), was prepared by the acid-catalyzed condensation of pyrrole and benzaldehyde following the Lindsey protocol.50 Zinc and iron metalation was performed using established protocols.49 The zinc complex of TEsP was characterized by single-crystal XRD. Needle-shaped purple crystals of ZnTEsP were grown from the diffusion of hexane into a chloroform solution of the complex (Fig. 4C). It crystallized in a triclinic symmetry with a centrosymmetric P![[1 with combining macron]](https://www.rsc.org/images/entities/char_0031_0304.gif) space group. Structural analysis revealed that it was a dimer, formed by the coordination of a free carbonyl “oxygen” atom with the zinc atom of another molecule. The structures of FeDEsP and ZnDEsC were reported before and are shown here for comparison (Fig. 4A and B). Further investigations were performed with the nitrosyl adducts of the iron-bound porphyrinoids.
space group. Structural analysis revealed that it was a dimer, formed by the coordination of a free carbonyl “oxygen” atom with the zinc atom of another molecule. The structures of FeDEsP and ZnDEsC were reported before and are shown here for comparison (Fig. 4A and B). Further investigations were performed with the nitrosyl adducts of the iron-bound porphyrinoids.
Iron-nitrosyl reduction potentials
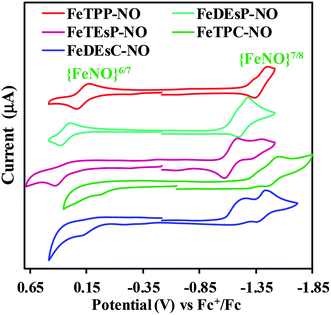
The cyclic voltammograms of the nitrosyl complexes of FeTPP, FeDEsP, FeTEsP, FeTPC, and FeDEsC showed an oxidation process at 0.20, 0.34, 0.38, −0.04 and 0.10 V, respectively, against the Fc+/Fc redox couple (Fig. 5). For FeTPC and FeDEsC, the process was clearly observed only under fast scan rates (Fig. S23B†). The process was irreversible at slow scan rates, indicating dissociation of the NO during oxidation. Note that the CV of FeDEsC was performed under NO saturation condition to prevent NO loss from the complex. Past research from the Ryan and Kadish group established the nature of these redox events: the oxidation wave of porphyrin {FeNO}7 leads to the formation of FeIII–NO species, while in the case of chlorins, bacterio/iso-bacteriochlorins, and porphinone/porphinediones, the oxidation leads to the formation of FeII–NO species with the macrocycle-cation radical.32,33,36,51 The {FeNO}7/8 process was observed for FeTPP, FeDEsP, FeTEsP, FeTPC, and FeDEsC at −1.41, −1.24, −1.14, −1.51 and −1.42 V, respectively, vs. the Fc+/Fc redox couple (Fig. 5). The values obtained for FeTPP were consistent with previous reports.38 The pre-wave observed in the case of FeTPP (−1.32 V), FeDEsP (−1.17 V) and FeTPC (−1.38 V) might be due to ligand association, which disappeared at higher scan rates (Fig. S23A†) as reported by the Kadish group earlier.38,52 In the case of FeDEsC, the irreversible pre-wave at ∼ −1.22 V vs. the Fc+/Fc redox couple was likely due to the direct electrochemical NO reduction53 (NO saturated solution), as observed by the Kadish group during the reduction of FeII–TPP–NO and FeII–OEP–NO, in the presence of excess NO gas in the medium.38A clear trend was observed in both the oxidation and reduction process of the {FeNO}7 species for the series of iron porphyrinoids used here. With an increase in the number of EWGs attached to the β-pyrroles relative to FeTPP–NO, both {FeNO}6/7 and {FeNO}7/8 couples shifted to higher potential (i.e., for FeDEsP–NO and FeTEsP–NO in Fig. 5). Alternatively, saturating one of the pyrroles of FeTPP–NO, i.e., in the case of FeTPC–NO, both the reduction couples shifted to lower potentials. The FeDEsC–NO complex, having both EWGs as well as saturated pyrrole centers, had both the reduction potentials almost similar to those of FeTPP–NO. This implied that the EWG and saturation had opposite effects on the electronic structure of the Fe–NO unit.
Fe–NO bond strength
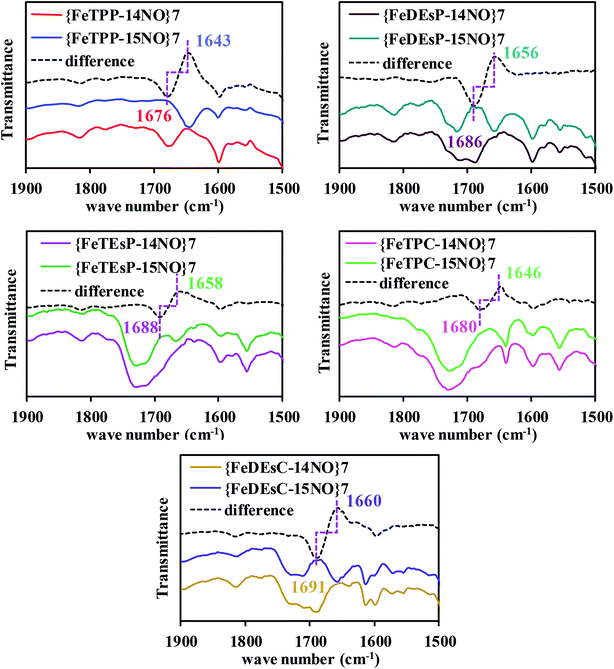
The FTIR data of the five-coordinate {FeNO}7 complexes of FeTPP, FeDEsP, FeTEsP, FeTPC, and FeDEsC showed the N–O stretch at 1676, 1686, 1688, 1680 and 1691 cm−1, respectively (Fig. 6). The data showed that when two EWGs were introduced (FeDEsP), the N–O vibration (str.) shifted to 1686 cm−1 from 1676 cm−1 in FeTPP. Further addition of EWGs (FeTEsP), shifted the N–O vibration (str.) up to 1688 cm−1. Such high N–O stretching frequencies had only been reported for {FeNO}7 species of octa-halogenated porphyrins and reflect poor back-bonding between the occupied iron and unoccupied NO π*-orbitals.22,54 The saturation of the pyrrole, by itself, exerted little effect on Fe–NO bonding as indicated by the N–O stretching frequency of {FeTPC–NO}7 at 1680 cm−1 which was very similar to that of {FeTPP–NO}7. But saturation along with EWGs caused a substantial weakening of the NO adduct, as indicated by the N–O stretch of {FeDEsC–NO}7 at 1691 cm−1, relative to {FeTPP–NO}7 at 1676 cm−1. The Fe–N stretch of the {FeNO}7 species of FeTPP–NO reproduced the previously reported value. However, despite several attempts with resonance Raman the Fe–N stretching frequencies could not be obtained for the other compounds studied (Fig. S24A†).43 The strength of the Fe–NO bond in the {FeNO}7 adducts was strongly dictated by both σ-bonding and π-back-bonding.55–58 As reported recently, the presence of electron-withdrawing substitutions on the porphyrin lowers the energy of the porphyrin π*-orbitals. This results in competitive back-bonding from the filled dπ orbitals of Fe between porphyrin π* and NO π*-orbitals, which eventually weakens the NO adducts.23 Saturation by itself had a minor effect on the back-bonding. However, saturation along with two EWGs had an enhanced effect on the weakening of the NO-adduct.Qualitatively, a similar trend was observed for N-methylimidazole bound six-coordinate {FeNO}7 species where the N–O stretching vibrations for FeTPP, FeDEsP, FeTEsP, FeTPC, and FeDEsC were observed at 1626 cm−1, 1641 cm−1, 1646 cm−1, 1635 cm−1 and 1633 cm−1, respectively (Fig. S25A†). Therefore, an axial, primarily σ donor, nitrogenous ligand has a very limited effect on the electronic structure of these {FeNO}7 complexes. Note that the N–O stretching of the {FeNO}7 species in Cd1NiR was 1626 cm−1 with heme d1, relative to 1612 cm−1 in myoglobin with heme b (which neither has an EWG nor saturation).16–18 The higher N–O stretching frequency in Cd1NiR (by 14 cm−1) was indicative of a weaker Fe–NO bonding. And it was associated with a ∼106 fold enhancement in NO dissociation rate from the {FeNO}7 intermediate (Fig. 2).13,19–21,59 The 15 cm−1 upshifting of the N–O vibration observed here between FeDEsC and FeTPP mirrored the 14 cm−1 shift observed between Cd1NiR and myoglobin suggesting a weakening of the Fe–NO bond, raising the possibility of ligands like NO2− displacing the bound NO.
The displacement of the bound NO from the N-methylimidazole bound six-coordinated {FeNO}7 species by NO2− was investigated using absorption spectroscopy (see the ESI, Section 8†). The Kd for the process (FeII–NO + NO−2 ⇄FeII–NO−2 + NO) was determined to be 0.09 for FeTPP and 0.46 for FeDEsC (Table 1). The higher Kd for FeDEsC, relative to FeTPP, translated to a ΔG difference of ∼1 kcal mol−1 and correlated very well with its stronger N–O stretching frequency and demonstrated clearly how the EWG and saturation of the porphyrin ring aid the displacement of NO by NO2−, as proposed for Cd1NiR. A similar effect was observed on the displacement rate of NO by pyridine in {FeNO}7 complexes in a series of iron porphyrins, where the octa-halogenated derivative of TPP was ∼106 times faster than that of FeTPP.22
| {FeNO}6 | ⇔ | {FeNO}7 | ⇔ | {FeNO}8 | K d | |
|---|---|---|---|---|---|---|
| ν N–O 5C (6C) | E°,b | ν N–O 5C (6C) | E° | ν N–O 5C (6C) | ||
| a Stretching frequency in cm−1. b Potentials are reported vs. Fc+/Fc in dichloromethane. c Not observed. d Irreversible cathodic waves. e FeII–NO + NO−2 ⇄ FeII–NO−2 + NO. | ||||||
| FeTPP–NO | 1844 (1914) | 0.20 | 1676 (1626) | −1.41 | 1496 (ref. 43) | 0.09 ± 0.05 |
| FeDEsP–NO | (1923) | 0.34 | 1686 (1641) | −1.24 | 0.20 ± 0.04 | |
| FeTEsP–NO | (1927) | 0.38 | 1688 (1646) | −1.14 | 1550 | 0.23 ± 0.02 |
| FeTPC–NO | −0.04d | 1680 (1635) | −1.51 | 0.13 ± 0.04 | ||
| FeDEsC–NO | 0.10d | 1691 (1633) | −1.42 | 1537 | 0.46 ± 0.04 | |
Spectroelectrochemistry was used to access the N–O vibrations of the {FeNO}6 and {FeNO}8 species (Table 1, Fig. S26–S28†). The N–O vibrations for the six-coordinate {FeNO}6 for FeTPP, FeDEsP, and FeTEsP were obtained at 1914 cm−1, 1923 cm−1, and 1927 cm−1, respectively (Fig. S27†). The higher N–O vibration for the porphyrins containing EWGs relative to FeTPP mirrored the trend observed for the corresponding {FeNO}7 species. The N–O vibrations for both five and six-coordinate {FeNO}6 species of FeTPC and FeDEsC could not be obtained, which was consistent with the irreversible CV observed for these species indicating that the {FeNO}6 species dissociate within the time scale of the experiment (Fig. S23B and S27†). The inability to identify five-coordinate {FeNO}6 species of FeDEsP and FeTEsP again suggested the formation of a labile {FeNO}6 adduct. The N–O vibrations for the {FeNO}8 species could be observed for FeTEsP and FeDEsC at 1550 cm−1 and 1537 cm−1, respectively (Fig. S28 and Table S2†). The values obtained were consistent with the previously reported values for the five-coordinate {FeNO}8 porphyrins.54,60,61 Note that the frequencies were much higher than the value reported for FeTPP at 1496 cm−1.43 Here, too, the inclusion of the EWG and saturation together leads to a substantial increase in the N–O vibration indicating a weakening of the Fe–NO bonding. Thus, the FTIR data for the {FeNO}6, {FeNO}7, and {FeNO}8 species all showed that the inclusion of EWG and saturation at the periphery of the porphyrin macrocycle substantially weakened the Fe–NO bonding.
A plot of the experimentally observed N–O vibrations (Table 1) with ln(Kd) for the series of complexes investigated here showed a reasonably linear correlation (Fig. 7) in line with the linear correlation observed between ν(N–O) and ln(koff) (Fig. 2). Thus, the electronic structure responsible for the correlation in the enzyme active site was captured in the series of porphyrins used here – primarily the competitive back-bonding between porphyrin π* and NO π*-orbitals adding credence to the use of the electron-withdrawing –COOEt group to mimic the keto-group in heme d1. The Kd was larger for {Fe–NO}7 species with higher ν(N–O) frequency. The stronger back-bonding with the porphyrin π* will reduce back-bonding to the NO π* thus tuning its pKa. It is conceivable that this will affect the thermodynamics of the PCET to {FeNO}7 to form {FeHNO}8.
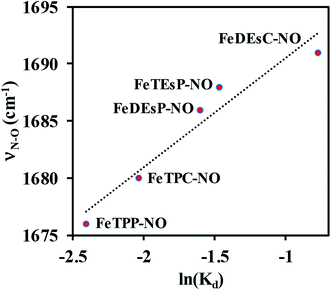 | ||
| Fig. 7 Correlation between experimentally measured N–O stretching frequency and NO dissociation constant. | ||
PCET to {FeNO}7
The {FeNO}7 species of CcNiR, with heme c, accepts 1H+/1e− to form {FeHNO}8 on its way to form NH4+ without releasing any intermediate species and does not dissociate NO.9 The lower N–O stretch in {FeNO}7 of heme c (1651–1671 cm−1),62 in general, was suggestive of a weak NO dissociation in CcNiR. But, for a facile PCET, the BDFE of the N–H bond in {FeNHO}8 should be high as well.63 The BDFE of the N–H bond in {FeHNO}8 species can be calculated using the following equation:64| BDFENH = 1.37pKa + 23.06E° + C |
| Complexes | ΔpKa | ΔE° (mV) | ΔBDFENH (kcal mol−1) |
|---|---|---|---|
| FeTPP–NO | 1.57 | 10 | 2.38 |
| FeDEsP–NO | −0.32 | 180 | 3.71 |
| FeTEsP–NO | −3.12 | 280 | 2.18 |
| FeTPC–NO | 1.92 | −90 | 0.56 |
| FeDEsC–NO | — | — | — |
| FeOEP–NO | 5.36 | −70 | 5.73 |
| FeOEPone–NO | 0.91 | 140 | 4.47 |
| Fe(2,4-OEPdione)–NO | −1.76 | 260 | 3.58 |
Comparing the ΔG° for PCET to the {FeNO}7 species of FeDEsC–NO and FeDEsP–NO (without saturated pyrroles), the major contribution to the difference was derived from the E° of the {FeNO}7/8 redox process. E° was increased by ∼180 mV in FeDEsP–NO, making the reduction more facile. As a result, the BDFENH of {FeHNO}8 species of FeDEsP–NO was increased by ∼3.71 kcal mol−1, relative to FeDEsC–NO, suggesting that the {FeNO}7 species of FeDEsP–NO should be more prone to undergo PCET reaction than FeDEsC–NO. Gratifyingly, during the electrochemical reduction of FeDEsP–NO, it generated N2O in the presence of methanol as the proton source. This was evidenced by the growth of a vibrational band at 2224 cm−1 as a cathodic potential was applied (Fig. 8A), which shifted to 2154 cm−1 when 15NO was used (Fig. 8B). The formation of N2O from NO can be mediated by {FeHNO}8 which is difficult to characterize under electrochemical conditions.65 Alternatively, when {FeDEsP–NO}7 was reduced chemically by cobaltocene in the presence of methanol and PPh3, it readily generated Ph3P![[double bond, length as m-dash]](https://www.rsc.org/images/entities/char_e001.gif) O and Ph3P
O and Ph3P![[double bond, length as m-dash]](https://www.rsc.org/images/entities/char_e001.gif) NH (see the ESI, Section 10, Fig. S33–S35†), suggesting the generation of HNO in the solution. This can only happen if the reaction proceeds through the PCET process forming a {FeHNO}8 species.66 Note that these results do not imply that FeDEsP mirrored the reactivity of CcNiR because CcNiR does not release any HNO, it generates NH4+via {FeHNO}8 without releasing HNO or N2O. The fact that FeDEsP–NO could produce HNO from a weak proton donor while the NO could be displaced by NO2− in FeDEsC–NO suggested that the electronic structure of the porphyrin ring resulting from the EWG and saturation can discriminate NO release vs. PCET to a {FeNO}7 species under physiological conditions.
NH (see the ESI, Section 10, Fig. S33–S35†), suggesting the generation of HNO in the solution. This can only happen if the reaction proceeds through the PCET process forming a {FeHNO}8 species.66 Note that these results do not imply that FeDEsP mirrored the reactivity of CcNiR because CcNiR does not release any HNO, it generates NH4+via {FeHNO}8 without releasing HNO or N2O. The fact that FeDEsP–NO could produce HNO from a weak proton donor while the NO could be displaced by NO2− in FeDEsC–NO suggested that the electronic structure of the porphyrin ring resulting from the EWG and saturation can discriminate NO release vs. PCET to a {FeNO}7 species under physiological conditions.
Discussion
It has been proposed that CcNiR undergoes two consecutive PCET reactions on the {FeNO}6 intermediate. The first PCET forms a {FeNO}7 species (with protonation of Arg114 residue) which subsequently generates {FeHNO}8 species through another PCET process, releasing only a trace amount of the {FeNO}7 intermediate.11,67 In contrast, Cd1NiR undergoes an electron transfer (ET) from cytochrome c, forming the {FeNO}7 intermediate, which releases NO rapidly (koff ∼ 200 s−1).13,19 There is an extensive debate on whether the NO is released from the ferric state or the ferrous state of the NO adduct.1,68 Recent data suggest that it is likely that NO is released from the ferrous, {FeNO}7 state.2,13,59 The fast release of NO from the {FeNO}7 intermediate may be attributed to a weak Fe–NO bonding in the ferrous nitrosyl adduct formed. The higher N–O stretching frequencies in the {FeNO}n (n = 6, 7, and 8) species of FeTEsP and FeDEsC suggested weak Fe–NO bonding, i.e., four electron-withdrawing ester groups or two ester groups with two saturated carbon centers had an almost similar effect. Thus, heme d1, which had two EW-keto groups and two saturated pyrrolic carbons, was likely to have a weaker Fe–NO bond relative to heme c, which has neither. A weaker Fe–NO in FeDEsC is associated with a large Kd for NO2− replacement relative to FeTPP consistent with the strong linear correlation between νN–O and Kd observed for both enzymatic and synthetic systems. Similarly, a weaker Fe–NO in the heme d1 active site of Cd1NiR, evident from a higher νN–O, should result in higher NO (product) Kd, relative to NO2− (substrate). It might be envisaged that due to the ruffled nature of the isobacteriochlorin ring in heme d1, they form weak {FeNO}7 species. But calculations of the ruffling parameters69 suggested that maximum ruffling was present in {FeTPC–NO}7 species, which possess a chlorin ring (see the ESI, Section 9†), and had a relatively strong Fe–NO bond.The ΔG° for PCET to the {FeHNO}8, the competing reaction to NO release, was affected by both E° and pKa of the {FeNO}7 species. Between FeDEsC–NO and FeTPC–NO, where the latter was devoid of EWGs, the pKa of {FeNO}8 species increased by 1.92 units (Table 2), but it lowered the E° of the {FeNO}7/8 redox process by ∼90 mV (Table 2), making the PCET to the {FeNO}7 species of FeTPC–NO slightly favorable, relative to FeDEsC–NO. By omitting both saturation and EWGs (FeTPP–NO), the E° decreased while the pKa of {FeNO}8 species increased which resulted in higher BDFENH of the {FeHNO}8 species but it was not as high as that of FeDEsP–NO. In the case of FeTEsP–NO, where the saturation was absent but two more EWGs were present (relative to FeDEsC–NO), the E° increased by ∼280 mV but the pKa of {FeNO}8 species becomes too low to be protonated, resulting in BDFENH being lower than that of FeTPP–NO. Therefore, for a facile PCET, there needs to be a balance between E° and pKa, which was attained here in FeDEsP–NO. This model was equally applicable to the FeOEP system, where the high BDFENH was due to the greater pKa of the {FeNO}8 species. Introducing EW-keto groups increased the E° but at the expense of the pKa of {FeNO}8 species (Table 2), resulting in a gradual decrease in BDFENH. However, it should also be noted that {FeHNO}8 species is not very stable due to the disproportionation of the Fe–HNO unit. The {FeHNO}8 species could only be stabilized either with steric protection (bis-picket fence porphyrin46 or globin chain in hemoglobin44,45) or in a highly electron-rich porphyrin like FeOEP (νNO/{FeNO}7 = 1665 cm−1).41,70–72 Hence, it is not surprising that {FeHNO}8 species in electron-deficient octabromo[tetrakis(pentafluorophenyl)]porphyrin, Fe(TFPPBr8) (NO) (νNO/{FeNO}7 = 1726 cm−1)54 could not be isolated. The weak BDFENH and weaker {FeNO}7 adduct likely bias the FeDEsC (which have two EWGs along with two saturated pyrrolic carbons, like heme d1 in the active site of Cd1NiR) for NO dissociation. In contrast, stronger BDFENH driven by a favourable balance between pKa (due to better back-bonding to the NO π*-orbitals) and E° is responsible for facile PCET to {FeNO}7 to produce {FeHNO}8 which is necessary to eventually release NH4+ in CcNiR.
Conclusion
In summary, the results on structural variants of iron-porphyrins suggested that Cd1NiR does not proceed with the PCET process to form {FeHNO}8 intermediate, due to its lower BDFENH arising from the weaker back-donation from heme d1 where the EWGs and sp3 peripheral carbons enhance competitive back-bonding from the iron to the porphyrinoid π* and NO π*-orbitals. The weaker back-bonding to the bound NO results in a weaker Fe–NO bond and hence, it releases NO. In CcNiR, on the other hand, heme c has greater back-bonding to the NO from iron, which strengthens the Fe–NO bond and tunes the pKa allowing PCET to occur to form {FeHNO}8 species, which is crucial for the further reactions to release NH4+.Experimental details
Materials
All reagents were of the highest grade commercially available. Iodine, trifluoroacetic acid (TFA), 2,3-dichloro-5,6-dicyano-1,4-benzoquinone (DDQ), ethanol, aqueous ammonia solution, ceric ammonium nitrate (CAN), sarcosine, potassium tert-butoxide, benzaldehyde, magnesium sulphate, p-toluenesulphonic acid (PTSA), p-toluenesulfonylmethyl isocyanide (TosMIC), phosphorus oxychloride (POCl3), dichloroethane (DCE), and propionic acid were purchased from Spectrochem Ltd. Diethyl ether, tetrahydrofuran (THF), acetonitrile, dichloromethane, and toluene were purchased from RANKEM Ltd. Paraformaldehyde, anhydrous ferrous bromide (FeBr2), 2,4,6-collidine, and tetrabutylammonium hexafluorophosphate (TBAPF6) were purchased from Sigma-Aldrich chemical company. Na2SO4 and zinc acetate were purchased from MERCK and used without any further purification. Unless otherwise mentioned all reactions were performed at room temperature. Column chromatography was performed with silica gel (mesh size: 60–100, 100–200 and 230–400) and neutral alumina, preparative TLC was performed with silica gel GF-254 (∼13% CaSO4, 0.5H2O binders with a fluorescent indicator). These were purchased from SRL Pvt. Ltd. THF was dried using K-metal in the presence of benzophenone until the colour of benzophenone turned intense bluish-green. Toluene was dried using Na-metal in the presence of benzophenone until the colour of benzophenone turned intense blue. MeOH was first dried like toluene using sodium after that it was distilled from Mg-cake. DCM and chloroform were distilled with both anhydrous CaCl2 followed by CaH2.Instrumentation
All electrochemical experiments were performed using CH Instruments (model CHI700E and CHI710D Electrochemical Analyzer). The biopotentiostat, and reference electrode (standard single-junction silver/silver chloride filled with 4 M KCl with AgCl solution) were purchased from CH Instruments. The absorption spectra were measured in the SHIMADZU spectrograph (UV-2100). The aerobic and anaerobic cuvettes were purchased from Starna Scientific. The FT-IR data were measured on the Shimadzu FTIR 8400S instrument. The CaF2 windows for IR spectroscopy were purchased from Sigma Aldrich. The anaerobic setup for IR spectroscopy was purchased from PerkinElmer. The optically transparent thin-layer electrochemical cell (OTTLE) was purchased from the University of Reading for spectroelectrochemistry. All the NMR spectra were recorded on a Bruker DPX-300, Bruker DPX-400 or DPX-500 spectrometer at room temperature. The mass spectra were recorded using the QTOF Micro YA263 instrument. Resonance Raman data were collected using a Trivista 555 spectrograph (Princeton Instruments) and using 413.1 nm excitation from a Kr+ laser (Coherent, Sabre Innova SBRC-DBW-K). The X-band EPR spectra were recorded on a JEOL instrument. X-ray single-crystal data were collected at 120 K using radiation on a SMART APEX diffractometer equipped with a CCD detector. Data collection, data reduction, and structure solution refinements were carried out using the software package APEXIII. The structure was solved by the direct method and refined in a routine manner. The non-hydrogen atoms were treated anisotropically. All the hydrogen atoms were located on a difference Fourier map and refined.Electrochemical measurements
Since {FeNO}8 readily reacts with a trace amount of water present in the solvents,43 every solvent used in electrochemical measurements was first dried following the aforementioned protocol. After that, they were super-dried with activated 4 Å molecular sieves and kept inside the glove box for 1 week. Nitrosyl adducts of the five complexes (FeTPP, FeDEsP, FeTEsP, FeTPC, and FeDEsC) were considered for electrochemical analysis. All CV data were collected under anaerobic conditions in a custom made electrochemical cell. 6 ml of NO-complex (concentration: 1 mM) was taken in the presence of 100 mM TBAPF6 as the supporting electrolyte. The glassy carbon electrode was taken as the working electrode, standard single-junction silver/silver chloride filled with 4 M KCl with AgCl solution as the reference electrode and a Pt electrode was taken as the counter electrode. Ferrocene (Fc) was used as an internal reference and the potential scale is normalized with respect to the potential of the Fc+/Fc couple. The potential was swept starting from 0 V to a positive potential (oxidation) followed by negative potential (reduction), except for FeDEsC–NO, where sweeping positive potentials led to irreversible CV. Hence, for this, the potential was swept from 0 V to negative potential (reduction) followed by positive potential (oxidation).NO complex preparation
Dry degassed NO gas was generated upon the dropwise addition of a deaerated saturated solution of sodium nitrite to the deaerated 6 M H2SO4. The gas was passed through two 4 N KOH solution bubblers followed by one concentrated H2SO4 solution. The solution of each complex was reduced by 0.5 equivalent Na2S solution (in methanol) inside a glove box, sealed properly and kept out of the box. NO gas was purged through the samples (kept in an ice bath to reduce solution evaporation) for 5 min. The vials were tightly sealed and used for further investigations. NO complexes were also prepared using Ph3CSNO (as well as Ph3CS15NO), which were prepared through reported procedures.73,74 To the reduced samples, 1 equivalent of Ph3CSNO in THF/DCM (whichever required) was added. The vials were perfectly sealed and used for further investigations. The detailed characterization of the five and six-coordinated N-methylimidazole bound {FeNO}7 adducts is given in the main text and the ESI (Fig. S24A–C, Table S1†).FTIR data collection
DCM/THF solutions of the complexes were injected in the anaerobic FTIR setup or OTTLE cell and tightly sealed inside a glove box. The cell was removed from the box and data collected. Spectroelectrochemistry was performed using the OTTLE cell connected with the electrochemical analyzer. The sample solution contained 100 mM TBAPF6 as the supporting electrolyte. The FTIR spectra were taken at different time intervals under electrolysis conditions.UV-vis absorption data collection
All anaerobic data were collected taking the samples from the glove box in a tightly sealed anaerobic cuvette. The cuvette was removed from the box and data were collected. The background was corrected before the experiments, using an identical amount of solvent mixture.Computational details
All calculations were performed at the IACS computer cluster using Gaussian 03 software.75 BP86 functional reproduced better agreement with the experimental frequencies and hence further calculations were performed with that functional. A mixed basis set with 6-311g* on Fe and 6-31g* on C, O, N and H atoms were used for optimization.76,77 For the final energy and ground-state calculations, a 6-311+g* basis set was used on all atoms. The solvent effect was corrected using the Polarizability Continuum Model (PCM).78 For all complexes spin-unrestricted schemes have been adopted which distinguish between α and β-spin orbitals. Frequency calculations were performed using the basis set used for optimization, and no negative frequencies were found for the structures reported.Synthesis details
The FeTPP, FeTPC, FeDEsP and FeDEsC complexes were synthesized following the reported procedures.23 The synthetic procedure of FeTEsP is described below:Diethyl 1H-pyrrole-3,4-dicarboxylate (DEspyr)
110 ml dry THF was added to potassium tertiary butoxide (15.57 g, 138.7 mmol) in a flask attached to a Schlenk line in a N2 atmosphere. A solution of tosyl methyl isocyanide (TosMIC) (13.5 g, 69.4 mmol) and diethyl fumarate (10 ml, 69.4 mmol) in 60 ml dry THF was prepared and added dropwise to the flask kept in an ice water bath. Stirring was continued for 6 to 7 hours at room temperature. Then THF was evaporated and the reaction was quenched using saturated NH4Cl solution. The mixture was worked up with ethyl acetate and dried over Na2SO4 and evaporated through a rotary evaporator. Purification was done by recrystallization from methanol. Crystals obtained were washed with cold ethyl acetate. 1H NMR (CDCl3): δ (ppm) 1.30 (t, 6H), 4.25 (q, 4H), 7.38 (d, 2H), 10.57 (bs, 1H). 13C {1H} NMR (CDCl3): δ (ppm) 14.33, 60.26, 115.39, 126.59, 166.42. ESI-MS (positive ion mode, CH3CN): m/z 234.05 (100%; [M + Na]+), 212.09 (45%; [M + H]+), 250.05 (30%; [M + K]+).Tetraethyl 2,2′-(phenylmethylene)bis(1H-pyrrole-3,4-dicarboxylate) (TEsbpyr)
p-Toluenesulphonic acid (0.89 g, 4.7 mmol) and MgSO4 (0.23 g, 1.9 mmol) were taken in a flask. Benzaldehyde (194 μl, 1.9 mmol) was added to it in a N2 atmosphere. The solid mixture was heated under vacuum until yellow colouration. Then THF (2 ml) was added and it was heated for 5 minutes. Then a solution of DEsPyr (1 g, 4.7 mmol) in dry CHCl3 was added to it. The solution was refluxed for 5 hours. The reaction was quenched using concentrated NaOH solution and was worked up with dichloromethane. The organic layer was dried over Na2SO4, evaporated through a rotary evaporator and was dissolved in a minimum amount of DCM and charged on a GF-254 silica gel preparative TLC plate and eluted with 30% ethyl acetate–hexane mixture. The product band was scratched off and extracted with ethyl acetate. 1H NMR (CDCl3): δ (ppm) 1.14 (t, 6H), 1.33 (t, 6H), 4.03 (q, 4H), 4.26 (q, 4H), 6.27 (s, 1H), 6.88 (d, 2H), 7.22 (m, 5H), 10.64 (bs, 2H), 1.26, 2.04, 4.12 (for EtOAc). 13C {1H} NMR (CDCl3): δ (ppm) 13.75, 14.26, 40.51, 60.11, 61.08, 113.21–139.15, 164.01, 167.00. ESI-MS (positive ion mode, CH3CN): m/z 533.35 (100%; [M + Na]+), 549.34 (45%; [M + K]+), 511.38 (35%; [M + H]+).Tetraethyl 5,5′-(phenylmethylene)bis(2-formyl-1H-pyrrole-3,4-dicarboxylate) (TEsbpyr-dial)
POCl3 (450 μl, 4.8 mmol) was added slowly to DMF (380 μl, 4.8 mmol) taken in a flask and kept in an ice bath to form the Vilsmeier–Haack reagent. The reagent was dissolved in DCE, degassed and then added dropwise to another flask containing TEsbpyr (250 mg, 0.48 mmol) in DCE keeping the flask on ice bath in a N2 atmosphere. The reaction mixture was degassed for 15 minutes and then refluxed for 5 hours. The reaction was monitored by TLC after charring the TLC plate using 2,4-DNP solution. The reaction was then quenched by adding a saturated solution of sodium acetate and worked up with dichloromethane. The organic layer was dried over Na2SO4, evaporated through a rotary-evaporator and purified by column chromatography on silica gel (100–200 mesh) with EtOAc: toluene (1![[thin space (1/6-em)]](https://www.rsc.org/images/entities/char_2009.gif) :
:![[thin space (1/6-em)]](https://www.rsc.org/images/entities/char_2009.gif) 10). 1H NMR(CDCl3): δ (ppm) 1.21 (t, 6H), 1.39 (t, 6H), 4.15 (q, 4H), 4.40 (q, 4H), 6.72 (s, 1H), 7.01 (d, 2H), 7.26 (m, 5H), 9.92 (s, 2H), 11.35 (bs, 2H). 13C {1H} NMR (CDCl3): δ (ppm) 13.97, 14.23, 29.63, 40.43, 114.19–139.67, 163.12, 164.87, 180.80. ESI-MS (positive ion mode, CH3CN): 589.66 (75%, [M + Na]+), 605.65 (25%, [M + K]+), 567.65 (10%,[M + H]+).
10). 1H NMR(CDCl3): δ (ppm) 1.21 (t, 6H), 1.39 (t, 6H), 4.15 (q, 4H), 4.40 (q, 4H), 6.72 (s, 1H), 7.01 (d, 2H), 7.26 (m, 5H), 9.92 (s, 2H), 11.35 (bs, 2H). 13C {1H} NMR (CDCl3): δ (ppm) 13.97, 14.23, 29.63, 40.43, 114.19–139.67, 163.12, 164.87, 180.80. ESI-MS (positive ion mode, CH3CN): 589.66 (75%, [M + Na]+), 605.65 (25%, [M + K]+), 567.65 (10%,[M + H]+).
5-Phenyldipyrromethane
5-Phenyldipyrromethane was synthesized following the reported protocol.79Tetraethylesterdiphenylporphyrin (TEsP)
TEsbpyr-dial (200 mg, 0.36 mmol) and 5-phenyldipyrromethane (79.5 mg, 0.36 mmol) were taken in a round bottom flask. Propionic acid (70 ml) was added and the system was refluxed for 30 minutes. The acid was distilled out from the reaction mixture. The solid product obtained was washed with warm water to remove the remaining acid. It was then dissolved in dichloromethane, dried over Na2SO4 and evaporated through a rotary-evaporator. Polypyrrole formed during the reaction was removed through column chromatography on silica gel (100–200 mesh) with EtOAc-hexane (1![[thin space (1/6-em)]](https://www.rsc.org/images/entities/char_2009.gif) :
:![[thin space (1/6-em)]](https://www.rsc.org/images/entities/char_2009.gif) 4). The product was purified by a second column chromatography using 0.1% dichloromethane–methanol (99
4). The product was purified by a second column chromatography using 0.1% dichloromethane–methanol (99![[thin space (1/6-em)]](https://www.rsc.org/images/entities/char_2009.gif) :
:![[thin space (1/6-em)]](https://www.rsc.org/images/entities/char_2009.gif) 1) mixture. 1H NMR(CDCl3): δ (ppm) −2.31 (br s, 1H), −2.05 (br s, 1H), 1.38 (t, 6H), 1.61 (t, 6H), 4.05 (t, 4H), 4.76 (q, 4H), 7.64–8.20 (m, 10H), 8.97 (d, 2H), 9.36 (d, 2H), 11.23 (s, 2H). 13C {1H} NMR (CDCl3): δ (ppm) 13.92, 14.56, 22.83, 29.50, 29.84, 61.96, 62.10, 106.44, 119.45–141.19, 146.99, 151.09, 164.70, 166.85. ESI-MS (positive ion mode, CH3CN): m/z 751.11 (50%, [M + H]+).
1) mixture. 1H NMR(CDCl3): δ (ppm) −2.31 (br s, 1H), −2.05 (br s, 1H), 1.38 (t, 6H), 1.61 (t, 6H), 4.05 (t, 4H), 4.76 (q, 4H), 7.64–8.20 (m, 10H), 8.97 (d, 2H), 9.36 (d, 2H), 11.23 (s, 2H). 13C {1H} NMR (CDCl3): δ (ppm) 13.92, 14.56, 22.83, 29.50, 29.84, 61.96, 62.10, 106.44, 119.45–141.19, 146.99, 151.09, 164.70, 166.85. ESI-MS (positive ion mode, CH3CN): m/z 751.11 (50%, [M + H]+).
FeTEsP
TEsP (30 mg, 0.04 mmol) was dissolved in dry THF (15 ml), 2,4,6-collidine (20.8 μl, 0.16 mmol) was added under a N2 atmosphere to generate the porphyrin base. Then FeBr2 (34.5 mg, 0.16 mmol) was added to it. The reaction mixture was stirred for 10 h at room temperature and the progress of the reaction was monitored by TLC. On full conversion, THF was evaporated using a rotary evaporator and workup was done using dichloromethane and HCl (to remove excess FeBr2 as FeCl4−). The organic layer was dried over Na2SO4, evaporated through a rotary-evaporator and purified by column chromatography on silica gel (100–200 mesh) with 3.5% dichloromethane–methanol (96.5![[thin space (1/6-em)]](https://www.rsc.org/images/entities/char_2009.gif) :
:![[thin space (1/6-em)]](https://www.rsc.org/images/entities/char_2009.gif) 3.5). 1H NMR-paramagnetic (CDCl3): δ (ppm) 75.99, 79.94, 81.83. ESI-MS (positive ion mode, CH3CN): m/z 804.86 (100%, [M]+).
3.5). 1H NMR-paramagnetic (CDCl3): δ (ppm) 75.99, 79.94, 81.83. ESI-MS (positive ion mode, CH3CN): m/z 804.86 (100%, [M]+).
ZnTEsP
TEsP (30 mg, 0.04 mmol) was dissolved in dry THF (15 ml). 2,4,6-Collidine (20.8 μl, 0.16 mmol) was added to generate the porphyrin base. Then Zn(OAc)2 (29.35 mg, 0.16 mmol) was added to it. The reaction mixture was stirred for 10 h and the progress of the reaction was monitored by TLC. On full conversion, THF was evaporated and it was purified by column chromatography on silica gel (100–200 mesh) with 0.3% dichloromethane–methanol (99.7![[thin space (1/6-em)]](https://www.rsc.org/images/entities/char_2009.gif) :
:![[thin space (1/6-em)]](https://www.rsc.org/images/entities/char_2009.gif) 0.3). 1H NMR (CDCl3): δ (ppm) −2.31.07 (t, 3H), 1.38 (t, 3H), 3.28 (q, 2H), 4.34 (q, 2H), 6.94–8.21 (m, 10H), 8.95 (d, 2H), 9.25 (d, 2H), 10.66 (s, 2H). 13C {1H} NMR (CDCl3): δ (ppm) 13.54, 14.42, 61.42, 61.70, 106.79, 119.79–144.89, 151.35, 153.86, 164.47, 167.10. ESI-MS (positive ion mode, CH3CN): m/z 835.04 (100%, [M + Na]+), 812.09 (80%, [M]).
0.3). 1H NMR (CDCl3): δ (ppm) −2.31.07 (t, 3H), 1.38 (t, 3H), 3.28 (q, 2H), 4.34 (q, 2H), 6.94–8.21 (m, 10H), 8.95 (d, 2H), 9.25 (d, 2H), 10.66 (s, 2H). 13C {1H} NMR (CDCl3): δ (ppm) 13.54, 14.42, 61.42, 61.70, 106.79, 119.79–144.89, 151.35, 153.86, 164.47, 167.10. ESI-MS (positive ion mode, CH3CN): m/z 835.04 (100%, [M + Na]+), 812.09 (80%, [M]).
Conflicts of interest
The authors declare no competing financial interests.Acknowledgements
This research is funded by the Council of Scientific and Industrial Research (CSIR) Grant 01(2874)/17/EMR-II and Department of Science and Technology grant SERB/EMR/008063. S.A. acknowledges CSIR-SRF. Ms Paramita Saha is greatly acknowledged for her help in the synthesis.References
- B. A. Averill, Chem. Rev., 1996, 96, 2951–2964 CrossRef CAS PubMed.
- L. B. Maia and J. J. G. Moura, Chem. Rev., 2014, 114, 5273–5357 CrossRef CAS PubMed.
- C. Moreno-Vivián, P. Cabello, M. Martínez-Luque, R. Blasco and F. Castillo, J. Bacteriol., 1999, 181, 6573 CrossRef.
- O. Einsle, A. Messerschmidt, R. Huber, P. M. H. Kroneck and F. Neese, J. Am. Chem. Soc., 2002, 124, 11737–11745 CrossRef CAS PubMed.
- S. Rinaldo, G. Giardina, N. Castiglione, V. Stelitano and F. Cutruzzolà, Biochem. Soc. Trans., 2011, 39, 195 CrossRef CAS PubMed.
- Y. Shiro, BBA, Biochim. Biophys. Acta, Bioenerg., 2012, 1817, 1907–1913 CrossRef CAS PubMed.
- K. Brown, K. Djinovic-Carugo, T. Haltia, I. Cabrito, M. Saraste, J. G. Moura, I. Moura, M. Tegoni and C. Cambillau, J. Biol. Chem., 2000, 275, 41133–41136 CrossRef CAS PubMed.
- S. Teraguchi and T. C. Hollocher, J. Biol. Chem., 1989, 264, 1972–1979 CAS.
- O. Einsle, A. Messerschmidt, R. Huber, P. M. H. Kroneck and F. Neese, J. Am. Chem. Soc., 2002, 124, 11737–11745 CrossRef CAS PubMed.
- S. J. George, J. W. A. Allen, S. J. Ferguson and R. N. F. Thorneley, J. Biol. Chem., 2000, 275, 33231–33237 CrossRef CAS PubMed.
- D. Bykov and F. Neese, JBIC, J. Biol. Inorg. Chem., 2012, 17, 741–760 CrossRef CAS.
- K. Kobayashi, A. Koppenhöfer, S. J. Ferguson, N. J. Watmough and S. Tagawa, Biochemistry, 2001, 40, 8542–8547 CrossRef CAS PubMed.
- M. Radoul, D. Bykov, S. Rinaldo, F. Cutruzzolà, F. Neese and D. Goldfarb, J. Am. Chem. Soc., 2011, 133, 3043–3055 CrossRef CAS PubMed.
- S. Rinaldo, M. Brunori and F. Cutruzzolà, Biochem. Biophys. Res. Commun., 2007, 363, 662–666 CrossRef CAS PubMed.
- C. E. Cooper, BBA, Biochim. Biophys. Acta, Bioenerg., 1999, 1411, 290–309 CrossRef CAS.
- T. K. Das, E. K. Wilson, F. Cutruzzolà, M. Brunori and D. L. Rousseau, Biochemistry, 2001, 40, 10774–10781 CrossRef CAS PubMed.
- X. J. Zhao, V. Sampath and W. S. Caughey, Biochem. Biophys. Res. Commun., 1994, 204, 537–543 CrossRef CAS PubMed.
- J. C. Maxwell and W. S. Caughey, Biochemistry, 1976, 15, 388–396 CrossRef CAS PubMed.
- S. Rinaldo, K. A. Sam, N. Castiglione, V. Stelitano, A. Arcovito, M. Brunori, J. W. A. Allen, S. J. Ferguson and F. Cutruzzolà, Biochem. J., 2011, 435, 217 CrossRef CAS PubMed.
- J. S. Olson and G. N. Phillips, J. Biol. Chem., 1996, 271, 17593–17596 CrossRef CAS PubMed.
- M. Ikeda-Saito, Y. Dou, T. Yonetani, J. S. Olson, T. Li, R. Regan and Q. H. Gibson, J. Biol. Chem., 1993, 268, 6855–6857 CAS.
- D. S. Bohle and C.-H. Hung, J. Am. Chem. Soc., 1995, 117, 9584–9585 CrossRef CAS.
- S. Amanullah, P. Saha, R. Saha and A. Dey, Inorg. Chem., 2019, 58, 152–164 CrossRef CAS.
- O. Einsle, P. Stach, A. Messerschmidt, J. Simon, A. Kröger, R. Huber and P. M. H. Kroneck, J. Biol. Chem., 2000, 275, 39608–39616 CrossRef CAS PubMed.
- D. Nurizzo, M.-C. Silvestrini, M. Mathieu, F. Cutruzzolà, D. Bourgeois, V. Fülöp, J. Hajdu, M. Brunori, M. Tegoni and C. Cambillau, Structure, 1997, 5, 1157–1171 CrossRef CAS PubMed.
- M. G. Almeida, C. M. Silveira, B. Guigliarelli, P. Bertrand, J. J. G. Moura, I. Moura and C. Léger, FEBS Lett., 2007, 581, 284–288 CrossRef CAS PubMed.
- D. Bykov and F. Neese, JBIC, J. Biol. Inorg. Chem., 2011, 16, 417–430 CrossRef CAS PubMed.
- S. E. J. Bowman and K. L. Bren, Nat. Prod. Rep., 2008, 25, 1118–1130 RSC.
- C. K. Chang and W. Wu, J. Biol. Chem., 1986, 261, 8593–8596 CAS.
- A. M. Stolzenberg, S. H. Strauss and R. H. Holm, J. Am. Chem. Soc., 1981, 103, 4763–4778 CrossRef CAS.
- S. Ozawa, E. Sakamoto, Y. Watanabe and I. Morishima, J. Chem. Soc., Chem. Commun., 1994, 935–936, 10.1039/C39940000935.
- Y. Liu and M. D. Ryan, Inorg. Chim. Acta, 1994, 225, 57–66 CrossRef CAS.
- Y. Liu, C. DeSilva and M. D. Ryan, Inorg. Chim. Acta, 1997, 258, 247–255 CrossRef CAS.
- C. K. Chang, K. M. Barkigia, L. K. Hanson and J. Fajer, J. Am. Chem. Soc., 1986, 108, 1352–1354 CrossRef CAS.
- S. Ozawa, E. Sakamoto, T. Ichikawa, Y. Watanabe and I. Morishima, Inorg. Chem., 1995, 34, 6362–6370 CrossRef CAS.
- D. W. Feng, Y. S. Ting and M. D. Ryan, Inorg. Chem., 1985, 24, 612–617 CrossRef CAS.
- E. Fujita and J. Fajer, J. Am. Chem. Soc., 1983, 105, 6743–6745 CrossRef CAS.
- D. Lancon and K. M. Kadish, J. Am. Chem. Soc., 1983, 105, 5610–5617 CrossRef CAS.
- C. K. Chang and J. Fajer, J. Am. Chem. Soc., 1980, 102, 848–851 CrossRef CAS.
- M. H. Barley and T. J. Meyer, J. Am. Chem. Soc., 1986, 108, 5876–5885 CrossRef CAS PubMed.
- M. H. Rahman and M. D. Ryan, Inorg. Chem., 2017, 56, 3302–3309 CrossRef CAS PubMed.
- Y. Liu and M. D. Ryan, J. Electroanal. Chem., 1994, 368, 209–219 CrossRef CAS.
- I. K. Choi, Y. Liu, D. Feng, K. J. Paeng and M. D. Ryan, Inorg. Chem., 1991, 30, 1832–1839 CrossRef CAS.
- M. R. Kumar, D. Pervitsky, L. Chen, T. Poulos, S. Kundu, M. S. Hargrove, E. J. Rivera, A. Diaz, J. L. Colón and P. J. Farmer, Biochemistry, 2009, 48, 5018–5025 CrossRef CAS PubMed.
- R. Lin and P. J. Farmer, J. Am. Chem. Soc., 2000, 122, 2393–2394 CrossRef CAS.
- L. E. Goodrich, S. Roy, E. E. Alp, J. Zhao, M. Y. Hu and N. Lehnert, Inorg. Chem., 2013, 52, 7766–7780 CrossRef CAS PubMed.
- C. K. Chang, Biochemistry, 1980, 19, 1971–1976 CrossRef CAS PubMed.
- C.-B. Wang and C. K. Chang, Synthesis, 1979, 1979, 548–549 CrossRef.
- S. Amanullah, P. K. Das, S. Samanta and A. Dey, Chem. Commun., 2015, 51, 10010–10013 RSC.
- J. K. Laha, S. Dhanalekshmi, M. Taniguchi, A. Ambroise and J. S. Lindsey, Org. Process Res. Dev., 2003, 7, 799–812 CrossRef CAS.
- L. W. Olson, D. Schaeper, D. Lancon and K. M. Kadish, J. Am. Chem. Soc., 1982, 104, 2042–2044 CrossRef CAS.
- L. A. Bottomley and K. M. Kadish, Inorg. Chem., 1981, 20, 1348–1357 CrossRef CAS.
- M. D. Bartberger, W. Liu, E. Ford, K. M. Miranda, C. Switzer, J. M. Fukuto, P. J. Farmer, D. A. Wink and K. N. Houk, Proc. Natl. Acad. Sci. U.S.A, 2002, 99, 10958 CrossRef CAS PubMed.
- J. Pellegrino, S. E. Bari, D. E. Bikiel and F. Doctorovich, J. Am. Chem. Soc., 2010, 132, 989–995 CrossRef CAS PubMed.
- L. E. Goodrich, F. Paulat, V. K. K. Praneeth and N. Lehnert, Inorg. Chem., 2010, 49, 6293–6316 CrossRef CAS PubMed.
- A. P. Hunt and N. Lehnert, Acc. Chem. Res., 2015, 48, 2117–2125 CrossRef CAS PubMed.
- K. M. Vogel, P. M. Kozlowski, M. Z. Zgierski and T. G. Spiro, J. Am. Chem. Soc., 1999, 121, 9915–9921 CrossRef CAS.
- C. M. Coyle, K. M. Vogel, T. S. Rush, P. M. Kozlowski, R. Williams, T. G. Spiro, Y. Dou, M. Ikeda-Saito, J. S. Olson and M. Z. Zgierski, Biochemistry, 2003, 42, 10342 CrossRef CAS.
- S. Rinaldo, A. Arcovito, M. Brunori and F. Cutruzzolà, J. Biol. Chem., 2007, 282, 14761–14767 CrossRef CAS PubMed.
- A. L. Speelman and N. Lehnert, Acc. Chem. Res., 2014, 47, 1106–1116 CrossRef CAS PubMed.
- Z. Wei and M. D. Ryan, Inorg. Chem., 2010, 49, 6948–6954 CrossRef CAS PubMed.
- A. E. Servid, A. L. McKay, C. A. Davis, E. M. Garton, A. Manole, P. S. Dobbin, M. A. Hough and C. R. Andrew, Biochemistry, 2015, 54, 3320–3327 CrossRef CAS PubMed.
- J. J. Warren, T. A. Tronic and J. M. Mayer, Chem. Rev., 2010, 110, 6961–7001 CrossRef CAS PubMed.
- D. D. M. Wayner and V. D. Parker, Acc. Chem. Res., 1993, 26, 287–294 CrossRef CAS.
- V. Shafirovich and S. V. Lymar, Proc. Natl. Acad. Sci. U.S.A, 2002, 99, 7340 CrossRef CAS PubMed.
- M. A. Rhine, A. V. Rodrigues, R. J. B. Urbauer, J. L. Urbauer, T. L. Stemmler and T. C. Harrop, J. Am. Chem. Soc., 2014, 136, 12560–12563 CrossRef CAS PubMed.
- M. Ali, N. Stein, Y. Mao, S. Shahid, M. Schmidt, B. Bennett and A. A. Pacheco, J. Am. Chem. Soc., 2019, 141, 13358–13371 CrossRef CAS PubMed.
- M. C. Silvestrini, M. G. Tordi, G. Musci and M. Brunori, J. Biol. Chem., 1990, 265, 11783–11787 CAS.
- T. Vangberg and A. Ghosh, J. Am. Chem. Soc., 1999, 121, 12154–12160 CrossRef CAS.
- W. R. Scheidt, H. F. Duval, T. J. Neal and M. K. Ellison, J. Am. Chem. Soc., 2000, 122, 4651–4659 CrossRef CAS.
- E. G. Abucayon, R. L. Khade, D. R. Powell, Y. Zhang and G. B. Richter-Addo, J. Am. Chem. Soc., 2016, 138, 104–107 CrossRef CAS PubMed.
- E. G. Abucayon, R. L. Khade, D. R. Powell, M. J. Shaw, Y. Zhang and G. B. Richter-Addo, Dalton Trans., 2016, 45, 18259–18266 RSC.
- N. G. Connelly, P. T. Draggett, M. Green and T. A. Kuc, J. Chem. Soc., Dalton Trans., 1977, 70–73, 10.1039/DT9770000070.
- T. C. Harrop, Z. J. Tonzetich, E. Reisner and S. J. Lippard, J. Am. Chem. Soc., 2008, 130, 15602–15610 CrossRef CAS PubMed.
- M. J. Frisch, Version C.02, Gaussian, Inc., 2004 Search PubMed.
- R. Krishnan, J. S. Binkley, R. Seeger and J. A. Pople, J. Chem. Phys., 1980, 72, 650–654 CrossRef CAS.
- A. D. McLean and G. S. Chandler, J. Chem. Phys., 1980, 72, 5639–5648 CrossRef CAS.
- M. Cossi, N. Rega, G. Scalmani and V. Barone, J. Comput. Chem., 2003, 24, 669–681 CrossRef CAS PubMed.
- B. J. Littler, M. A. Miller, C.-H. Hung, R. W. Wagner, D. F. O'Shea, P. D. Boyle and J. S. Lindsey, J. Org. Chem, 1999, 64, 1391–1396 CrossRef CAS.
Footnote |
| † Electronic supplementary information (ESI) available: Additional NMR, mass, UV-vis and FTIR data, and coordination of the DFT-optimized structures (PDF). CCDC 1854376 (FeDEsP), 1854377 (ZnDEsC) and 1959224 (ZnTEsP). For ESI and crystallographic data in CIF or other electronic format see DOI: 10.1039/d0sc01625j |
| This journal is © The Royal Society of Chemistry 2020 |

