
 Open Access Article
 This Open Access Article is licensed under a Creative Commons Attribution-Non Commercial 3.0 Unported Licence
Water-induced formation of an alkali-ion dimer in cryptomelane nanorods†
Shaobo
Cheng‡
 a,
Vidushi
Sharma‡
bc,
Altug S.
Poyraz
de,
Lijun
Wu
a,
Xing
Li
f,
Amy C.
Marschilok
dgh,
Esther S.
Takeuchi
dgh,
Kenneth J.
Takeuchi
gh,
Marivi
Fernández-Serra
*bc and
Yimei
Zhu
*a
a,
Vidushi
Sharma‡
bc,
Altug S.
Poyraz
de,
Lijun
Wu
a,
Xing
Li
f,
Amy C.
Marschilok
dgh,
Esther S.
Takeuchi
dgh,
Kenneth J.
Takeuchi
gh,
Marivi
Fernández-Serra
*bc and
Yimei
Zhu
*a
aDepartment of Condensed Matter Physics and Materials Science, Brookhaven National Laboratory, Upton, NY 11973, USA. E-mail: zhu@bnl.gov
bDepartment of Physics and Astronomy, Stony Brook University, Stony Brook, NY 11794-3800, USA. E-mail: maria.fernandez-serra@stonybrook.edu
cInstitute for Advanced Computational Science, Stony Brook University, Stony Brook, NY 11794, USA
dEnergy Sciences Directorate, Brookhaven National Laboratory, Upton, NY 11973, USA
eDepartment of Chemistry and Biochemistry, Kennesaw State University, Kennesaw, GA 30144, USA
fSchool of Physics and Microelectronics, Zhengzhou University, Daxue Road 75, Zhengzhou, 450052, China
gDepartment of Chemistry, Stony Brook University, Stony Brook, NY 11794, USA
hDepartment of Materials Science and Chemical Engineering, Stony Brook University, Stony Brook, NY 11794, USA
First published on 29th April 2020
Abstract
Tunneled metal oxides such as α-Mn8O16 (hollandite) have proven to be compelling candidates for charge-storage materials in high-density batteries. In particular, the tunnels can support one-dimensional chains of K+ ions (which act as structure-stabilizing dopants) and H2O molecules, as these chains are favored by strong H-bonds and electrostatic interactions. In this work, we examine the role of water molecules in enhancing the stability of K+-doped α-Mn8O16 (cryptomelane). The combined experimental and theoretical analyses show that for high enough concentrations of water and tunnel-ions, H2O displaces K+ ions from their natural binding sites. This displacement becomes energetically favorable due to the formation of K2+ dimers, thereby modifying the stoichiometric charge of the system. These findings have potentially significant technological implications for the consideration of cryptomelane as a Li+/Na+ battery electrode. Our work establishes the functional role of water in altering the energetics and structural properties of cryptomelane, an observation that has frequently been overlooked in previous studies.
1 Introduction
The highly earth abundant and environmentally friendly manganese oxide compounds with a tunneled structure have drawn much attention in wide ranging applications in the realm of multiferroic materials, catalysts, super-capacitors, and batteries.1–6 Owing to the large [2 × 2] tunnel sizes, α-Mn8O16, which possesses a hollandite structure, could accommodate and reversibly insert/retract large species such as Na+, K+, Ag+ and H2O.7–13 As shown in Fig. 1a and b, potassium doped α-Mn8O16 (cryptomelane) contains a framework of edge and corner shared MnO6 octahedra.14,15 The relatively large ionic radius of K+ ions and the strong electrostatic repulsion between the adjacent K+ ions prevent full occupation of all the tunnel sites.16 Different from Ag+ ions with relatively small ionic radii occupying the 2a Wyckoff position, K+ ions can occupy the 2b Wyckoff position, because the 2b position has larger space (as shown in Fig. 1c).17,18 | ||
Fig. 1 Structure and microscopy observations of the cryptomelane nanorod. Perspective view of the cryptomelane atomic models from the (a) [001], (b) [104], and (c) [100] projection. Orange, purple, green, and yellow spheres represent K+ at 2b, K+ at 2a, Mn, and O, respectively. The thin black rectangle outlines the unit cell. Thick grey and orange lines in (b) and (c) outline the K+ (2b)–O2− and K+ (2a)–O2− bond, respectively. K+ (2b) bonds with 8 surrounding O2− with a bond length of 2.91 Å, while K+ (2a) forms bonds with 4 surrounding O2− with a bonding length of 2.56 Å. The red and blue arrows highlight Mn atoms adjacent to K+ (2b) and K+ (2a), respectively. (d) Typical high-resolution TEM image of a cryptomelane nanorod from the [1![[3 with combining macron]](https://www.rsc.org/images/entities/char_0033_0304.gif) 1] zone axis. The corresponding FFT result is also shown in the inset. (e) Selected area electron diffraction pattern acquired from the same nanorod, which shares a similar streaking feature with the FFT result in (d) due to the 2c ordering. Streaks at 1/2c are indicated by red arrows. 1] zone axis. The corresponding FFT result is also shown in the inset. (e) Selected area electron diffraction pattern acquired from the same nanorod, which shares a similar streaking feature with the FFT result in (d) due to the 2c ordering. Streaks at 1/2c are indicated by red arrows. | ||
To date, the question of how the filling of the tunnels might be modified by the presence of water has received very little attention, even despite the fact that water plays an important role in a wide spectrum of materials science studies.19,20 In battery chemistry, water molecules can act as a shielding component to facilitate ion diffusion and reduce polarization. Although the lattice positions of H2O within cryptomelane have not been analyzed in detail in previous studies, the presence of H2O has been inferred to affect the overall electrochemistry of the material.21 Previous research suggests that water can enhance the structural stability of host structures during reversible ion intercalation/deintercalation processes.22 Water can be removed from the sample by exposure to high temperatures, but exposure to aqueous solutions or even ambient air will result in the readsorption of water molecules.23,24 A strong electrostatic attraction exists between the O-lone pair of electrons of H2O and the K+ ions, making incorporation of H2O into the [2 × 2] tunnel favorable. Despite the obvious physical reasons to quantify the effects that water might have on the performance of these materials, the difficulty of producing, measuring and comparing samples with and without water has hindered further research in this direction.
In this work we investigate the impact of incorporating water and K+ into α-Mn8O16 using complementary approaches based on density functional theory (DFT) simulations and transmission electron microscopy (TEM) experiments. The experiments show evidence of the displacement of K+ ions from their natural 2b Wyckoff position to a 2a site upon hydration. Our simulations show that this displacement can occur only when there are enough H2O molecules in the channel, which compete with K+ ions to occupy the larger 2b sites. As a consequence the K+ ions not only move to the less favorable 2a sites, but do so by forming a di-cation molecule, which has a larger double ionization energy than the ionization energy of two independent K atoms.
The paper is organized as follows. We first briefly summarize the simulation and experimental methods used in the study. Then we present the experimental results, which evidence the K+ ion structural sites in samples with and without water content. The experiments are followed by a theoretical section where we analyze the interplay between K+ ions and H2O, and show that the incorporation of H2O into the tunnels induces a large displacement of the K+ ions thereby influencing their kinetics and mobility inside the tunnels. The DFT simulations provide an in-depth analysis of how different doping levels affect the structure and thermodynamics of the channels. Finally, a combined experimental and theoretical analysis section explaining each other's findings is presented.
2 Methods
Structural ab initio DFT calculations were performed using the Spanish Initiative for Electronic Simulations with Thousands of Atoms (SIESTA) code.25 The core electrons were described by norm-conserving pseudopotentials generated by the Troullier–Martins approach.26 A numerical atomic orbitals (NAO) basis set with double-ζ polarization was used for the valence electrons. In this work, we used the gradient-corrected exchange-correlation (XC) functional, vdW-BH, as implemented in SIESTA to include the effects of van der Waals interactions in the system.27 The unit cell lattice parameters for all the K- and H2O-doped hollandite structures were chosen to be a = b = 9.81 Å and c = 2.90 Å. The supercells were constructed by stacking 2 to 5 unit cells of α-Mn8O16 along the c-axis to obtain various concentrations of dopants (K+ and H2O) in the tunnel. The convergence of structural geometries and forces was tested for a 2 × 2 × 10 Monkhorst–Pack k grid and an energy cutoff of 350 Ry. The structures were fully optimized such that both the atomic positions and lattice vectors were relaxed until the remnant forces in the system were less than 0.04 eV Å−1.The transmission electron microscopy work was conducted at Brookhaven National Laboratory with a JEOL ARM-200 CF machine. The HAADF images were acquired with the collection angle from 67 to 275 mrad. The cryptomelane nanorods were synthesized using hydrothermal methods and the chemical component is identified by inductive coupled plasma (ICP) as K0.8Mn8O16·yH2O.28 The dry samples were further annealed at 200 °C under ∼10−4 Torr vacuum for 1 day in the sealed furnace.
3 Results and discussion
3.1 Experimental results
A high resolution TEM image of a hydrated cryptomelane nanorod is presented in Fig. 1d. Individual rods share similar morphologies with an average diameter of 20–50 nm and an average length of several micrometers. The nanorod is single-crystalline with its long axis along the [001] direction. The selected area electron diffraction (SAED) pattern for this nanorod is shown in Fig. 1e. The extra streaks in the SAED pattern, as marked by the red arrows, along the [001]* direction can be observed and located at the center of the hk0 row and the hk1 (or hk![[1 with combining macron]](https://www.rsc.org/images/entities/char_0031_0304.gif) ) row, indicating a 2c (c: c-lattice parameter) ordering along the [001] direction. Given the presence of water, water and K+ ions should be alternately arranged along the c direction, forming 2c ordering. The elongation of the streaks along the hk0 direction indicates that the coherent length of the ordered structure is short along in-plane (or ab) directions. The streaks can also be observed in the Fast Fourier Transform (FFT) result as shown in the upper-right corner inset of Fig. 1d, consistent with the SAED result.
) row, indicating a 2c (c: c-lattice parameter) ordering along the [001] direction. Given the presence of water, water and K+ ions should be alternately arranged along the c direction, forming 2c ordering. The elongation of the streaks along the hk0 direction indicates that the coherent length of the ordered structure is short along in-plane (or ab) directions. The streaks can also be observed in the Fast Fourier Transform (FFT) result as shown in the upper-right corner inset of Fig. 1d, consistent with the SAED result.
The typical high angle annular dark field scanning transmission electron microscopy (HAADF-STEM) images of dry and hydrated cryptomelane nanorods are compared in Fig. 2a and b, respectively. To improve the signal-to-noise ratio, the images are averaged over several small units, as shown in Fig. 2a and b, indicated by red circles. Fig. 2c and d are the corresponding averaged images from Fig. 2a and b with 90° rotation, whose intensity values are indicated by the blue-green-red-yellow-white color map in the ascending order. One typical feature of an HAADF-STEM image is that the image contrast is proportional to Z1.7, where Z is the effective atomic number.3,29 Mn has the largest atomic number (ZMn = 25) in the crystal, and thus exhibits the strongest contrast. Projected along the [100] direction, the Mn adjacent to K+ (2a) appears to have a higher contrast than the one adjacent to K+ (2b) due to its overlapping with 3 surrounding O atoms as shown in Fig. 1c. In Fig. 2a and c, there is no contrast at the 2a site (adjacent to the strong contrast Mn), but a weak contrast at the 2b site (adjacent to the weak contrast Mn). Fig. 2g shows the intensity profiles of the Mn column (red) and tunnel (green dots), respectively, with no obvious peak at the 2a site. These indicate that K+ ions in dry samples only occupy the 2b sites in this region. For further verification, we performed HAADF-STEM image simulations based on the multi-slice method with the frozen phonon approximation. A K0.8Mn8O16 atomic model with K+ (occupancy = 0.4) at 2b was used for the HAADF-STEM image simulations. The simulated image and intensity profile are presented in Fig. 2e and the black line in Fig. 2g, respectively, consistent with the experimental results. It is worth mentioning that a “dry sample” does not mean that it is entirely devoid of water. However, a small amount of water does not affect the observations here.
 | ||
| Fig. 2 Comparison of dry and hydrated cryptomelane nanorods from the in-plane direction. (a) Typical HAADF image of a cryptomelane nanorod. (b) HAADF image for hydrated cryptomelane. Both images were recorded along the [100] direction. (c) and (d) Averaged images over 5 units in (a) and (b), as marked by red circles in (a) and (b). The averaged images are rotated 90° with respect to the original STEM images. The images are shown in false color with intensity values indicated by the blue-green-red-yellow-white color map in an ascending order. (e) and (f) Simulated images of the structural model with thicknesses of (e) 32 nm and (f) 42 nm. In (e), 0.4 K+ ions occupy 2b sites. In (f), 0.7 H2O molecules occupy 2b sites, 0.2 K+ ions occupy 2b sites and 0.2 K+ ions occupy 2a sites, respectively. (g) Intensity profiles of horizontal scan lines shown in (c)–(f). The dark-red and orange lines are from the Mn column (black horizontal lines in (c) and (d)), while the green and red dots are from the tunnels (orange lines in (c) and (d)). The black and blue lines are the calculated intensities of (e) and (f). The intensity is normalized for clarity. (h) An atomic model showing water located at the 2b site, with K+ at the 2a site. | ||
Fig. 2b shows the HAADF-STEM image for hydrated cryptomelane taken from the [100] direction. Similarly, Fig. 2d shows the corresponding averaged images of Fig. 2b with a 90° rotation. Apart from the contrast at the 2b site, the weak contrast also shows up at the 2a site, appearing as the small peaks at the 2a site in the intensity profile (red dots) in Fig. 2g. We notice that there are two oxygens overlapping at the 2b site for pristine α-Mn8O16, while there is no oxygen at the 2a site in the [100] projection (Fig. 1c). If the 2a site is occupied by H2O, the enhanced contrast will be weak, due to the low Z value of H2O. Therefore, the contrast at 2a sites indicates that relatively heavier atoms occupy the 2a sites. A series of image simulations suggest that there will be a noticeable contrast enhancement at the 2a site provided that only a certain amount of K+ ions occupy the 2a sites. The electron energy-loss spectroscopy (EELS) results acquired from both dry and hydrated samples are shown in Fig. S2, ESI.† The prepeaks of the O K edge in manganites reflect the concentration of oxygen.30 In the hydrated sample, the prepeak is higher, indicating more water in the hydrated nanorods.
The microtome method was adopted for preparing the samples to view along the [001] zone axis. The thickness of the microtome-prepared samples is set to be 80 nm and the corresponding HAADF-STEM image simulations are then carried out. The cross-section view of a typical dry cryptomelane nanorod is shown in Fig. 3a. The basic cryptomelane structure is clearly resolved, where K+ and eight surrounding Mn columns can be clearly observed. As opposed to Ag-doped hollandite, the intensity of K+ columns is almost unchanged, indicating that every tunnel is approximately uniform in occupancy.3 As shown in Fig. 3b for the hydrated sample, the intensity of K+ columns is overall brighter than that in Fig. 3a. This tunnel intensity enhancement is due to the higher occupation of water, since the doping levels of K+ ions are the same for both hydrated and dry samples. Fig. 3c and e are averaged images over Fig. 3a and b, respectively. To quantify the occupancy of water, a series of HAADF-STEM image simulations were carried out based on the structural model with different amounts of water. Fig. 3d and f are the resulting simulated images of K0.80Mn8O16 and K0.80Mn8O16·(1.40)H2O, respectively. Quantitative comparisons of the experimental and simulated atomic intensity profiles of K0.80Mn8O16·(1.40)H2O and K0.80Mn8O16 are plotted in Fig. 3g and h. The yellow and blue dots in Fig. 3g and h are the intensity profiles from the yellow and blue line areas in Fig. 3c and e. The black lines are the simulated intensity profiles from the same areas in Fig. 3d and f, which agree well with experimental findings. It is worth mentioning that the background intensities of HAADF-STEM images are non-zero. Thus the simulated images are calibrated and then compared with the experimental ones.
 | ||
| Fig. 3 High resolution HAADF-STEM images for hydrated and dry potassium cryptomelane nanorods viewed along the [001] zone axis. (a) High resolution experimental image of a typical microtome-prepared dry cryptomelane sample. All the tunnels are well-aligned and occupied. (b) The high-resolution image from the hydrated sample. (c) Averaged image from (a). (d) Simulated HAADF-STEM image for the K0.80Mn8O16 unit cell with 80 nm thickness. (e) Averaged image from (b). (f) Simulated image for K0.80Mn8O16·(1.40)H2O with 80 nm thickness along the [001] direction. (g) Yellow dots and the solid black line are intensity profiles for experimental and simulation results at the same position (i.e. dashed yellow line area in (c)), respectively. (h) Intensity profiles for the same area (i.e. blue dashed line area in (e)). The simulated relative intensity matches well with the experimental results. | ||
3.2 Theoretical calculations
The experimental findings can be explained by DFT-based studies, which crucially also furnish new insights into the physics of these doped structures. The Wyckoff position occupied by K+ inside the [2 × 2] α-Mn8O16 tunnels is identified, and the binding energy of K+ at its equilibrium position is computed for varying concentrations of H2O. Additionally, the binding energy of H2O at its optimal position in the large α-Mn8O16 tunnel is found with and without K+ ions inside the tunnel. We specify the K+ and H2O concentrations in terms of fractions per unit cell: the notation KxMn8O16·yH2O signifies x amounts of K+ and y amounts of H2O per unit cell of hollandite. The cells are extended along the c-axis (from 2 to 5 unit cells) to attain various dopant concentrations. The framework of α-Mn8O16 supports two [2 × 2] tunnels per unit cell, but all DFT calculations are performed for structures containing K+ and H2O in a single tunnel. Note that experiments consider the occupancy of the neighboring [2 × 2] tunnel as well, and moreover, a given sample shows dopants (K+ and H2O) present in both the tunnels. In our theoretical calculations however, we always keep one tunnel empty. We have confirmed that dopants in one tunnel do not influence the energetics or geometries of those present in the other tunnel (see Fig. S3, ESI†). We are therefore justified in inferring all possible energetics by combining results from multiple concentrations within a single tunnel. The number of dopants is varied ranging from a dilute limit, where the K+ concentration (x) in KxMn8O16·yH2O is x < 0.50 to a concentrated limit in which x > 0.50 in the hydrated tunnel. The concentration of water (y) is increased up to y = 1.00 in the dilute-K regime and up to y = 0.60 in the concentrated-K regime, in suitable steps of x and y.In cryptomelane (KxMn8O16), K+ ions prefer to adopt a ‘2b’ Wyckoff position inside the hollandite tunnel (x = 0.50, as shown in Fig. S4, ESI†). This is arguably the most energetically favorable position for K+ because it coordinates with a maximum number of oxygen(VIII) atoms from the surrounding α-Mn8O16 framework. The binding energy of K+ in K0.50Mn8O16 is found to be −4.528 eV. Similarly, in the hollandite structure containing water (Mn8O16·yH2O), H2O favors the tunnel-centered ‘2b’ Wyckoff site (y = 0.50, as shown in Fig. S5a, ESI†) but is weakly bound compared to K+. The binding energy of H2O in Mn8O16·(0.50)H2O is −0.212 eV. The large difference between the binding energies of K+ and H2O is attributed to the characteristically different forces that bind the two species to the hollandite structure. While K is ionized inside the tunnel (the binding energy of K is very close to its ionization potential) and is electrostatically bound to the O atoms belonging to the hollandite framework, the higher (less negative) binding energy of H2O reflects the formation of non-bonded interactions of hydrogen bond (H-bond) type. Upon increasing the concentration of H2O in the tunnel, an H-bond chain (Fig. S5b, ESI†), spiraling down the c-axis of the tunnel is formed, resulting in an increased binding (BEH2O = −0.475 eV for Mn8O16·(0.75)H2O). Therefore, H-bond cooperativity in water together with the one-dimensional α-Mn8O16 tunnel-structure largely favors the addition of water molecules to maximize their coordination.
On incorporating H2O and K+ into the same tunnel, the structural energetics and optimal dopant positions differ in the dilute and concentrated regimes. In the dilute limit (x, y < 0.50 in KxMn8O16·yH2O), both H2O and K+ occupy ‘2b’ Wyckoff positions (x, y = 0.50, in Fig. S5c, ESI†) and the resultant structure is more stable, consistent with the 2c ordering seen in Fig. 1d and e. Water creates a solvation shell around K+ and the lone-pair of electrons (from H2O) proximate to K+ ions further improves the coordination environment of the optimally positioned K+. Additionally, water binds to K+ and lowers its binding energy. These dopant positions are quite robust but depend on their relative concentrations. K+ prefers to maintain its more favorable ‘2b’ position at lower concentrations of water. The energy profile inside a K0.50Mn8O16·(0.50)H2O tunnel (Fig. S6, ESI†) is consistent with this observation. In the presence of multiple K+ ions and H2O molecules in the tunnel, water is preferentially trapped between the recurring K+ ions, minimizing the electrostatic repulsion between them. This, in turn, enables us to incorporate more K+ ions into the structure and approach the concentrated regime without compromising the energetics of the system.
In the high-concentration regime, our DFT based geometry optimization reveals that H2O displaces K+ from a ‘2b’ to a ‘2a’ Wyckoff position, in agreement with experimental results. The structure in Fig. 4a, that is, K0.80Mn8O16·(0.40)H2O, displays a concentration closest to what is experimentally realized. The two H2O molecules not only mimic each other's orientation in the tunnel, but also play a very similar role. In particular, they solvate the K ions above and below, and push the inner central K+ ions toward the ‘2a’ site that was originally unfavorable at lower dopant concentrations. We therefore propose a necessary condition for water to displace K+ from its originally favored position, namely that the combined fractional concentration of the dopants in the tunnel should exceed 1. Equivalently, the total number of K+ and H2O combined inside a hollandite tunnel should exceed the available ‘2b’ sites in the tunnel. In this setting, it is energetically viable for K+ to be shifted to a ‘2a’ site, where the lack of O-coordination from the surrounding Mn8O16 framework is compensated by water. Water, on the other hand, prefers to remain at its ‘2b’ position, frequently forming an H-bond with the neighboring O of the enclosing Mn8O16 framework. In all our calculations the Mn8O16 framework was allowed to relax, and the screening of K+ is achieved by a combination of both water (dominant) and small but necessary structural changes of the atoms within the channel.
 | ||
| Fig. 4 Results from DFT simulations of hydrated cryptomelane. (a) K0.80Mn8O16·(0.40)H2O: four K+ and two H2O in five unit cells of α-Mn8O16 in a single tunnel, shown along the a-axis. The two outer K+ ions occupy ‘2b’ sites; the two inner K+ ions are displaced by H2O molecules to ‘2a’ sites. One H2O solvates two K+ ions – one above and one below. (b) Mean charge density plot for K0.80Mn8O16·(0.40)H2O from the [100] axis, showing the displacement of K+ ions from ‘2b’ to ‘2a’ sites by H2O molecules inside the tunnel. The tunnel-centered sites corresponding to red-colored charge densities are ‘2b’ sites, while those corresponding to yellow densities are ‘2a’ sites. (c) Binding energy of K+ at varying concentrations of H2O for KxMn8O16·yH2O. The blue, orange and green curves indicate low-K+ concentrations; red, purple and brown indicate high-K+ concentrations in the tunnel. Experimentally realized concentrations are closest to the brown curve. | ||
The binding energy profile for KxMn8O16·yH2O is plotted in Fig. 4c. For low K+ concentrations (x ≤ 0.50) inside the α-Mn8O16 tunnel, the minimum value of the binding energy is attained for equal concentrations of H2O and K+ inside the tunnel. By contrast, for higher K+ concentrations (x > 0.50), the binding energy minimum is attained at lower H2O concentrations in the tunnel. This is due to the excess of dopants in the tunnel. K+ has a relatively larger ionic radius (2.80 Å) and enriching the tunnel with K+ and H2O leads to an overall increase in energy due to steric effects. However, it is found that in K-rich hollandite, water – in low amounts – stabilizes the structure relative to structures containing no water. Additionally, as shown in Fig. S8, ESI,† H2O does not facilitate the transport of K+ ions inside the α-Mn8O16 tunnels, and overall, tends to stabilize K+ ions in the originally chosen favorable coordination environment. Fig. 4 shows results computed via DFT, for the case of dopants occupying only one [2 × 2] hollandite tunnel. Results of double-channel occupancy for configurations comparable with experiments are presented in Table 1. These are systems in which the dopant concentration in one of the tunnels is restricted to [K+] = 0.80 and [H2O] = 0.40. The neighboring tunnel contains K+ and H2O with concentrations denoted by the region in Fig. 4c, shaded in brown color. In particular, K0.80Mn8O16·(1.40)H2O in Table 1 corresponds to [K+] = 0.80 and [H2O] = 0.40 in the first tunnel, whereas in the second tunnel, one has [H2O] = 1 and no K+.
| [K] | [H2O] | [BEK (eV)] |
|---|---|---|
| 0.80 | 1.40 | −3.621 |
| 1.05 | 0.65 | −4.689 |
| 1.05 | 0.90 | −4.301 |
| 1.05 | 1.15 | −4.059 |
| 1.13 | 0.73 | −4.443 |
| 1.13 | 1.07 | −3.987 |
| 1.30 | 0.65 | −4.256 |
| 1.30 | 0.90 | −4.361 |
| 1.47 | 0.73 | −4.049 |
| 1.55 | 0.65 | −4.089 |
3.3 Analysis and physical origin of the ion displacement
Both experimental and simulation results indicate that K ions are displaced to ‘2a’ sites for high enough water content. However, this displacement is difficult to explain considering the strong coulombic repulsion that the ions will experience in this location. In order to establish the main driving force behind the displacement of K to ‘2a’ sites, we analyze the charge distribution in a channel with the displaced K configuration. Two different pairs of K atoms may be identified, namely a translated Ka⋯Ka pair occupying ‘2a’ sites, and a Kb⋯Kb pair occupying the originally favored ‘2b’ sites. K atoms are ionized (oxidized) within the tunnel, becoming K+. The lost electron is delocalized over the neighboring O atoms from the surrounding hollandite framework. However, when two K atoms are stabilized in such close proximity as it happens in our system – where da = 2.62 Å and db = 2.98 Å – their interactions can give rise to the homonuclear ion K2+. This would imply that the actual charge in the cryptomelane tunnels is less than the nominal amount of K atoms in the tunnel. This suggested formation of K2+, an elusive and highly unstable species, is facilitated by the presence of water in the tunnels. The H2O molecules provide not only a sufficient amount of electrostatic screening between the K⋯K pairs, but also make the formation of K2+ energetically viable. One might expect a similar outcome when the tunnels are doped with Li+/Na+, which will deteriorate the performance of α-Mn8O16. These large cations dimerize, and consequently, the effective charge is lower than the stoichiometric charge of the system.10As already evident in Fig. 4b, some charge is localized between the two Ka⋯Ka atoms in the tunnel, but this is not so for the Kb⋯Kb pair. To explicate its origin, we analyze the variation in charge densities of the two distinct ion pairs by examining the shared charge along the bonding direction. In first-principles electronic structure simulations, charge transfer or charge localization is frequently ill-defined and their accurate determination is nontrivial. This is because the latter requires an arbitrary partitioning or redistribution of the density – which cannot be done in a unique way – despite the availability of several approaches for charge localization analyses.31 Hence in what follows, we explicitly compute the difference between electron densities of the fully occupied (K0.80Mn8O16·(0.40)H2O) and the partially filled – that is, without Ka atoms (resp. Kb atoms) – hollandite tunnels to map the charge distribution due to the Ka⋯Ka (resp. Kb⋯Kb) pair. Fig. 5 shows the charge redistribution when the K⋯K pairs lose their electrons (red isosurface) to the O atoms of the hollandite (blue isosurface). The lost electron is shared uniformly by the nearest O atoms as depicted by the symmetric blue regions in Fig. 5(a)–(d). The extent of delocalization of the lost charge depends on the K+ position, that is ‘2a’ vs. ‘2b’. The ‘2b’ site provides a greater number of nearest O-neighbors and consequently, a higher degree of charge delocalization. The system remains overall charge-neutral. The charge densities around the two H2O molecules indicate a strong electrostatic interaction between K+ and H2O. We then compute the integrated charge densities for a region of fixed-length along the c-axis, denoted by Q(r), and given by
 | (1) |
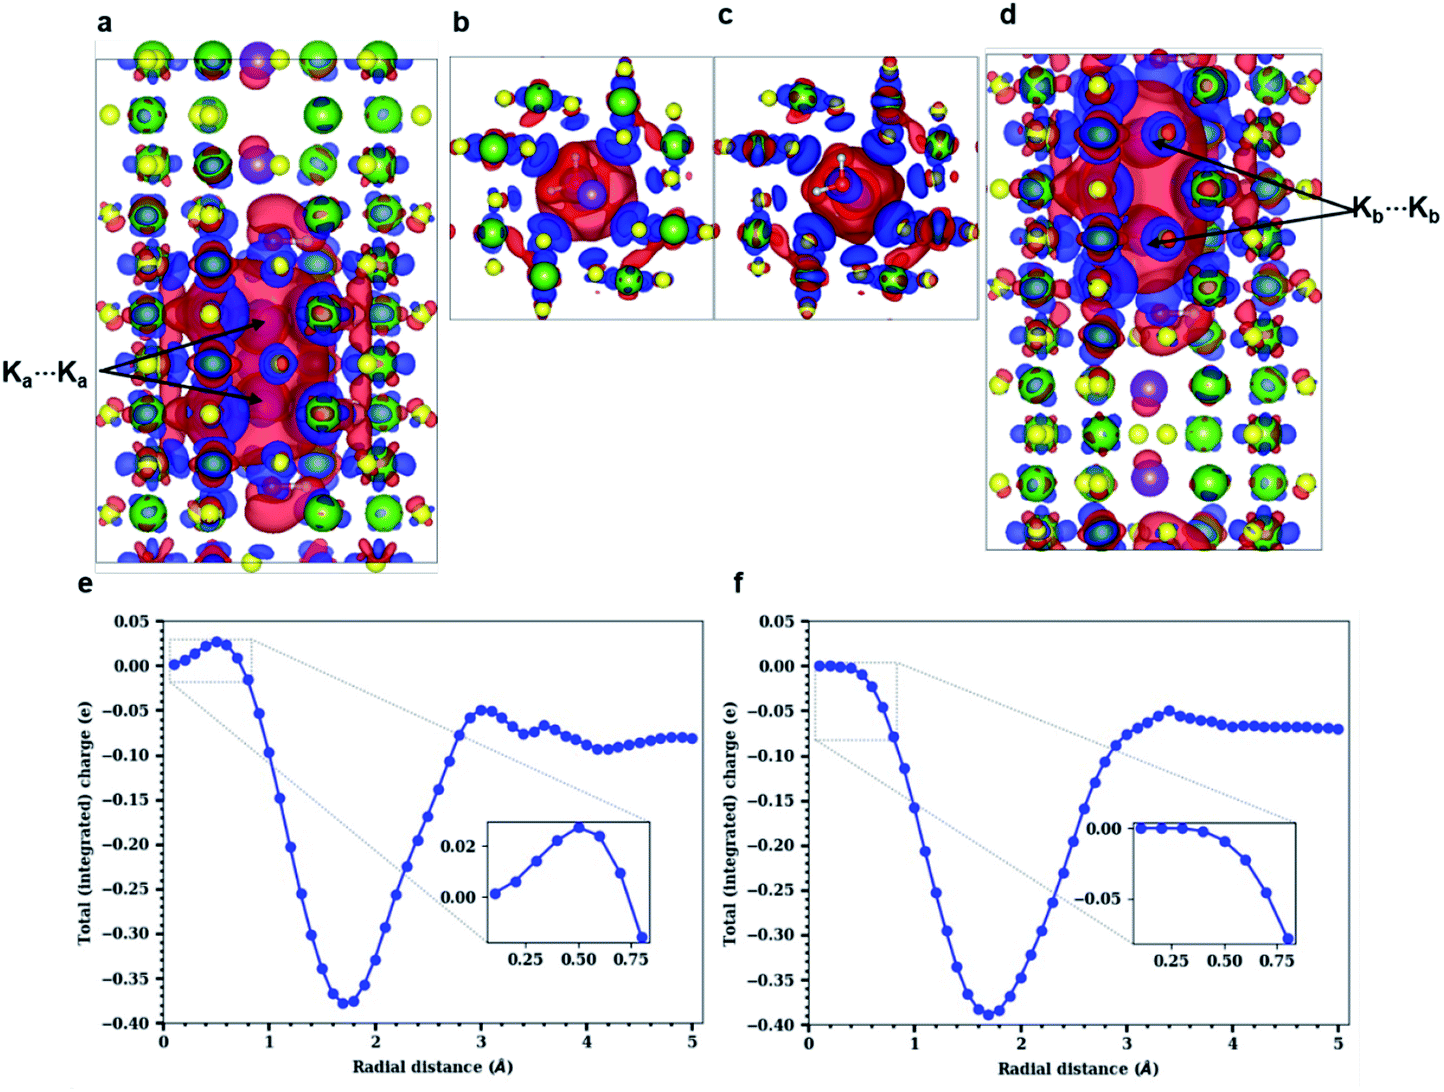 | ||
| Fig. 5 Charge distribution around K⋯K pairs shown by isosurfaces (cutoff = 0.001 e au−3) and integrated charge densities. (a)–(d) Blue regions indicate positive isosurface (electronic charge accumulation); red regions indicate negative isosurface (electronic charge depletion). The charge density of the Ka⋯Ka pair occupying ‘2a’ sites is shown along (a) a-, and (b) c-axes, and of the Kb⋯Kb pair occupying ‘2b’ sites is shown along (c) c-, and (d) a-axes. H2O separates and coordinates with the Ka⋯Ka and Kb⋯Kb pairs. Integrated charge computed for the (e) Ka⋯Ka pair, (f) Kb⋯Kb pair. The insets in (e) and (f) compare the charge behavior in Ka⋯Ka and Kb⋯Kb pairs. | ||
These simulation results confirm and further explain the experimental observations. We note that experiments as well as DFT studies establish the ‘2b’ Wyckoff position as the preferred site for K+ ions inside the hollandite tunnels (see Fig. 2(e) and S4 in the ESI†) for low K+ concentrations. K+ ions are maximally stabilized at the ‘2b’ site due to an optimal coordination from the O atoms of the surrounding Mn8O16 framework. From the energy profile, it is evident that transitioning from a ‘2b’ to a ‘2a’ site requires an uphill climb along the energy surface (see Fig. S6, ESI†). However, STEM images – acquired at high dopant concentration – reveal the displacement of K+ ions to the ‘2a’ sites. Our simulation results demonstrate that this is indeed possible at such high dopant concentration. Two K+ ions are stabilized in the tunnel by the formation of a K2+ dimer, which arises only when there is enough water in the channel. Although the bound nature of the ion pair is not accessible to the experiments presented here, the fact that K+ ions occupy the ‘2a’ sites confirms that such a bound pair exists.
4 Conclusions
Combining high resolution transmission electron microscopy and density functional theory calculations, a quasi-one-dimensional water–K+ chain has been identified within one-dimensional tunneled cryptomelane nanorods. We have shown that despite the strong binding energy of K+ ions in well-defined crystallographic sites inside the channel, the presence of water molecules can nevertheless modify coordination sites. They strongly interact with the ions in the channel, altering their transport properties and even reducing the charge of the channels, by facilitating the formation of dicationic molecules which are more difficult to doubly ionize than single isolated atoms. This is due to both the electrostatic coupling between water molecules and ions, as well as the tunneled structure, which is itself modified in attaining the energy-minima of the system. These results illustrate that the role of water in tunnel-like crystallographic structures of battery materials is significant and should be taken into consideration in such studies. Our results can also provide helpful insights into the mechanisms of emergent functional properties in the field of high-density batteries. Finally, observations about the effects of water stimulate further theoretical discussion about water-related phenomena in tunneled materials.Conflicts of interest
There are no conflicts to declare.Acknowledgements
Electron microscopy work at BNL was supported by the U.S. Department of Energy, Office of Basic Energy Science, Division of Materials Science and Engineering, under Contract No. DE-SC0012704. Material synthesis and the DFT studies associated with the water and potassium occupancy as described in Fig. 4 were supported by the Center for Mesoscale Transport Properties, an Energy Frontier Research Center funded by the U.S. Department of Energy, Office of Science, Basic Energy Science, under award #DESC0012673. The DFT studies associated with the K⋯K ion pair distribution as shown in Fig. 5 were supported by DOE grant DE-SC0001137. We thank Stony Brook Research Computing and Cyberinfrastructure, and the Institute for Advanced Computational Science at Stony Brook University for access to the high-performance SeaWulf computing system, which was made possible by a $1.4M National Science Foundation grant (#1531492).Notes and references
- S. Liu, A. R. Akbashev, X. Yang, X. Liu, W. Li, L. Zhao, X. Li, A. Couzis, M.-G. Han, Y. Zhu, L. Krusin-Elbaum, J. Li, L. Huang, S. J. L. Billinge, J. E. Spanier and S. O'Brien, Sci. Rep., 2014, 4, 6203 CrossRef CAS PubMed.
- J. Luo, Q. Zhang, J. Garcia-Martinez and S. L. Suib, J. Am. Chem. Soc., 2008, 130, 3198–3207 CrossRef CAS PubMed.
- L. Wu, F. Xu, Y. Zhu, A. B. Brady, J. Huang, J. L. Durham, E. Dooryhee, A. C. Marschilok, E. S. Takeuchi and K. J. Takeuchi, ACS Nano, 2015, 9, 8430–8439 CrossRef CAS PubMed.
- A. Boisset, L. Athouël, J. Jacquemin, P. Porion, T. Brousse and M. Anouti, J. Phys. Chem. C, 2013, 117, 7408–7422 CrossRef CAS.
- L. M. Housel, L. Wang, A. Abraham, J. Huang, G. D. Renderos, C. D. Quilty, A. B. Brady, A. C. Marschilok, K. J. Takeuchi and E. S. Takeuchi, Acc. Chem. Res., 2018, 51, 575–582 CrossRef CAS PubMed.
- X. Li, M. Sun, X. Wei, C. Shan and Q. Chen, Nanomaterials, 2018, 8, 188 CrossRef PubMed.
- Y. Yuan, C. Zhan, K. He, H. Chen, W. Yao, S. Sharifi-Asl, B. Song, Z. Yang, A. Nie, X. Luo, H. Wang, S. M. Wood, K. Amine, M. S. Islam, J. Lu and R. Shahbazian-Yassar, Nat. Commun., 2016, 7, 13374 CrossRef CAS PubMed.
- X. Chen, Y.-F. Shen, S. L. Suib and C. L. O'Young, Chem. Mater., 2002, 14, 940–948 CrossRef CAS.
- D. Portehault, S. Cassaignon, E. Baudrin and J.-P. Jolivet, Chem. Mater., 2007, 19, 5410–5417 CrossRef CAS.
- A. S. Poyraz, J. Huang, S. Cheng, L. Wu, X. Tong, Y. Zhu, A. C. Marschilok, K. J. Takeuchi and E. S. Takeuchi, J. Electrochem. Soc., 2017, 164, A1983 CrossRef CAS.
- D. A. Tompsett and M. S. Islam, Chem. Mater., 2013, 25, 2515–2526 CrossRef CAS.
- E. Cockayne and L. Li, Chem. Phys. Lett., 2012, 544, 53–58 CrossRef CAS.
- M. Kaltak, M. Fernández-Serra and M. S. Hybertsen, Phys. Rev. Mater., 2017, 1, 075401 CrossRef.
- J. Vicat, E. Fanchon, P. Strobel and D. Tran Qui, Acta Crystallogr., Sect. B: Struct. Sci., 1986, 42, 162–167 CrossRef.
- S.-Y. Lee, L. Wu, A. S. Poyraz, J. Huang, A. C. Marschilok, K. J. Takeuchi, E. S. Takeuchi, M. Kim and Y. Zhu, Adv. Mater., 2017, 29, 1703186 CrossRef PubMed.
- Y. Yuan, A. Nie, G. M. Odegard, R. Xu, D. Zhou, S. Santhanagopalan, K. He, H. Asayesh-Ardakani, D. D. Meng, R. F. Klie, C. Johnson, J. Lu and R. Shahbazian-Yassar, Nano Lett., 2015, 15, 2998–3007 CrossRef CAS PubMed.
- K. J. Takeuchi, S. Z. Yau, M. C. Menard, A. C. Marschilok and E. S. Takeuchi, ACS Appl. Mater. Interfaces, 2012, 4, 5547–5554 CrossRef CAS PubMed.
- J. E. Post, R. B. Von Dreele and P. R. Buseck, Acta Crystallogr., Sect. B: Struct. Sci., 1982, 38, 1056–1065 CrossRef.
- M. Sun, X. Li, Z. Tang, X. Wei and Q. Chen, Nanoscale, 2018, 10, 19733–19741 RSC.
- J. Guo, X. Meng, J. Chen, J. Peng, J. Sheng, X.-Z. Li, L. Xu, J.-R. Shi, E. Wang and Y. Jiang, Nat. Mater., 2014, 13, 184–189 CrossRef CAS PubMed.
- J. Huang, A. S. Poyraz, K. J. Takeuchi, E. S. Takeuchi and A. C. Marschilok, Chem. Commun., 2016, 52, 4088–4091 RSC.
- K. W. Nam, S. Kim, S. Lee, M. Salama, I. Shterenberg, Y. Gofer, J.-S. Kim, E. Yang, C. S. Park, J.-S. Kim, S.-S. Lee, W.-S. Chang, S.-G. Doo, Y. N. Jo, Y. Jung, D. Aurbach and J. W. Choi, Nano Lett., 2015, 15, 4071–4079 CrossRef CAS PubMed.
- A. S. Poyraz, J. Huang, B. Zhang, A. C. Marschilok, K. J. Takeuchi and E. S. Takeuchi, MRS Adv., 2017, 2, 407–412 CrossRef CAS.
- C. S. Johnson, J. Power Sources, 2007, 165, 559–565 CrossRef CAS.
- J. M. Soler, E. Artacho, J. D. Gale, A. García, J. Junquera, P. Ordejón and D. Sánchez-Portal, J. Phys.: Condens. Matter, 2002, 14, 2745–2779 CrossRef CAS.
- N. Troullier and J. L. Martins, Phys. Rev. B: Condens. Matter Mater. Phys., 1991, 43, 1993–2006 CrossRef CAS PubMed.
- K. Berland and P. Hyldgaard, Phys. Rev. B: Condens. Matter Mater. Phys., 2014, 89, 035412 CrossRef.
- A. S. Poyraz, J. Huang, C. J. Pelliccione, X. Tong, S. Cheng, L. Wu, Y. Zhu, A. C. Marschilok, K. J. Takeuchi and E. S. Takeuchi, J. Mater. Chem. A, 2017, 5, 16914–16928 RSC.
- S. Cheng, C. Xu, S. Deng, M.-G. Han, S. Bao, J. Ma, C. Nan, W. Duan, L. Bellaiche, Y. Zhu and J. Zhu, Sci. Adv., 2018, 4(5), eaar4298 CrossRef PubMed.
- S. Cheng, M. Li, Q. Meng, W. Duan, Y. G. Zhao, X. F. Sun, Y. Zhu and J. Zhu, Phys. Rev. B, 2016, 93, 054409 CrossRef.
- B. Silvi and A. Savin, Nature, 1994, 371, 683–686 CrossRef CAS.
Footnotes |
| † Electronic supplementary information (ESI) available. See DOI: 10.1039/d0sc01517b |
| ‡ These authors contributed equally to this work. |
| This journal is © The Royal Society of Chemistry 2020 |