 Open Access Article
First-generation species-selective chemical probes for fluorescence imaging of human senescence-associated β-galactosidase†
Xiaokang
Li‡
 a,
Wenjing
Qiu‡
a,
Jinwen
Li‡
a,
Wenjing
Qiu‡
a,
Jinwen
Li‡
 a,
Xi
Chen‡
b,
Yulu
Hu
b,
Ying
Gao
b,
Donglei
Shi
a,
Xinming
Li
a,
Huiling
Lin
a,
Zelan
Hu
a,
Guoqiang
Dong
c,
Chunquan
Sheng
c,
Bei
Jiang
d,
Conglong
Xia
d,
Chu-Young
Kim
a,
Xi
Chen‡
b,
Yulu
Hu
b,
Ying
Gao
b,
Donglei
Shi
a,
Xinming
Li
a,
Huiling
Lin
a,
Zelan
Hu
a,
Guoqiang
Dong
c,
Chunquan
Sheng
c,
Bei
Jiang
d,
Conglong
Xia
d,
Chu-Young
Kim
 e,
Yuan
Guo
 *b and
Jian
Li
 *ad
*ad
aState Key Laboratory of Bioreactor Engineering, Shanghai Key Laboratory of New Drug Design, School of Pharmacy, East China University of Science and Technology, Shanghai 200237, China. E-mail: jianli@ecust.edu.cn
bKey Laboratory of Synthetic and Natural Functional Molecule of the Ministry of Education, College of Chemistry and Materials Science, Northwest University, Xi'an 710127, China. E-mail: guoyuan@nwu.edu.cn
cSchool of Pharmacy, Second Military Medical University, Shanghai 200433, China
dInstitute of Materia Medica, College of Pharmacy and Chemistry, Dali University, Dali 671000, China
eDepartment of Chemistry and Biochemistry, The University of Texas at El Paso, El Paso, Texas 79968, USA
First published on 17th June 2020
Abstract
Human senescence-associated β-galactosidase (SA-β-gal), the most widely used biomarker of aging, is a valuable tool for assessing the extent of cell ‘healthy aging’ and potentially predicting the health life span of an individual. Human SA-β-gal is an endogenous lysosomal enzyme expressed from GLB1, the catalytic domain of which is very different from that of E. coli β-gal, a bacterial enzyme encoded by lacZ. However, existing chemical probes for this marker still lack the ability to distinguish human SA-β-gal from β-gal of other species, such as bacterial β-gal, which can yield false positive signals. Here, we show a molecular design strategy to construct fluorescent probes with the above ability with the aid of structure-based steric hindrance adjustment catering to different enzyme pockets. The resulting probes normally work as traditional SA-β-gal probes, but they are unique in their powerful ability to distinguish human SA-β-gal from E. coli β-gal, thus achieving species-selective visualization of human SA-β-gal for the first time. NIR-emitting fluorescent probe KSL11 as their representative further displays excellent species-selective recognition performance in biological systems, which has been herein verified by testing in senescent cells, in lacZ-transfected cells and in E. coli-β-gal-contaminated tissue sections of mice. Because of our probes, it was also discovered that SA-β-gal content in mice increased gradually with age and SA-β-gal accumulated most in the kidneys among the main organs of naturally aging mice, suggesting that the kidneys are the organs with the most severe aging during natural aging.
Introduction
Aging is the time-dependent decline in physiological function that affects all living organisms, and is also the most serious risk factor for numerous non-communicable diseases.1–3 Biomarkers of aging can help researchers narrow their research scope to specific biological levels when explaining the biological processes behind aging or aging-related diseases.4–6 Since the progressive accumulation of senescent cells is an important contributing factor toward aging,7–10 markers of cellular senescence play a crucial role in probing aging in which senescence-associated β-galactosidase (SA-β-gal), the most widely used biomarker today, is the gold standard for senescence detection.11,12Detection of senescent cells relies on 5-bromo-4-chloro-3-indolyl-β-D-galactopyranoside (X-gal), a commonly used chromogenic substrate for SA-β-gal, but it is limited to use in vitro or in fixed cells.11,13 Fluorescence imaging is thought to be a powerful approach for tracing biomarkers in vivo because of its high sensitivity, non-invasive nature, and good spatial and temporal resolution.14–19 As a result, several fluorescence-based probes for the detection of this enzymatic activity have been developed by introducing the galactosidic bond in the β configuration as an SA-β-gal recognition site.20–25 However, the probes designed by this strategy can only achieve the indiscriminate recognition of β-galactosidase (β-gal). To the best of our knowledge, none of them is capable of distinguishing SA-β-gal from β-gal of different species, especially the selective identification of human endogenous β-gal rather than exogenous bacterial β-gal, which is essential for precisely tracking aging because of the bacterial infection that occurs commonly and remains a challenge.
Human SA-β-gal is an endogenous lysosomal enzyme expressed from GLB1, a gene that found in most mammals. In the field of human β-gal recognition, E. coli β-gal, a bacterial enzyme encoded by lacZ, was routinely applied as the substitute enzyme of human β-gal in vitro,26,27 as well as lacZ-transfected cells enriched by E. coli β-gal were commonly used as model organisms.26–31 However, unlike human β-gal, bacterial β-gal is neither a lysosomal enzyme nor associated with senescence.20,32,33 Although human β-gal shares a similar catalytic mechanism with E. coli β-gal, by comparing their catalytic domains, we found that this domain of human β-gal was very different from that of E. coli β-gal (pink for human β-gal, yellow for E. coli β-gal, RMSD = 6.236 Å), while it was very similar to that of its homologous Aspergillus oryzae (A. oryzae, a fungus) β-gal (pink for human β-gal, cyan for A. oryzae β-gal, RMSD = 1.002 Å) (Fig. 1).34 Therefore, the structural difference of β-gal from various species should be carefully considered for constructing β-gal probes. We propose here that A. oryzae β-gal is a more suitable SA-β-gal model than E. coli β-gal, which has been confirmed by our following experimental results.
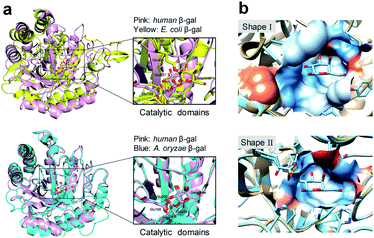 | ||
| Fig. 1 Comparison of protein structures of β-gal from different species. (a) Superimposition of the catalytic domains of E. coli β-gal and human β-gal (upper). Superimposition of the catalytic domains of A. oryzae β-gal and human β-gal (lower). (b) Shape I: shape of the binding pocket of human β-gal with galactose; Shape II: shape of the binding pocket of E. coli β-gal with galactose. The Ms volume, pocket Ms area, and mouth Ms area for human β-gal vs. E. coli β-gal are 457.2 Å3vs. 280.1 Å3, 231.1 Å2vs. 261.2 Å2, 86.4 Å2vs. 41.0 Å2, respectively. The pockets were analysed by CASTP.34 | ||
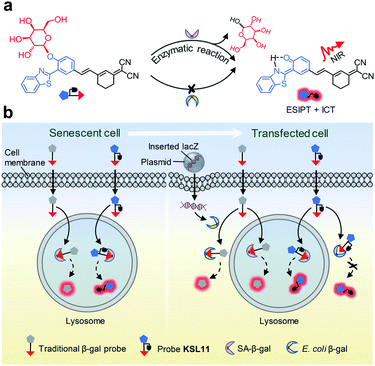
The aforementioned concerns encourage us to develop a fluorescence system for precisely tracking human SA-β-gal in natural aging biological samples, which relies on unprecedented fluorescent probes with the ability to selectively detect human SA-β-gal without interference from E. coli β-gal (Fig. 2). We now wish to introduce a design strategy to generate probes with the above ability, which builds on structure-based steric hindrance adjustment catering to the two different enzyme pockets and screening based on A. oryzae β-gal in vitro. Herein, we report on twelve novel probes KSL01–KSL12 with different steric hindrance around the recognition group G (Fig. 3). They can sensitively sense the endogenous SA-β-gal in living cells, and emit multicoloured fluorescence from green to near-infrared (NIR), providing a wide range of colour choice for various imaging requirements. More importantly, KSL08–KSL12 are successfully screened out because they desirably respond to A. oryzae β-gal but not E. coli β-gal, thus achieving species-selective visualization of β-gal for the first time. KSL11 as the representative of the first generation of species-selective probes shows powerful ability to distinguish SA-β-gal from E. coli β-gal, which has been herein verified by testing in senescent cells, in lacZ-transfected cells and in E. coli-β-gal-contaminated tissue sections of mice. Moreover, using KSL04 and KSL11, it was further discovered that SA-β-gal content in mice increased gradually with age and SA-β-gal accumulated most in kidneys among the main organs including lung, heart, muscle, brain, spleen, liver, and kidney, indicating that kidneys are the organs with the most severe aging during natural aging.
Results and discussion
Structure-based rational design to generate species-selective β-gal probes
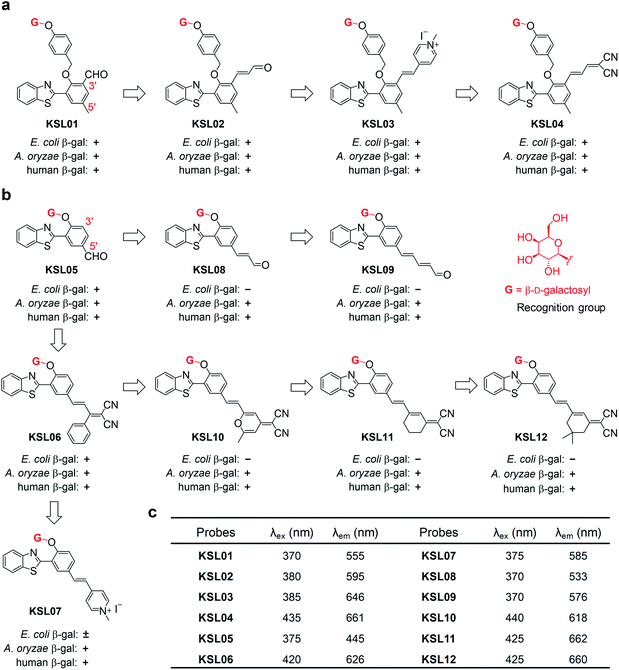
Since A. oryzae β-gal is a more suitable SA-β-gal model in vitro than E. coli β-gal, our first step was to develop probes that selectively recognize A. oryzae β-gal. We started with the 2-(2′-hydroxyphenyl)benzothiazole (HBT) scaffold due to its flexibility in structural modification and steric hindrance adjustment around the enzyme recognition group. Besides, HBT is one of the most common excited-state intramolecular proton transfer (ESIPT)-based fluorophores and characterized by several attractive innate features suitable for fluorescence imaging.35 The first probe KSL01 was designed in which a β-galactopyranoside unit carrying a self-immolative p-cresol linker was linked to the phenolic oxygen of HBT as the enzyme-triggered moiety, and an electron-withdrawing aldehyde group was introduced on the 3′-position of HBT skeleton to enhance the intramolecular charge transfer (ICT) effect (Fig. 3a). To investigate the binding ability of this HBT-based probe to β-galactosidase, a mutant E. coli β-gal with low catalytic activity and high structural conservatism was constructed. The crystal complex data revealed that KSL01 could successfully enter the catalytic pocket of β-gal (Fig. 4), which greatly inspired us to sequentially design probes based on HBT scaffold. Subsequently, KSL02–KSL04 were designed by extending the π-conjugate system and increasing the size of the electron-withdrawing group (EWG) of KSL01. However, KSL01–KSL04 all were unable to distinguish A. oryzae β-gal from E. coli β-gal in view of the existence of a p-cresol linker, which made the HBT fragment stay at the edge of the enzyme catalytic pocket and with a large extensible space.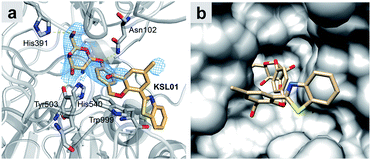 | ||
| Fig. 4 Crystal structure of E. coli β-gal E537Q in complex with KSL01 (PDB ID: 6KUZ). (a) Interaction network between E. coli β-gal E537Q and probe KSL01 in domain B, and the electron density for KSL01 in domain B (2Fo–2Fc map contoured at 1.0, blue mesh). Carbon atoms of the bound probe and protein are shown in orange and grey, respectively. Oxygen, nitrogen and sulphur atoms are shown in red, blue and yellow, respectively. Yellow dashed lines indicate hydrogen bonds. (b) Surface representation of E. coli β-gal E537Q domain B with KSL01. | ||
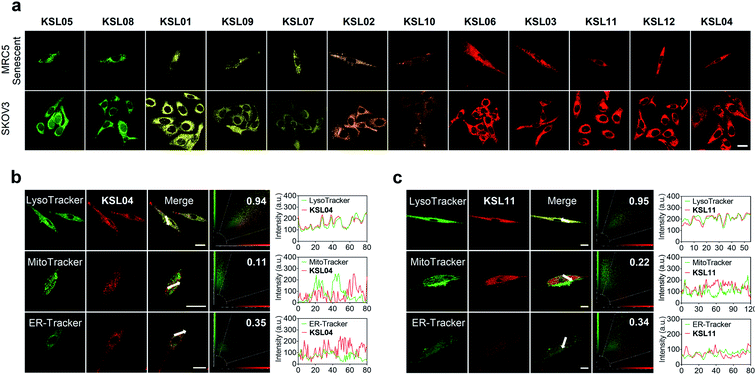
Further, probes KSL05–KSL07 were constructed in which the β-galactopyranoside unit was directly bound to the HBT phenolic oxygen atom and different sized EWGs were introduced on the 5′-position (Fig. 3b). It was worth noting that all of them could be hydrolysed by A. oryzae β-gal. Compared with KSL05 and KSL06, KSL07 exhibited unusual slow respond rate and incomplete hydrolysis to E. coli β-gal. Hence, we speculated that the length of the π-conjugate chain and the size of the 5′-substituents might jointly influence the enzyme-triggered hydrolysis reaction, and KSL08–KSL012 were constructed based on this conjecture by extending the π-conjugated chain of KSL05 and KSL06, respectively. As expected, they selectively recognized A. oryzae β-gal and barely responded to E. coli β-gal. The responses of probes to E. coli β-gal and A. oryzae β-gal were confirmed by in vitro optical analysis experiments by recording UV-vis absorption and fluorescence emission (Fig. 5 and S2–S4†). The responses of probes to human β-gal were confirmed by cell fluorescence imaging and the results revealed that all our probes worked well in human cells (Fig. 6a). All in all, we made full use of the structure-based “step by step” design strategy and eventually discovered the species-selective probes to distinguish human SA-β-gal from E. coli β-gal for the first time.
These HBT-based fluorescent probes were synthesized as outlined in the ESI† and unambiguously characterized (see ESI†).
Crystal structure of E. coli β-gal E537Q in complex with KSL01
In order to catch the fluorescent probes bound in E. coli β-gal crystals, we made the active site mutant E537Q for co-crystallization and obtained the crystals of this mutant in complex with fluorescent probe KSL01 (PDB ID: 6KUZ) (Fig. 4 and Table S1†). The resolution of this crystal structure is 2.83 Å with an R-work value of 0.1817 and an R-free of 0.2243 respectively. In each asymmetric unit of the crystal, there are four monomers of the protein, forming a compact tetramer, as illustrated in previous studies.36,37 This reinforces the functional importance of being a tetramer of E. coli β-gal. At the active sites of the four monomers, the electron densities of the fluorescent probe KSL01 inside the binding pocket can be contoured. However, the electron densities of the probes positioned outside of the binding pocket are absent presumably due to the flexibility of this part of the probe and less interactions with the protein. The probe inside binds in the “deeper mode”,37 and the flexible loop 794–803 is open. As presented in Fig. 4, there are several hydrogen bonds between the galactosyl part of the probe and the protein. In addition, there is a π–π stacking interaction between the benzyl ring of the probe and Trp999 from the protein. Thus, the design of the galactosyl part and the benzyl ring can help the binding of this fluorescent probe to E. coli β-gal. As a matter of fact, this probe can also be recognized by A. oryzae β-gal and human β-gal, and initially, the design of this p-cresol is to let it function as a linker. As shown in Fig. 4b, the p-cresol linker leads the other part of the fluorescent probe to a vast external space of the E. coli β-gal, which is the basis of why fluorescent probes KSL01–KSL04 could be recognized by E. coli β-gal. A similar hypothesis could be proposed for the mechanisms of recognition of these fluorescent probes by A. oryzae β-gal and human β-gal.Since the crystal structures of wild-type β-gal with galactose from the three species are all available, we were able to model the novel fluorescent probe KSL05 in the three structures and make a comparison. As shown in Fig. S1,†KSL05 can bind well to β-gal from all three species with no clashes, which means that the binding pocket is able to accept another heterocyclic ring. However, if we want to extend the terminal of this probe in the three structures, it is evident that the steric hindrance for the extended probe to bind to E. coli β-gal is larger than that for A. oryzae β-gal or human β-gal. This observation is in accordance with the discovery we found that fluorescent probes KSL08–KSL12 were able to respond to A. oryzae β-gal and human β-gal but not E. coli β-gal. These are the first reported fluorescent probes that can distinguish among β-gal from different species.
Spectroscopic properties and optical response to different species of β-gal
The absorption and emission spectra of probes KSL01–KSL12 before and after the addition of β-gal were investigated in physiological buffer solution (PBS![[thin space (1/6-em)]](https://www.rsc.org/images/entities/char_2009.gif) :
:![[thin space (1/6-em)]](https://www.rsc.org/images/entities/char_2009.gif) DMSO = 99
DMSO = 99![[thin space (1/6-em)]](https://www.rsc.org/images/entities/char_2009.gif) :
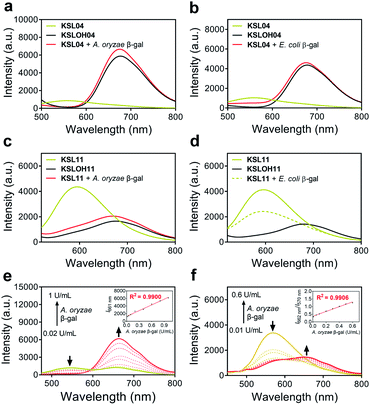
:![[thin space (1/6-em)]](https://www.rsc.org/images/entities/char_2009.gif) 1, v/v, pH 4.5 for A. oryzae β-gal, pH 7.4 for E. coli β-gal) (Fig. 5a–d and S2–S4†). Upon titration with 10 U mL−1A. oryzae β-gal, the twelve probes all exhibited light-up fluorescent signals and dramatic bathochromic shift of the maximum emission wavelength. As for titration with E. coli β-gal, KSL01–KSL06 showed similar results to titration with A. oryzae β-gal, KSL07 exhibited slow response rate and incomplete hydrolysis, while KSL08–KSL12 exhibited negligible fluorescence changes compared with the signals of probes alone, demonstrating that they selectively recognize A. oryzae β-gal but not E. coli β-gal. The plots of the fluorescence intensity ofKSL01–KSL12against different concentrations of A. oryzae β-gal all showed good linear relationship (with R2 greater than 0.99) (Fig. 5e, f and S5†). Moreover, these probes exhibited low limit of detection (2.61 × 10⁻⁵ to 9.29 × 10⁻² U mL−1, Table S2†), demonstrating their potential in detecting low concentration of endogenous β-gal. Meanwhile, the fluorescence quantum yields (ΦF) and molar extinction coefficients (ε) of all probes and their hydrolysates were calculated and summarized in Table S2† for comparison. Next, to evaluate the environment sensitivity of these probes, the influences of viscosity and polarity on them were examined respectively. To our delight, except for KSL10 which is sensitive to strong polarity, the other eleven probes did not show polarity or viscosity sensitivity (Fig. S6 and S7†). Better still, there are three probes with the maximum emission reaching near-infrared (KSL04, KSL11, KSL12, λem ≥ 660 nm, Fig. 3c). Among them, KSL04 was regarded as the representative of the traditional type of probes, and KSL11 was regarded as the representative of species-selective probes for its longest maximum emission wavelength at 662 nm. A further analysis on the data in Fig. 3 revealed the noticeable structure–activity relationship for these probes as follows: the maximum emission wavelength increased with the π-conjugation extension of the scaffolds; when a EWG was located at the 3′-position of HBT scaffold, they lost the species-selectivity; when the EWG was located at the 5′-position of HBT scaffold, their species-selectivity increased with the π-conjugation extension.
1, v/v, pH 4.5 for A. oryzae β-gal, pH 7.4 for E. coli β-gal) (Fig. 5a–d and S2–S4†). Upon titration with 10 U mL−1A. oryzae β-gal, the twelve probes all exhibited light-up fluorescent signals and dramatic bathochromic shift of the maximum emission wavelength. As for titration with E. coli β-gal, KSL01–KSL06 showed similar results to titration with A. oryzae β-gal, KSL07 exhibited slow response rate and incomplete hydrolysis, while KSL08–KSL12 exhibited negligible fluorescence changes compared with the signals of probes alone, demonstrating that they selectively recognize A. oryzae β-gal but not E. coli β-gal. The plots of the fluorescence intensity ofKSL01–KSL12against different concentrations of A. oryzae β-gal all showed good linear relationship (with R2 greater than 0.99) (Fig. 5e, f and S5†). Moreover, these probes exhibited low limit of detection (2.61 × 10⁻⁵ to 9.29 × 10⁻² U mL−1, Table S2†), demonstrating their potential in detecting low concentration of endogenous β-gal. Meanwhile, the fluorescence quantum yields (ΦF) and molar extinction coefficients (ε) of all probes and their hydrolysates were calculated and summarized in Table S2† for comparison. Next, to evaluate the environment sensitivity of these probes, the influences of viscosity and polarity on them were examined respectively. To our delight, except for KSL10 which is sensitive to strong polarity, the other eleven probes did not show polarity or viscosity sensitivity (Fig. S6 and S7†). Better still, there are three probes with the maximum emission reaching near-infrared (KSL04, KSL11, KSL12, λem ≥ 660 nm, Fig. 3c). Among them, KSL04 was regarded as the representative of the traditional type of probes, and KSL11 was regarded as the representative of species-selective probes for its longest maximum emission wavelength at 662 nm. A further analysis on the data in Fig. 3 revealed the noticeable structure–activity relationship for these probes as follows: the maximum emission wavelength increased with the π-conjugation extension of the scaffolds; when a EWG was located at the 3′-position of HBT scaffold, they lost the species-selectivity; when the EWG was located at the 5′-position of HBT scaffold, their species-selectivity increased with the π-conjugation extension.
Subsequently, we evaluated the reaction kinetics of KSL01–KSL12 upon the addition of 10 U mL−1A. oryzae β-gal, and the fluorescence intensity of all probes reached a plateau within 20 min, for some probes only dozens of seconds were needed (40 s to 20 min, Fig. S8†), implying that these probes might be applied for the rapid detection of β-gal. We next performed the Michaelis–Menten kinetics assays for the A. oryzae β-gal and the E. coli β-gal catalysed reactions. Based on the calculation of their Michaelis–Menten constants (Km), KSL04 bound well not only with A. oryzae β-gal (Km = 2.38 μM) but also with E. coli β-gal (Km = 7.64 μM), as shown in Fig. S9,† while KSL11 without reactivity against E. coli β-gal showed selective binding with A. oryzae β-gal (Km = 0.54 μM), as presented in Fig. S10.†
To evaluate the interference caused by other biological analytes, the selectivity of KSL04 and KSL11 for β-gal toward a variety of enzyme species, amino acids, and biomolecules was examined (Fig. S11†). The results showed that KSL04 reacted with E. coli β-gal and A. oryzae β-gal, KSL11 selectively reacted with A. oryzae β-gal but not E. coli β-gal, and neither of them responded to other biological analytes, such as esterase, pepsin, trypsin, cellulase, LZM, DTT, GSH, L-Cys, Hcy, and H2O2. In order to gain insight into the sensing mechanism of these probes to β-gal, high-resolution mass spectrometry (HRMS) experiments were performed. As illustrated in Fig. S13,† in the ensemble system of KSL04 and A. oryzae β-gal, the peak of cleavage product KSLOH04 was found at m/z 342.0770 for [M − H]−, and in the ensemble system of KSL11 and A. oryzae β-gal, the peak of KSLOH11 were found at m/z 394.1013 for [M − H]−. Furthermore, the aforementioned fluorescence spectra from reactions of these probes with β-gal resemble the spectra of cleavage products KSLOH01–KSLOH12, which also strongly supported the fact that the enzyme-triggered cleavage reaction caused the release of free KSLOH fluorophores. All these results collectively substantiated that these KSL probes could be hydrolysed by breaking the C–O galactosidic bond with β-gal to release the KSLOH fluorophores, similar to the sensing mechanism of reported β-gal probes.20,27 In addition, the released fluorophores KSLOH04 and KSLOH11 were stable over lysosomal pH ranges of 4.0–6.0 and after 30 min of continuous illumination (Fig. S12†).
Multicolour imaging of endogenous human β-gal in living cells
Encouraged by the favourable optical properties of KSL01–KSL12, we next evaluated their capabilities to image endogenous human β-gal in living cells. MRC5 cells (human diploid fibroblasts derived from lung tissue) were used as research objects because they gradually accumulated SA-β-gal with replicative senescence.38,39 Besides, SKOV3 cells with high expression of β-gal were chosen as positive references.22 All the probes exhibited low cytotoxicity at the tested concentration (10 μM) and enjoyed good biocompatibility toward the three cultured cell lines (Fig. S14–S16†). As shown in Fig. 6a, after incubation with KSL01–KSL12 separately, MRC5 and SKOV3 cells both exhibited bright fluorescence signals in the corresponding response channels of probe hydrolysates (Table S3†). The fluorophores released by the KSL01–KSL12 after enzyme-triggered hydrolysis showed a broad emission range from green to red, achieving multicolour imaging of endogenous β-gal in living cells and providing a variety of choices for different imaging requirements (Fig. S17†).To investigate the subcellular localization capacity, KSL04 and KSL11 were further examined in MRC5 cells by co-staining with commercially available LysoTracker (LysoGreen), MitoTracker Green FM, and ER-Tracker Green (Fig. 6b and c). The red channel fluorescence of probes KSL04 and KSL11 almost completely overlaps with the fluorescence of LysoTracker in the green channel, with Pearson's correlation coefficient (PCC) values of 0.94 and 0.95, respectively. However, the fluorescence in the red channel of the probes badly overlaps with the green channel of the other two subcellular trackers, with PCC values below 0.40. The correlation mapping of the fluorescence intensity also exhibited excellent colocalization between the probes and LysoTracker. These results demonstrated that KSL04 and KSL11 possessed excellent targeting abilities to the lysosome, wherein SA-β-gal was stored and accumulated in senescent cells.12,40
Quantifying the aging of cells and organs
The content of SA-β-gal gradually accumulates with aging,40 so the quantification of SA-β-gal can be utilized to evaluate the aging degree. To investigate the capabilities of our probes in quantifying cell senescence, MRC5 cells were continuously cultured until they nearly lost the ability of division and proliferation. The number of cell passages (P) was recoded to mark the degree of aging during the cell culture. Generally, both representative probes KSL04 and KSL11 can be used to detect SA-β-gal in MRC5 cells and KSL04 can operate in lower background signal and higher fluorescence quantum yield than KSL11. Only in infected or lacZ-transfected cells, the species-selective KSL11 is unique in its powerful ability to distinguish human endogenous SA-β-gal from bacterial β-gal. Therefore, we chose KSL04 to image the continuously cultured MRC5 cells with passage numbers ranging from 22 to 29. As shown in Fig. 7a and b, the fluorescence intensity gradually enhanced with the increase of passage number. The fluorescence signal was relatively weak and underwent subtle changes for P22 and P23 cells, and it began to rise dramatically from P24 to P27 and eventually reached a plateau at P28 and P29. Compared with P22 cells, the fluorescence intensity of P25 to P29 cells showed significant enhancement (Fig. 7a, b, and S18†). These results corresponded well with the data acquired by the X-gal staining assay (Fig. S19†). Therefore, KSL04 can be applied to quantify the content of endogenous SA-β-gal to characterize the cell aging degree, and show the potential to be used to establish a cellular model of evaluating anti-aging efficacy. Traditional anti-aging efficacy evaluations are mainly based on the life span of model animals, which is not only laborious but also time-consuming. For example, the average life span of Caenorhabditis elegans is 2–3 weeks, Drosophila melanogaster is 2–3 months, and mice is 2–3 years.41–44 The efficiency will be greatly improved if a rapid anti-aging evaluation model at cellular level is established. Such a cell experiment was attempted by using KSL04 to evaluate the changes in fluorescence intensity between drug-administered group and blank group of senescent MRC5 cells. Rapamycin (Rapa), a widely reported anti-aging drug, was used as positive drug.45,46 As shown in Fig. 7a and b, senescent MRC5 (P29) cells were incubated with rapamycin for 3 days before staining with KSL04, and their fluorescence intensity significantly decreased in a dose-dependent manner compared to the blank sample. Hence, our β-gal probes exhibited the potential to be used to build a sensitive and efficient anti-aging efficacy evaluation model at the cellular level.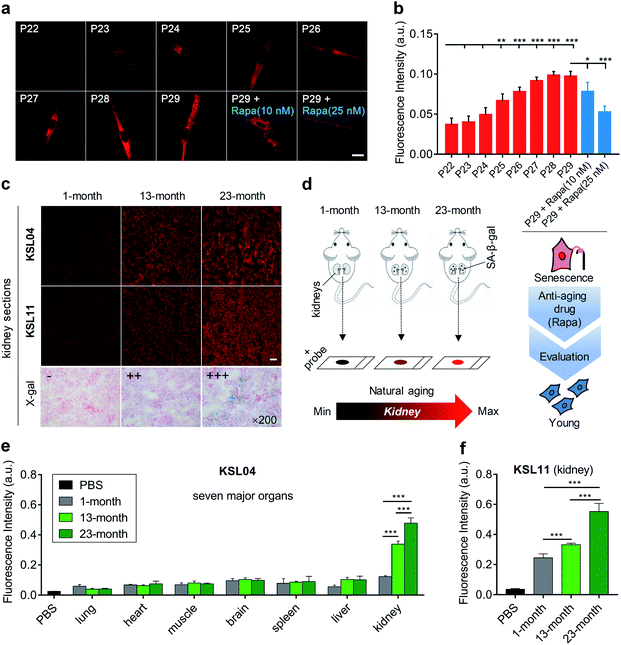 | ||
| Fig. 7 Aging evaluation of continuously cultured MRC5 cells and organs of naturally aging mice by KSL04 and KSL11. (a) Confocal fluorescence images of MRC5 cells incubated with KSL04 (10 μM) at various stages of replicative senescence (passage numbers ranging from 22 to 29), and senescent MRC5 cells (P29) incubated with Rapa (10 and 25 nM) for 3 days before labelling KSL04 (10 μM); scale bar: 20 μm. (b) Quantified fluorescence intensity of (a) and Fig. S18;† error bars represent the standard deviation (±S.D.) with n = 4. (c) Representative images of kidney sections from 1-, 13-, and 23-month-old C57BL/6J male mice incubated with KSL04 (10 μM), KSL11 (10 μM), and X-gal (1 mg mL−1), respectively; scale bar: 100 μm. (d) Schematic diagram of kidneys changes with natural aging sensed by our β-gal probes. (e) Quantified fluorescence intensity of KSL04 (10 μM) in PBS and the seven main tissue sections from 1-, 13-, and 23-month-old C57BL/6J male mice (Fig. S20–S22†) after incubation with KSL04 (10 μM) for 1 h at 37 °C, n = 5. (f) Quantified fluorescence intensity of KSL11 (10 μM) in PBS and the kidney sections from 1-, 13-, 23-month-old C57 male mice after incubation with KSL11 (10 μM) for 1 h at 37 °C; error bars represent the standard deviation (±S.D.) with n = 5. Red channel: λex = 405 nm, λem = 660–750 nm. *P < 0.1, **P < 0.05, ***P < 0.001, two-sided Student's t-test. | ||
Since the aging rate varied for different organs with age, we wondered which one would undergo the most marked senescence-related changes. Driven by this curiosity, we constructed a natural murine model of aging, with 1-, 13-, and 23-month-old C57BL/6J male mice. Their main organs, including lung, heart, muscle, brain, spleen, liver, and kidney, were sliced and observed by confocal microscopy. Upon incubation with KSL04 for 1 h at 37 °C, the fluorescence intensity of kidney sections was dramatically stronger than that of the other 6 organ sections and significantly increased with age (Fig. 7c–e, S21 and S22†). This result was also confirmed by the naked-eye observation of the X-gal staining assay (Fig. 7c and S23†). The section results indicated that SA-β-gal accumulated most in the kidneys over other main organs, and its content increased significantly in kidneys with age. Although some studies have reported that kidneys are sensitive organs with aging through several senescence-associated markers,47–49 they lack comparison of the kidneys with other main organs. As far as we know, this is the first time to investigate the aging of diverse organs in a natural aging mouse model using a fluorescent approach and discover that the kidneys are the organs with the most severe aging.
Species-selective probe eliminates the interference from E. coli β-gal and bacterial infection
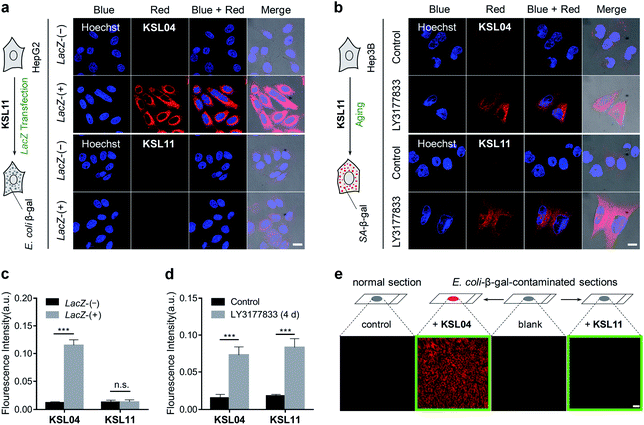
As we all know, bacterial infection is a common pathological condition, and β-gal secreted by bacteria may interfere with the accurate detection of SA-β-gal.20,32 In order to verify whether our species-selective β-gal probes are effective at eliminating the false positive test results caused by bacterial infection, a lacZ gene transfection assay, a chemically induced senescence model of human cells, and a simulated E. coli infection model were performed. To generate bacterial β-gal in living cells, the lacZ gene was introduced into 293T and HepG2 cells by employing a pLVX-Puro-LacZ plasmid transfection method to overexpress E. coli β-gal, which was clearly demonstrated by a western blot assay (Fig. S24†). After incubation with KSL04 (10 μM) at 37 °C for 30 min, the lacZ-(+) HepG2 and 293T cells with overexpressed E. coli β-gal exhibited a dramatically enhanced fluorescence in the red channel, while the fluorescent signal was barely observed for the lacZ-(−) HepG2 and 293T cells due to the relative low expression of endogenous β-gal in human hepatocellular carcinoma cells (Fig. 8a and S25†). However, there were negligible fluorescence changes were observed in the red channel between the lacZ-(−) and lacZ-(+) cells after incubation with the species-selective β-gal probe KSL11, demonstrating that KSL11 hardly recognizes the lacZ-encoded E. coli β-gal (Fig. 8a and S25†). Further, a senescence model of human hepatocellular carcinoma cells (Hep3B) with the increase of SA-β-gal content was established by incubation with DNA-replication kinase CDC7 inhibitor LY3177833,50 which was verified by western blot assay (Fig. S24†) and X-gal staining assay (Fig. S26†). As shown in Fig. 8b, the fluorescence intensity of LY3177833-treatment samples were much stronger than that of the control samples after staining with either KSL04 or KSL11, indicating that both of them could respond to SA-β-gal in senescent cells. The fluorescence quantitative histograms (Fig. 8c and d) evidently demonstrated that KSL04 exhibited significant fluorescence enhancement along with the increase of whatever SA-β-gal induced by LY3177833 or E. coli β-gal generated by lacZ transfection, while KSL11 barely responded to the overexpressed E. coli β-gal and species-selectively identified the SA-β-gal, which corresponded to the results of in vitro optical analysis experiments.In order to investigate the application of species-selective KSL11 in bacterial infection samples, a simulated E. coli infected model was established by staining the kidney sections with 200 U mL−1 of E. coli β-gal. The E. coli-β-gal-contaminated sections were treated with KSL04 (10 μM) and KSL11 (10 μM) at 37 °C for 1 h before fluorescence imaging. As shown in Fig. 8e, the KSL04-labelled section exhibited a bright fluorescence in red channel, while the KSL11-labelled section displayed subtle fluorescence changes compared to those of the blank or non-contaminated control section, indicating that the KSL11 was protected from the interference of exogenous β-gal produced by bacterial infection conditions.
Conclusions
We have proposed an unprecedented species-selective visualization strategy for human SA-β-gal, an endogenous lysosomal enzyme, to improve the reliability of probing aging. Regarding the species differences of β-gal, we have observed that A. oryzae β-gal shares the same specificity with the human β-gal, thus being a suitable SA-β-gal model in vitro; however, E. coli β-gal, as the most common bacterial β-gal, belongs to another family and, in some cases, interferes with the detection of SA-β-gal. To this end, we have designed and synthesized potential species-selective probes KSL01–KSL12 for the identification of SA-β-gal with the aid of structure-based steric hindrance adjustment catering to the different pocket shapes of A. oryzae β-gal and E. coli β-gal. Interestingly, all these compounds can work for A. oryzae β-gal and emit over a green-to-NIR spectral region, thus providing a wide range of colour choices for imaging this enzyme. Better still, KSL08–KSL12 as the first generation of species-selective probes have been screened out because they desirably respond to A. oryzae β-gal but not E. coli β-gal. As demonstrated by the imaging results, using our rationally designed and screened species-selective probe KSL11, the selective visualization of SA-β-gal without interference from bacterial β-gal in biological samples has been achieved. Furthermore, using KSL04 and KSL11, it has been discovered that SA-β-gal content in mice increased gradually with age and SA-β-gal accumulated most in kidneys among the main organs including lung, heart, muscle, brain, spleen, liver, and kidney, revealing the kidneys as the organs with the most severe aging during the aging process. Therefore, our unique fluorescence-based SA-β-gal detection system offers a promising tool for identifying aging and evaluating anti-aging drugs and will pave the way to explain the biological processes behind aging or aging-related diseases.Ethical statement
All procedures involving animals were approved by the Institutional Animal Care and Use Committee of Second Military Medical University, and were conducted in accordance with the National Research Council Guide for Care and Use of Laboratory Animals.Conflicts of interest
The authors declare that they have no competing financial interests.Acknowledgements
We appreciate the gift of the plasmid containing the sumo-tag from Prof. Shu Quan and the gift of 23 month-old C57BL/6J mice from Prof. Yuzheng Zhao. We thank the staff from beam lines BL17B1 and BL18U1 at the Shanghai Synchrotron Radiation Facility for assistance with crystal diffraction data collection. We thank the experimental facility and the technical services provided by the Synchrotron Radiation Protein Crystallography Facility of the Taiwan Core Facility Program for Biotechnology, and the Taiwan Synchrotron Radiation Research Center. This work was supported by the National Key R&D Program of China (2017YFB0202600), the National Natural Science Foundation of China (81872747, 21977082, 81903457, 81872742), the Innovative Research Team of High-level Local Universities in Shanghai, the Natural Science Basic Research Plan for Distinguished Young Scholars in Shaanxi Province of China (No. 2020JC-38), the National Special Fund for State Key Laboratory of Bioreactor Engineering (2060204), the Open Funding Project of the State Key Laboratory of Bioreactor Engineering (2018OPEN12), the Chinese Postdoctoral Science Foundation (2018M641946), the Shanghai Sailing Program (19YF1412600), and the Shanghai Morning Light Program (18CG33).References
- K. Christensen, G. Doblhammer, R. Rau and J. W. Vaupel, Lancet, 2009, 374, 1196–1208 CrossRef.
- B. G. Childs, M. Durik, D. J. Baker and J. M. van Deursen, Nat. Med., 2015, 21, 1424–1435 CrossRef CAS PubMed.
- J. M. van Deursen, Nature, 2014, 509, 439–446 CrossRef CAS PubMed.
- C. López-Otín, M. A. Blasco, L. Partridge, M. Serrano and G. Kroemer, Cell, 2013, 153, 1194–1217 CrossRef PubMed.
- N. E. Sharpless and C. J. Sherr, Nat. Rev. Cancer, 2015, 15, 397–408 CrossRef CAS PubMed.
- M. Matjusaitis, G. Chin, E. A. Sarnoski and A. Stolzing, Ageing Res. Rev., 2016, 29, 1–12 CrossRef CAS PubMed.
- D. Muňoz-Espín and M. Serrano, Nat. Rev. Mol. Cell Biol., 2014, 15, 482–496 CrossRef PubMed.
- J. Campisi and F. d'Adda di Fagagna, Nat. Rev. Mol. Cell Biol., 2007, 8, 729–740 CrossRef CAS PubMed.
- U. Herbig, M. Ferreira, L. Condel, D. Carey and J. M. Sedivy, Science, 2006, 311, 1257 CrossRef CAS PubMed.
- J. Campisi, Cell, 2005, 120, 513–522 CrossRef CAS PubMed.
- G. P. Dimri, X. Lee, G. Basile, M. Acosta, G. Scott, C. Roskelley, E. E. Medrano, M. Linskens, I. Rubelj, O. Pereira-Smith, M. Peacocke and J. Campisi, Proc. Natl. Acad. Sci. U. S. A., 1995, 92, 9363–9367 CrossRef CAS PubMed.
- B. Y. Lee, J. A. Han, J. S. Im, A. Morrone, K. Johung, E. C. Goodwin, W. J. Kleijer, D. DiMaio and E. S. Hwang, Aging Cell, 2006, 5, 187–195 CrossRef CAS PubMed.
- F. Debacq-Chainiaux, J. D. Erusalimsky, J. Campisi and O. Toussaint, Nat. Protoc., 2009, 4, 1798–1806 CrossRef CAS PubMed.
- T. Ueno and T. Nagano, Nat. Methods, 2011, 8, 642–645 CrossRef CAS PubMed.
- K. Umezawa, M. Yoshida, M. Kamiya, T. Yamasoba and Y. Urano, Nat. Chem., 2017, 9, 279–286 CrossRef CAS PubMed.
- J. Chan, S. C. Dodani and C. J. Chang, Nat. Chem., 2012, 4, 973–984 CrossRef CAS PubMed.
- Z. Guo, S. Nam, S. Park and J. Yoon, Chem. Sci., 2012, 3, 2760–2765 RSC.
- H. Kobayashi, M. Ogawa, R. Alford, P. L. Choyke and Y. Urano, Chem. Rev., 2010, 110, 2620–2640 CrossRef CAS PubMed.
- L. Wang, M. S. Frei, A. Salim and K. Johnsson, J. Am. Chem. Soc., 2019, 141, 2770–2781 CrossRef CAS PubMed.
- B. Lozano-Torres, I. Galiana, M. Rovira, E. Garrido, S. Chaib, A. Bernardos, D. Munoz-Espin, M. Serrano, R. Martinez-Manez and F. Sancenon, J. Am. Chem. Soc., 2017, 139, 8808–8811 CrossRef CAS PubMed.
- H. W. Lee, C. H. Heo, D. Sen, H.-O. Byun, I. H. Kwak, G. Yoon and H. M. Kim, Anal. Chem., 2014, 86, 10001–10005 CrossRef CAS PubMed.
- D. Asanuma, M. Sakabe, M. Kamiya, K. Yamamoto, J. Hiratake, M. Ogawa, N. Kosaka, P. L. Choyke, T. Nagano, H. Kobayashi and Y. Urano, Nat. Commun., 2015, 6, 6463 CrossRef CAS PubMed.
- K. Gu, W. Qiu, Z. Guo, C. Yan, S. Zhu, D. Yao, P. Shi, H. Tian and W.-H. Zhu, Chem. Sci., 2019, 10, 398–405 RSC.
- W. Wang, K. Vellaisamy, G. Li, C. Wu, C.-N. Ko, C.-H. Leung and D.-L. Ma, Anal. Chem., 2017, 89, 11679–11684 CrossRef CAS PubMed.
- C. H. Leung, D. S. Chan, H. Yang, R. Abagyan, S. M. Lee, G. Y. Zhu, W. F. Fong and D. L. Ma, Chem. Commun., 2011, 47, 2511–2513 RSC.
- D. Oushiki, H. Kojima, Y. Takahashi, T. Komatsu, T. Terai, K. Hanaoka, M. Nishikawa, Y. Takakura and T. Nagano, Anal. Chem., 2012, 84, 4404–4410 CrossRef CAS PubMed.
- K. Gu, Y. Xu, H. Li, Z. Guo, S. Zhu, S. Zhu, P. Shi, T. D. James, H. Tian and W.-H. Zhu, J. Am. Chem. Soc., 2016, 138, 5334–5340 CrossRef CAS PubMed.
- T. Doura, M. Kamiya, F. Obata, Y. Yamaguchi, T. Y. Hiyama, T. Matsuda, A. Fukamizu, M. Noda, M. Miura and Y. Urano, Angew. Chem., Int. Ed., 2016, 55, 9620–9624 CrossRef CAS PubMed.
- Y. Urano, M. Kamiya, K. Kanda, T. Ueno, K. Hirose and T. Nagano, J. Am. Chem. Soc., 2005, 127, 4888–4894 CrossRef CAS PubMed.
- M. Sakabe, D. Asanuma, M. Kamiya, R. J. Iwatate, K. Hanaoka, T. Terai, T. Nagano and Y. Urano, J. Am. Chem. Soc., 2013, 135, 409–414 CrossRef CAS PubMed.
- H. Ito, Y. Kawamata, M. Kamiya, K. Tsuda-Sakurai, S. Tanaka, T. Ueno, T. Komatsu, K. Hanaoka, S. Okabe, M. Miura and Y. Urano, Angew. Chem., Int. Ed., 2018, 57, 15702–15706 CrossRef CAS PubMed.
- M. Paez-Ribes, E. Gonzalez-Gualda, G. J. Doherty and D. Munoz-Espin, EMBO Mol. Med., 2019, 11, e10234 CAS.
- R. H. Jacobson, X. J. Zhang, R. F. DuBose and B. W. Matthews, Nature, 1994, 369, 761–766 CrossRef CAS PubMed.
- W. Tian, C. Chen, X. Lei, J. Zhao and J. Liang, Nucleic Acids Res., 2018, 46, 363–367 CrossRef PubMed.
- A. C. Sedgwick, L. Wu, H. H. Han, S. D. Bull, X. P. He, T. D. James, J. L. Sessler, B. Z. Tang, H. Tian and J. Yoon, Chem. Soc. Rev., 2018, 47, 8842–8880 RSC.
- D. H. Juers, R. H. Jacobson, D. Wigley, X. J. Zhang, R. E. Huber, D. E. Tronrud and B. W. Matthews, Protein Sci., 2000, 9, 1685–1699 CrossRef CAS PubMed.
- D. H. Juers, T. D. Heightman, A. Vasella, J. D. McCarter, L. Mackenzie, S. G. Withers and B. W. Matthews, Biochemistry, 2001, 40, 14781–14794 CrossRef CAS PubMed.
- G. Hewitt, D. Jurk, F. D. M. Marques, C. Correia-Melo, T. Hardy, A. Gackowska, R. Anderson, M. Taschuk, J. Mann and J. F. Passos, Nat. Commun., 2012, 3, 708 CrossRef PubMed.
- C. Correia-Melo, F. D. M. Marques, R. Anderson, G. Hewitt, R. Hewitt, J. Cole, B. M. Carroll, S. Miwa, J. Birch, A. Merz, M. D. Rushton, M. Charles, D. Jurk, S. W. G. Tait, R. Czapiewski, L. Greaves, G. Nelson, M. Bohlooly-Y, S. Rodriguez-Cuenca, A. Vidal-Puig, D. Mann, G. Saretzki, G. Quarato, D. R. Green, P. D. Adams, T. von Zglinicki, V. I. Korolchuk and J. F. Passos, EMBO J., 2016, 35, 724–742 CrossRef CAS PubMed.
- D. J. Kurz, S. Decary, Y. Hong and J. D. Erusalimsky, J. Cell Sci., 2000, 113, 3613–3622 CAS.
- F. Cabreiro, C. Au, K. Y. Leung, N. Vergara-Irigaray, H. M. Cocheme, T. Noori, D. Weinkove, E. Schuster, N. D. Greene and D. Gems, Cell, 2013, 153, 228–239 CrossRef CAS PubMed.
- C. Slack, A. Foley and L. Partridge, PLoS One, 2012, 7, e47699 CrossRef CAS PubMed.
- A. Martin-Montalvo, E. M. Mercken, S. J. Mitchell, H. H. Palacios, P. L. Mote, M. Scheibye-Knudsen, A. P. Gomes, T. M. Ward, R. K. Minor, M. J. Blouin, M. Schwab, M. Pollak, Y. Zhang, Y. Yu, K. G. Becker, V. A. Bohr, D. K. Ingram, D. A. Sinclair, N. S. Wolf, S. R. Spindler, M. Bernier and R. de Cabo, Nat. Commun., 2013, 4, 2192 CrossRef PubMed.
- A. L. Chen, K. M. Lum, P. Lara-Gonzalez, D. Ogasawara, I. I. I. A. B. Cognetta, A. To, W. H. Parsons, G. M. Simon, A. Desai, M. Petrascheck, L. Bar-Peled and B. F. Cravatt, Nat. Chem. Biol., 2019, 15, 453–462 CrossRef CAS PubMed.
- R. Wang, Z. Yu, B. Sunchu, J. Shoaf, I. Dang, S. Zhao, K. Caples, L. Bradley, L. M. Beaver, E. Ho, C. V. Löhr and V. I. Perez, Aging Cell, 2017, 16, 564–574 CrossRef CAS PubMed.
- Z. N. Demidenko, S. G. Zubova, E. I. Bukreeva, V. A. Pospelov, T. V. Pospelova and M. V. Blagosklonny, Cell Cycle, 2009, 8, 1888–1895 CrossRef CAS PubMed.
- S. A. Noh, S. M. Kim, S. H. Park, D. J. Kim, J. W. Lee, Y. G. Kim, J. Y. Moon, S. J. Lim, S. H. Lee and K. P. Kim, J. Proteome Res., 2019, 18, 2803–2812 CrossRef CAS PubMed.
- Y. Zhang, A. Unnikrishnan, S. S. Deepa, Y. Liu, Y. Li, Y. Ikeno, D. Sosnowska, H. Van Remmen and A. Richardson, Redox Biol., 2017, 11, 30–37 CrossRef CAS PubMed.
- M. A. Seol, U. Jung, H. S. Eom, S. H. Kim, H. R. Park and S. K. Jo, J. Vet. Sci., 2012, 13, 331–338 CrossRef PubMed.
- C. Wang, S. Vegna, H. Jin, B. Benedict, C. Lieftink, C. Ramirez, R. L. de Oliveira, B. Morris, J. Gadiot, W. Wang, A. du Chatinier, L. Wang, D. Gao, B. Evers, G. Jin, Z. Xue, A. Schepers, F. Jochems, A. M. Sanchez, S. Mainardi, H. Te Riele, R. L. Beijersbergen, W. Qin, L. Akkari and R. Bernards, Nature, 2019, 576, 268–272 CrossRef PubMed.
Footnotes |
| † Electronic supplementary information (ESI) available: Experimental section, additional figures, synthetic procedures, and original spectra of new compounds. See DOI: 10.1039/d0sc01234c |
| ‡ These authors contributed equally to this work. |
| This journal is © The Royal Society of Chemistry 2020 |

