
 Open Access Article
 This Open Access Article is licensed under a Creative Commons Attribution-Non Commercial 3.0 Unported Licence
An excited state dynamics driven reaction: wavelength-dependent photoisomerization quantum yields in [Ru(bpy)2(dmso)2]2+†
Maksim Y.
Livshits
 *ab,
Lei
Wang
b,
Sebastian B.
Vittardi
a,
Stefan
Ruetzel
c,
Albert
King
a,
Tobias
Brixner
*c and
Jeffrey J.
Rack
*ab
*ab,
Lei
Wang
b,
Sebastian B.
Vittardi
a,
Stefan
Ruetzel
c,
Albert
King
a,
Tobias
Brixner
*c and
Jeffrey J.
Rack
*ab
aDepartment of Chemistry and Chemical Biology, University of New Mexico, Albuquerque, NM 87131, USA. E-mail: jrack@unm.edu
bDepartment of Chemistry and Biochemistry, Ohio University, Athens, OH 45701, USA
cInstitut für Physikalische und Theoretische Chemie, Universität Würzburg, Am Hubland, 97074 Würzburg, Germany. E-mail: brixner@phys-chemie.uni-wuerzburg.de
First published on 27th May 2020
Abstract
We report the excited-state behavior of a structurally simple bis-sulfoxide complex, cis-S,S-[Ru(bpy)2(dmso)2]2+, as investigated by femtosecond pump–probe spectroscopy. The results reveal that a single photon prompts phototriggered isomerization of one or both dmso ligands to yield a mixture of cis-S,O-[Ru(bpy)2(dmso)2]2+ and cis-O,O-[Ru(bpy)2(dmso)2]2+. The quantum yields of isomerization of each product and relative product distribution are dependent upon the excitation wavelength, with longer wavelengths favoring the double isomerization product, cis-O,O-[Ru(bpy)2(dmso)2]2+. Transient absorption measurements on cis-O,O-[Ru(bpy)2(dmso)2]2+ do not reveal an excited-state isomerization pathway to produce either the S,O or S,S isomers. Femtosecond pulse shaping experiments reveal no change in the product distribution. Pump–repump–probe transient absorption spectroscopy of cis-S,S-[Ru(bpy)2(dmso)2]2+ shows that a pump–repump time delay of 3 ps dramatically alters the S,O![[thin space (1/6-em)]](https://www.rsc.org/images/entities/char_2009.gif) :O,O product ratio; pump–repump–probe transient absorption spectroscopy of cis-O,O-[Ru(bpy)2(dmso)2]2+ with a time delay of 3 ps uncovers an excited-state isomerization pathway to produce the S,O isomer. In conjunction with low-temperature steady-state emission spectroscopy, these results are interpreted in the context of an excited-state bifurcating pathway, in which the isomerization product distribution is determined not by thermodynamics, but rather as a dynamics driven reaction.
:O,O product ratio; pump–repump–probe transient absorption spectroscopy of cis-O,O-[Ru(bpy)2(dmso)2]2+ with a time delay of 3 ps uncovers an excited-state isomerization pathway to produce the S,O isomer. In conjunction with low-temperature steady-state emission spectroscopy, these results are interpreted in the context of an excited-state bifurcating pathway, in which the isomerization product distribution is determined not by thermodynamics, but rather as a dynamics driven reaction.
Introduction
Excited-state electronic-nuclear coupling is dominated by a small set of reaction coordinates productive towards the thermodynamic deactivation of the excited state along a single trajectory of the potential energy surface. This approximation has led to the development of useful models to explain and predict the excited-state reactivity of many chromophores and photochromes.1–5 Recently, new interpretations of bifurcating transition states as well as molecules with large excited-state nuclear displacements have emerged to challenge the notion that a single reaction coordinate trajectory dominated by thermodynamics is capable of adequately describing complex excited-state reactivity.4,6,7 The origin of these changes in interpretation is found in reactions where a transition state is located near a stationary point (location on the potential energy surface where energy gradients with respect to the nuclear position are small or zero) or a conical intersection thus enabling non-equilibrium molecular dynamics to dictate reaction outcomes over thermodynamics.The ground-state equivalent of dynamics-driven transition–state reactions are well known and have been studied for some time in the cases of select organic transformations (e.g., isomerization of cyclooctatetraene and Diels–Alder-type reactions).8 Specifically, in conjunction with DFT calculations, photoelectron and photodetachment spectroscopy of cyclooctatetraene found evidence for interconversion between planar and boat isomers.9 Moreover, synthetic studies of unimolecular and bimolecular cycloadditions have been observed to generate multiple product isomers simultaneously from the same set of reactants.10,11 To explain the product isomer distribution in both cases, a bifurcating transition state driven by dynamics instead of thermodynamics was invoked. A more quantitative explanation for the reactivity above was developed employing a combination of density functional theory and molecular dynamics computations.12 Complete active space self-consistent field (CASSCF) calculations informed by experimentally derived energies have located stationary points on the potential energy surface, from which multidimensional trajectories yield a bifurcation resulting in multiple isomeric product formation.8,12 Despite these examples, definitive evidence of potential energy surfaces with saddle points and bifurcation regions remains relatively rare.
While computational efforts have been at the frontier for the development of excited-state multi-dimensional reaction coordinate models, there is limited spectroscopic data from which to gain additional understanding. Typically, major experimental difficulties, such as the lack of large spectral changes in the visible and infrared regions as well as ultrafast lifetimes (<1 ps) associated with excited-state bifurcating reactions, plague unequivocal identification of these effects.13 While transition metal complexes feature large visible absorption changes, experimental efforts are limited by broad overlapping spectral signatures from a large density of excited states.14 The computational work for transition metal complexes is further complicated by the level of theory required to accurately model these states, which plays a large role in transition-metal excited-state dynamics.
Photochromic complexes serve to identify multi-dimensional pathways
One way of usurping certain of these experimental difficulties in identifying bifurcating reaction surfaces is to investigate photochromic molecules, which undergo large molecular rearrangements following light excitation, and necessarily provide spectroscopically distinct excited state reaction pathways.15 Similar to ground state synthetic chemistry reactions, the formation of distinct photoproduct isomers provides a handle from which to study multi-dimensional energy surfaces. One class of photochromic coordination complexes is based on ruthenium and osmium polypyridine sulfoxides.16,17 Here, phototriggered S → O isomerization is prompted by metal-to-ligand charge transfer (MLCT) excitation to produce a metastable O-bonded isomer.18 The metastable O-bonded isomer thermally reverts to the ground-state S-bonded isomer on a kilosecond to megasecond time scale.19–21 To date, there are only two examples of a photochemical (photonic) pathway for O → S isomerization.21–23 A sub-class of these photochromic complexes features two sulfoxides in a cis configuration.19,24–29 The bis-sulfoxide complexes exhibit three ground state isomers consisting of the cis-S,S-bonded isomer (S,S), a metastable cis-S,O-bonded isomer (S,O), and a metastable cis-O,O-bonded isomer (O,O) with typical λmax absorptions ∼350, ∼405, and ∼500 nm, respectively. There exist two limiting mechanistic possibilities of 1 (S,S → S,O) and 2 (S,S → O,O) isomerizations following a single photon absorption as well as the opportunity to form both products.27,30 In principle, these complexes feature an excited state potential energy surface that distinguishes between two spectroscopically distinct products from a single ground state isomer.Complex 1 (Scheme 1) features one-photon absorption, one-isomerization (S,S → S,O) photochemistry.28 Femtosecond pump–probe spectroscopy reveals the formation of a new absorption maximum following excitation at 355 nm that appears at 400 nm after long pump–probe delays (Δτ > 500 ps). The new absorption is ascribed to an isomer featuring a mixed S,O coordination environment. Pump–repump–probe spectroscopic measurements were utilized to convert the S,O isomer to the O,O isomer in two sequential phototriggered reactions.28 These data are consistent with the bulk photolysis data where one observes the emergence of two sets of isosbestic points (one at early bulk irradiation times, a second at later irradiation times) indicating conversion of one isomer to a new compound that is subsequently converted to a third isomer in two distinct steps (S,S → S,O and S,O → O,O). In contrast, complex 2 (Scheme 1) exhibits one-photon absorption, one-isomerization and one-photon absorption, two-isomerization (S,S → S,O and S,S → O,O) photochemistry upon irradiation at 400 nm.27 Transient absorption spectroscopy confirms the presence of both S,O, and O,O isomers following excitation from the emergence of absorption features at 400 nm (S,O isomer) and 500 nm (O,O isomer) in the pump–probe spectra with statistically identical time constants. It is striking to note that both complexes 1 and 2 are C2 symmetric in the ground state, indicating that the sulfoxide ligands are identical.27 Indeed, the 1H NMR spectrum is consistent with C2 symmetry, and the molecular structure reveals similar Ru–S bond distances of 2.248, 2.258 Å (complex 1) and 2.293 Å (complex 2).27,28 Moreover, the only noticeable structural difference between complexes 1 and 2 is the nature of the linker atoms in the chelate, as well as the R group bound to the sulfinyl group. While the linker vibrations are critical for isomerization, these vibrations are not intimately coupled to the Ru dπ → bpy π* MLCT transition. It seems reasonable to assert that the excited state potential energy surfaces for complexes 1 and 2 are quite different, leading to disparate photochemical products.
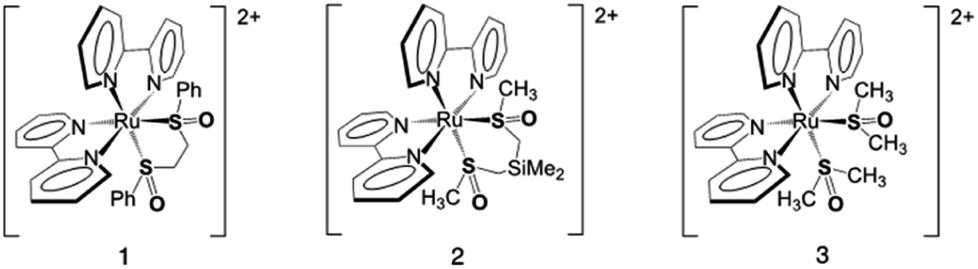 | ||
| Scheme 1 Bond line drawing of cis-[Ru(bpy)2(bpSO)]2+ (where bpy is 2,2′-bipyridine and bpSO is 1,2-bis(phenylsulfinyl)ethane, complex 1), cis-[Ru(bpy)2(OSSO)]2+, (where OSSO is dimethylbis((methylsulfinyl)methyl)silane, complex 2) and cis-[Ru(bpy)2(DMSO)2]2+, (where DMSO is dimethyl sulfoxide, complex 3). | ||
To explain the reactivity of complex 2, we previously proposed a model where the excited-state barriers separating isomeric structures were small relative to kBT, such that the excited-state S,S, S,O, and O,O isomers were in a thermal equilibrium with one another along one large PES prior to relaxation to the appropriate ground-state isomer.27 The difference in reactivity between 1 and 2 could simply be explained through an increase in the excited-state barrier separating these isomers. In support of this mechanism, a recent gas-phase ion mobility spectrometry (IMS) study clearly demonstrated that complex 1 features both one-photon absorption, one-isomerization and one-photon absorption, two-isomerization reactivity in the gas phase, indicating an important role for solvent reorganization, solvent friction, and energy transfer to solvent in this complex.31
A computational study of complex 3 was also reported in which they specifically addressed whether or not complex 3 would show one-photon, one-isomerization (S,S → S,O) or one-photon, two-isomerization (S,S → O,O) reactivity.32 In sum, they proposed that isomerization occurs sequentially along the lowest-energy triplet state and that isomerization may occur by either a one-photon or two-photon excitation mechanism. These calculations identify the lowest-energy triplet state as metal-centered. While complex 3 has been previously reported, femtosecond pump–probe transient spectra have not been recorded.19,24 We sought to examine complex 3 to not only determine the photochemical reactivity, but also to further examine the role of the chelate in the excited-state reactivity. The computational study seems to identify both sequential and direct isomerization pathways from the S,S isomer to the O,O isomer.32
Herein, we report the experimental excited-state dynamics for a structurally simple bis-sulfoxide complex (cis-[Ru(bpy)2(DMSO)2]2+, complex 3; Scheme 1) as well as an unusual wavelength dependence, which provides evidence for a bifurcating excited state surface and a dynamics driven reaction. Our excited-state dynamics discussion consists of data from femtosecond pump–probe transient absorption, femtosecond pulse shaping, and femtosecond pump–repump–probe (PRP) transient absorption spectroscopy. We further report low-temperature emission results for the S,S complex and a mixture of S,O and O,O photoproduct isomers. The sum total of our experimental results enables a mechanistic hypothesis invoking a multi-dimensional bifurcating excited state potential energy surface to produce a photoproduct distribution of isomers following a single-pulse excitation. Lastly, we revisit the previous mechanistic model proposed for the one versus two sulfoxide isomerization as reported for complexes 1 and 2.27
Experimental
Propylene carbonate and carbon tetrachloride reagent grade were purchased from Sigma Aldrich. Acetonitrile, dichloromethane, and dimethyl sulfoxide reagent grade were purchased from OmniSolv. 2,2′-Bipyridine was purchased from Alfa Aesar. RuCl3 was purchased from Pressure Chemical. All reagents and solvents were used without further purification. The compound, [Ru(bpy)2(DMSO)2](OTf)2, where OTf is trifluoromethansulfonate, was prepared following literature procedures.19,24Transient absorption measurements were carried out on a custom built instrument. An amplified one box Ti:sapphire laser (Solstice, Spectra-Physics) was used to generate ∼800 nm pulses at a repetition rate of 1 kHz. The output from the Solstice is split into pump and probe beams. The pump beam was directed into an optical parametric amplifier (TOPAS, Light Conversion). The probe beam was passed through a CaF2 crystal to yield a white-light continuum via an eight-pass variable distance retroreflector. Neutral density filters were used to attenuate the pump beam intensity to prevent multi-exciton generation. Finally, the data were collected using a custom-built transient absorption spectrometer (TAS; Newport). A bulk solution of ∼50 ml ruthenium sulfoxide in propylene carbonate (unless otherwise noted) was flowed through a 2 mm quartz cuvette by a fluid pump at a flow rate of 12 ml min−1. Quantum control measurements were performed on a similar, but different instrument. Full details of both instruments can be found in the ESI.†
Bulk photolysis data was collected on an Agilent 8453 UV-Vis with Chemstation Ver. B.04.01 kinetics mode. A 3 ml solution of [Ru(bpy)2(DMSO)2](OTf)2 (0.12 OD at 355 nm) in a fluorescence cell was irradiated using a 405 nm continuous-wave LED (Lightland 3350 Laser Module, power ∼500 μW) with a variable ND filter. Spectra were recorded every thirty seconds for the duration of the experiment. The full quantum yield procedure by actinometry may also be found in the ESI.† Briefly, absorption spectra were collected on an Agilent 8453 UV-Vis Spectrometer. A Ti:sapphire amplifier (Solstice, Spectra-Physics) with an optical parametric amplifier (TOPAC, Light Conversion) was used to generate the desired wavelength for sample irradiation. Individual S,O-bonded and O,O-bonded complex quantum yields of isomerization measurements were determined by irradiating a solution of the S,S-bonded complex in propylene carbonate at room temperature. Incident radiation intensity (I0) was determined using potassium ferrioxalate actinometry.33–35 By knowing the radiation intensity and the concentration of the O,O isomer produced (isolated spectral changes are observed for wavelengths >500 nm) over time, an initial first-order rate-law approximation was utilized to calculate the isomerization quantum yield, ΦS,S→O,O. The concentration of S,O-isomer production over time was determined by subtracting the O,O-isomer contribution, followed by reapplying the same initial first-order rate-law approximation to the S,O isomer at 415 nm to yield the quantum yield, ΦS,S→S,O. For all experiments, less than 10% of the initial S,S-isomer solution was isomerized.
Results and discussion
Pump–probe transient absorption of cis-S,S-[Ru(bpy)2(DMSO)2]2+
Shown in Fig. 1 are linear absorption spectra and pump–probe transient spectra obtained at different time delays for complex 3 upon excitation at 355 nm. Panel A displays the S,S isomer (black), O,O isomer (red), and O,O–S,S isomer difference (blue) absorption spectra obtained from bulk photolysis. Panels B (0.7 to 20 ps) and C (20 to 3000 ps) display the pump–probe data collected at different time delays. The spectra in panel B feature details attributable to prototypical 3MLCT excited states at early time delays, namely an absorption at ∼390 nm, ascribed to reduced bpy π* →π* transition, and an absorption in the red (λ > 500 nm), assigned primarily to unreduced bpy to RuIII ligand-to-metal charge transfer (LMCT) absorption.36 Not apparent in the early spectra (panel B) is the bleach (negative ΔA) corresponding to the loss of the RuII ground state. This is a consequence of both the position of the ground-state absorption maximum and the increased extinction of the 390 nm excited-state absorption relative to the ground-state absorption. The excited-state absorption features are not supportive of a metal-centered or ligand-field lowest-energy excited state. In that case, one would not expect to see an intense absorption at 390 nm, due to the presence of the reduced bpy.37 Panel C in Fig. 1 displays the evolution of the excited state to produce ground-state S,S, S,O and O,O isomers. The loss of the absorption in the red indicates conversion from a 3RuIII MLCT state to a 1RuII ground state, with emergent absorption maxima observed at 405 and 495 nm, corresponding to the absorption maxima for S,O and O,O isomers, respectively, as discussed in the introduction.19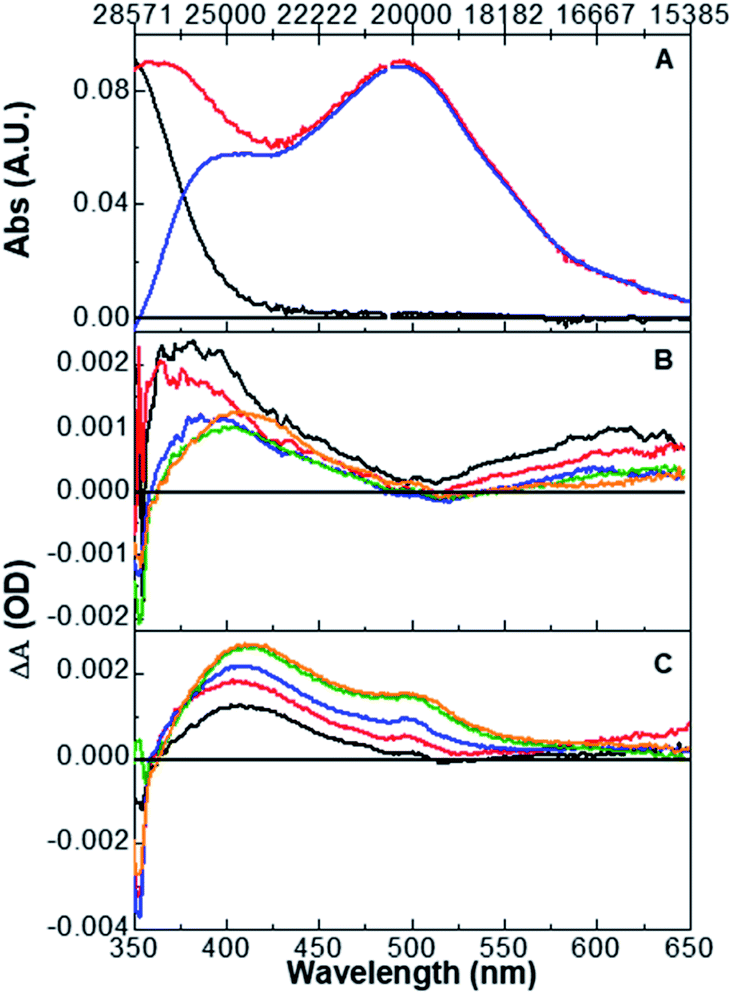 | ||
| Fig. 1 (A) Steady-state absorption spectra of S,S- (black), O,O- (red) as well as the steady-state difference spectrum O,O–S,S- (blue) [Ru(bpy)2(DMSO)2]2+. (B) S,S isomer transient absorption spectra at 355 nm excitation obtained at pump–probe delays of 0.7 (black), 2 (red), 6 (blue), 12 (green), and 20 ps (orange). (C) Transient absorption spectra obtained at pump–probe delays of 20 (black), 100 (red), 250 (blue), 1000 (green), and 3000 ps (orange). | ||
Singular value decomposition (SVD) global analysis was employed to describe the absorption changes as a function of time retrieving a tri-exponential fit with time-constant values of 0.3 ± 0.1, 1.8 ± 0.1, and 236 ± 5 ps. Single wavelength kinetic traces were also analyzed to produce time constants consistent with the global analysis results. In accord with previous studies, we assign the 0.3 ps time constant to formation of the 3MLCT state,36 the 1.8 ps time constant is assigned to a combination of solvent reorganization and intramolecular vibrational redistribution (IVR) processes to form a thermally relaxed state from which isomerization occurs, and the 236 ps time constant is ascribed to the sum of relaxation pathways from the excited-state to ground-state isomers.38,39 Importantly, we see no evidence from the kinetic analysis or transient spectra to support the notion that the O,O isomer is formed from the S,O isomer in a sequential reaction as observed in the pump–repump–probe experiment of Complex 1.28 If a single photon prompted a sequential S,S → S,O → O,O reaction then we would expect to see statistically significant differences in the single-wavelength kinetic lifetimes for the formation of the S,O and O,O isomers as well as a delayed formation of the O,O absorption, neither of which are observed. Based on these data, we propose that (similar to compound 2 described in a previous study) ground-state S,S, S,O, and O,O isomers are ultimately formed from a single excited-state surface, which allows all three of these excited-state structures to be formed. These data support the pre-existing computational study that predicted that both S,O and O,O isomers would be formed upon single-photon excitation of the ground-state RuII S,S isomer.27
The simultaneous formation of S,O and O,O isomers prompted us to question if the excited-state surface is best described as a “soft surface” where multiple isomeric structures are in equilibrium with one another (as described above for complex 2), or if there exist multiple deactivation channels from an earlier formed excited state that lead to different isomeric products. In the former case, the excitation wavelength will have no effect on the product distribution, meaning that the product distribution is a function of the barriers on the excited-state surface that lead to isomerization and not on the initial state formed upon excitation. That is, the product distribution is determined solely by the thermodynamics of the excited-state surface. In contrast, if multiple pathways from an initial S,S-isomer excited state are present or a dynamics driven mechanism is operative, then one might anticipate a change in the product distribution and quantum yield of isomerization upon variations in the excitation wavelength. In this case, the fate of the isomerization may be dependent upon where the excited state is formed on the initial excited-state surface (1MLCTSS).
S,O and O,O photoproduct excitation wavelength dependence in cis-S,S-[Ru(bpy)2(DMSO)2]2+
Shown in Fig. 2 are the excitation wavelength-dependent pump–probe transient spectra for complex 3 normalized at 500 nm, a wavelength corresponding only to the O,O-bonded product. The displayed transient spectra are the average of ten spectra with pump–probe time delays ranging from 2900 to 3100 ps obtained with 355 (black), 375 (red), 390 (blue), and 400 nm (green) excitation (full data are found in Fig. S26†). We note that each spectrum obtained at a specific time delay is the sum of ∼2000 spectra. Thus, these spectra accurately and precisely capture the final product distribution following excitation of S,S-[Ru(bpy)2(DMSO)2]2+, and are reflective of the true product distribution. It is clear that the product distribution changes as a function of the excitation wavelength. This result suggests that the original proposal describing the excited-state reactivity as originating from a soft surface is insufficient and that there must be separate pathways, or non-equilibrium dynamics from the initial 1MLCT S,S state that ultimately produces different ground-state photoproduct isomers.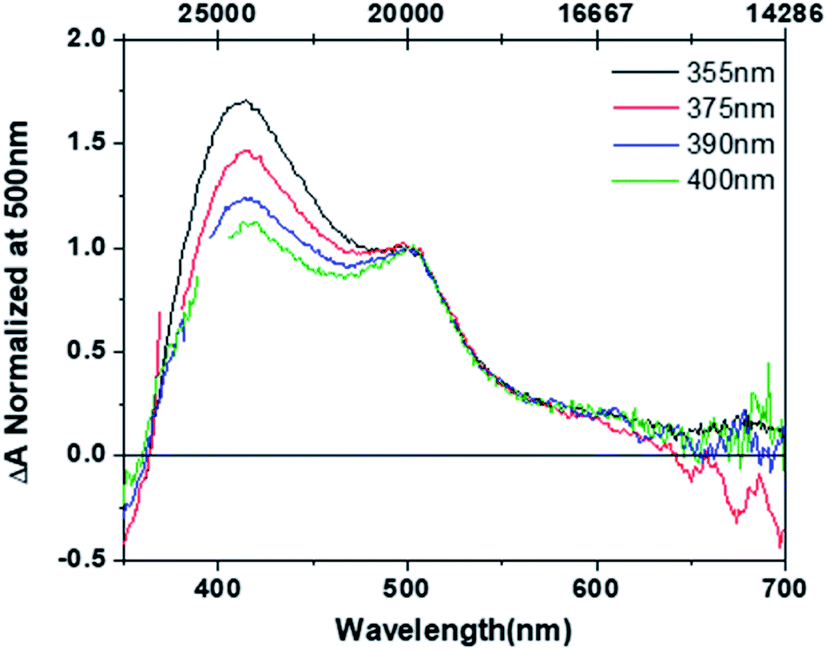 | ||
| Fig. 2 Averaged transient absorption spectra obtained at 3000 ps representing the S,O (400 nm maximum) and O,O isomer (500 nm absorption maximum) product distribution following excitation at 355 nm (black), 375 nm (red), 390 nm (blue), and 400 (green) at room temperature. | ||
Quantum yields for the formation of the S,O and O,O isomers as a function of excitation wavelength are found in Table 1. The data show that as the excitation energy is lowered the S,O isomer is formed to a lesser extent, and correspondingly the O,O isomer is produced to a greater extent. The aggregate quantum yield (Φ[S,O] + Φ[O,O]) is nearly invariant with changing excitation energy, suggesting that the excitation wavelength promotes one pathway over another along a bifurcation or saddle point on the excited-state potential energy surface. Shorter wavelengths favour one sulfoxide isomerization product (S,O), whereas longer wavelengths favour the bis-sulfoxide isomerization product (O,O).
| Excitation (nm) | Φ[S,O] | Φ[O,O] |
|---|---|---|
| 355 | 0.40 ± 0.01 | 0.09 ± 0.02 |
| 375 | 0.25 ±.0.02 | 0.17 ±.0.10 |
| 390 | 0.18 ± 0.03 | 0.21 ± 0.07 |
| 405 | 0.20 ± 0.02 | 0.24 ± 0.09 |
One possible explanation for the wavelength dependence of the data is population of ground-state hot vibrational states as an explanation for the formation of the O,O isomer following excitation of the S,S isomer. However, this explanation seems non-intuitive given that the bis- or double isomerization product is formed to a greater extent at lower energy excitation. Nevertheless, we collected pump–probe data at 20 °C, −19 °C, and −38 °C and compared the product distributions. Plots of the representative data are shown in Fig. S28 and S29.† While the product ratio at lower temperatures favours the S,O isomer, there is still evidence for substantial production of the O,O isomer. This result suggests that ground-electronic-state hot vibrational states are not solely responsible for the formation of the O,O product following excitation of the S,S ground-state isomer.
Another possible consideration for the wavelength dependence of the data is population of discreet non-interacting triplet excited states through local heating (energy non-radiatively dissipated from IC and ISC). As cooling the sample bath only effects the bulk temperature of the solution, this hypothesis was tested by comparing pump–probe data collected in propylene carbonate to that in ethylene glycol. While again this hypothesis is non-intuitive for the same reasons above, the greater viscosity of the ethylene glycol should raise excited state activation barriers to counteract the effects from local heating. Plots of the representative data (Fig. S27)† depict a small change in the product ratio favouring the S,O isomer. This result suggests that there is a higher activation barrier to O,O isomer formation, which is logical as both sulfoxides must isomerize. However, this result argues against excited state local heating driving the reactivity as one would expect higher energy excitation to yield more O,O- isomer instead of less. More about the discreet non-interacting triplet excited states will be discussed below with the 77 K emission experiments.
Pump–probe transient absorption of cis-O,O-[Ru(bpy)2(DMSO)2]2+
The original mechanistic proposal derived from complex 2 features an excited state surface with all three species in thermal equilibrium at room temperature.27 This suggests that excitation of the O,O-bonded isomer should yield both S,O and S,S ground-state isomers, an assertion inconsistent with the bulk photolysis data. To that end, we have collected pump–probe data on the O,O isomer to determine if an excited-state pathway is present that allows for the formation of either the S,O or S,S isomer from the O,O isomer. To ensure O,O isomer excitation, a 405 nm CW diode is included in our experimental apparatus in order to irradiate the 50 ml flow cell solution volume with stirring for the duration of the O,O pump–probe experiment. Shown in Fig. 3 are the steady-state and time-resolved absorption spectra for the O,O-bonded isomer. Panel A displays the linear absorption spectra of the O,O isomer obtained from bulk photolysis. Panels B (0.7 to 20 ps) and C (20 to 3000 ps) display the pump–probe transient spectra collected at different time delays for a 495 nm excitation wavelength. The O,O isomer shows data prototypical of a 3MLCT excited state through the course of the experiment, as evidenced by the appearance of a ground-state bleach associated with loss of the O,O ground state, and excited-state absorptions near 390 nm and at wavelengths longer than ∼600 nm. In sum, the data do not reveal evidence of isomerization to S,S or S,O isomers. This is supported by the observation of a transient spectrum on a nanosecond timescale that is indistinguishable from the zero line, indicating that the initial and final spectrum in the experiment is identical and that there is no net photochemistry. Again, single-wavelength kinetic fitting (see Fig. S23†) is consistent with Global kinetic analysis (Fig. S24 and S25†), which yields three time constants of 3.3 ± 0.2, 83 ± 28, and ∼7000 ps. Unfortunately, the third time constant falls between the instrumental limitations of our ultrafast pump–probe spectrometer and our nanosecond flash photolysis equipment leaving us with large error and an imprecise lifetime. This final time constant is ascribed to relaxation to the ground-state O,O isomer. The 3.3 ± 0.2 ps time constant is assigned to a mixture of solvent reorganization and formation of a thermalized O,O-isomer MLCT excited state.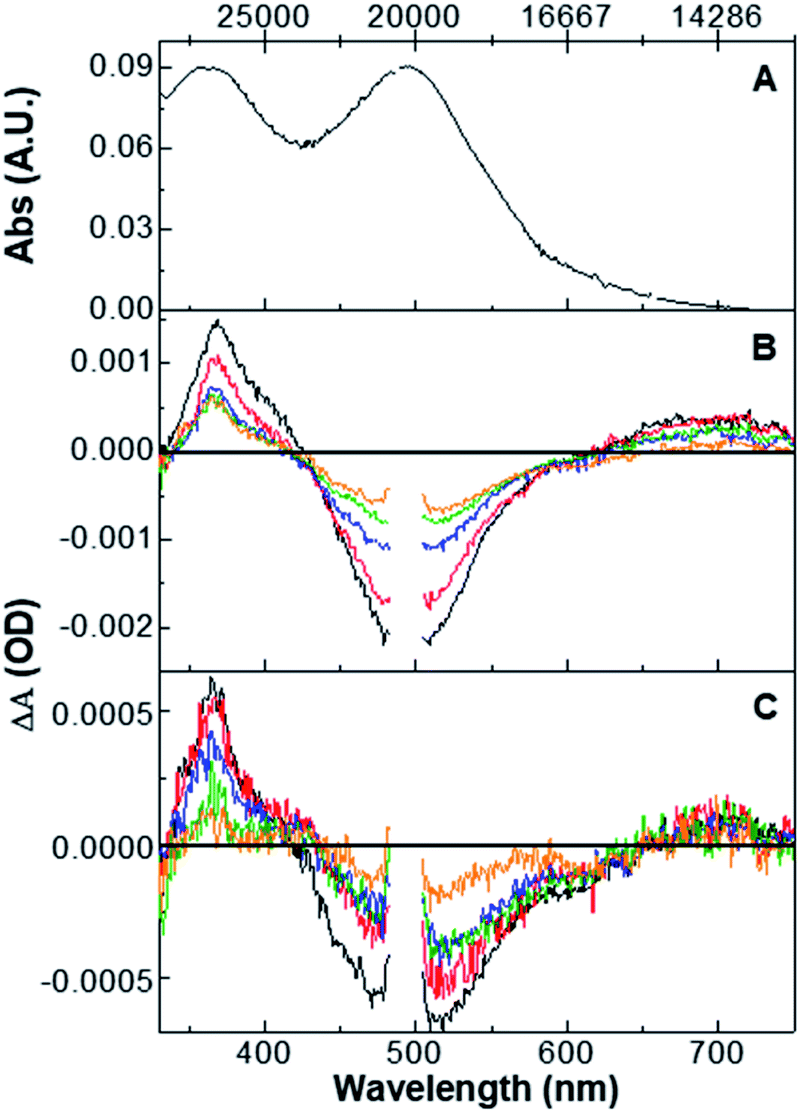 | ||
| Fig. 3 (A) Steady-state absorption spectrum of O,O-[Ru(bpy)2(DMSO)2]2+ (black). (B) O,O isomer transient spectra at 495 nm excitation obtained at pump–probe delays of 0.7 (black), 2 (red), 6 (blue), 12 (green), and 20 ps (orange). (C) Transient spectra obtained at pump–probe delays of 20 (black), 100 (red), 250 (blue), 1000 (green), and 3000 ps (orange). | ||
These results further confirm that the excited-state surface leading to isomerization is not characterized by all three isomers (S,S, S,O, and O,O) existing in equilibrium with one another. At the very least, the lowest-energy excited-state surface must feature a gradient in which the S,O and O,O isomers are thermodynamically downhill from the S,S isomer, such that the barrier crossing from O,O to S,O are too great at room temperature. Alternatively, excitation of the O,O-bonded singlet ground state to the 1MLCT eventually produces a thermally relaxed 3MLCT that is structurally and electronically distinct from that produced from excitation of the S,S-bonded ground state. There is no requirement that the motions that lead to isomerization from the S,S isomer are the same for the motions that would convert the O,O isomer to the S,O or S,S isomer, if such a pathway existed. Furthermore, if the isomeric structures had identical excited states, then one would anticipate the formation of S,O- and S,S-bonded isomers following excitation of the O,O-bonded isomer, which is not observed. Thus, the data show that an excited-state surface characterized by three isomers in equilibrium does not adequately describe the experimental data.
Quantum control of S,O and O,O photoproduct ratios through fs pulse shaping
It is well documented that the intersystem crossing time constant in [M(bpy)3]2+ (M = Fe, Ru, Os) is astonishingly rapid at ∼30–50 fs, as measured by numerous techniques.36,40 Now, we ask the question whether coherence effects explain the observed wavelength dependence as the molecule evolves from the singlet to triplet manifold. To that end, quantum control experiments were performed to determine if the product ratio would respond to changes in the shape of the pump pulse.41–45 Examples of closed-loop maximization of the product ratio O,O/S,O as well as of S,O/O,O following S,S excitation at 375 nm are shown in the ESI, Fig. S20 and S31.† No optimization was observed in either case. Similarly, scanning the second-order spectral phase with 355 nm excitation did not lead to any enhancement of one product over the other (Fig. S32†). While the shorter pulse reproduced the product distribution obtained with a longer pulse width, changes in the product distribution were not observed. A benefit of short pulse widths is the ability to observe vibrational coherence in the transient absorption response.An oscillation is observed predominantly in the 342 and 371 nm kinetic trace following 355 nm excitation with an oscillation period of ∼80 fs, corresponding to a vibration of ∼420 cm−1 (ESI, Fig. S33†). It is not immediately clear if this oscillation is due to ruthenium donor atom stretches (e.g., ν(Ru–S), ν(Ru–N)) or ligand torsional vibrations,1,46–48 or if this is more appropriately assigned to the propylene carbonate solvent that exhibits a strong Raman band at this energy.49 We suspect that the latter argument is a better descriptor of the observed oscillations as the 342 nm kinetic displays stronger oscillations than the 371 nm kinetic trace. If the oscillations were tied with low energy ruthenium ligand vibrational modes, then we would expect that the stronger signal will be observed at 371 nm (bpy- π* to π* absorption) over 342 nm. Moreover, the observation of solvent coherence in the transient absorption of ruthenium polypyridyl complexes is not completely surprising as the solvent is known to direct the early excited state dynamics via selection of one bipyridine for electron localization in [Ru(bpy)3]2+.50,51 With solvent domination of the early femtosecond timescale molecular vibrations along the PES, it is conceivable that the fs pulse shaping will not generate large enough changes along the 3MLCTS,S PES to alter the S,O and O,O product distribution. We subsequently deduce that solvent control of the early dynamics will force the bifurcation of the excited-state complex responsible for S,O or O,O formation to be determined at later times (>1 ps), while on the thermally relaxed 3MLCTS,S PES. These data and analysis are consistent with our earlier gas phase isomerization measurements that supported a determining role for the solvent.31
Pump–repump–probe (PRP) transient absorption of cis-[Ru(bpy)2(DMSO)2]2+
In order to more precisely define when bifurcation occurs along the 3MLCT surface, we employed PRP experiments consisting of either 355 or 390 nm excitation pump of the S,S isomer followed by a 400 nm repump with time delays of ∼0.5, ∼3, and ∼675 ps (approximate times reflect variation in the repump delay over numerous experiments). We reasoned that if the timing of the second pump (i.e., the repump) pulse coincided with bifurcation, then one might observe a perturbation or change in the S,O/O,O product ratio relative to the pump–probe experiment without the repump pulse. The pump wavelengths were chosen because these show the greatest change in the S,O/O,O product distribution ratio. The 400 nm repump wavelength was chosen because it overlaps well with an excited-state absorption assigned to bpy π* → π* transition. Similar PRP experiments have demonstrated increased QY in other molecules with single photochromic units, though there are few examples of coupled photochromes.41,52,53 The results are displayed in Table 2 and plots are found in the ESI (Fig. S35 to S40†).We determine these product ratios taking the ΔA at 400 nm and dividing by the ΔA at 500 nm (Fig. S26†). As stated above, by averaging the last 10 ps of pump–probe data, we feel that these spectra capture the true S,O- and O,O-isomer product distributions. That is, isomerization is complete and we are not relying on any one particular transient absorption spectrum to report the product distribution. In order to compare the excitation wavelength dependence, we then plotted these spectra and normalized the absorbance at 500 nm (Fig. 2 and S26†).
An S,O/O,O product ratio of 1.75 is found for the standard pump–probe experiment with 355 nm excitation and no repump excitation. This serves as a benchmark value in order to determine if the PRP experiments alter the product ratio. PRP experiments (355 nm pump; 400 nm repump) with time delays of 0.5 and 675 ps yield product ratios of 1.66 and 1.60, respectively (column heading “355 nm; 400 nm”). The decrease in S,O/O,O ratio is interpreted as an increase in the formation of the O,O isomer. For the 675 ps time delay, the 400 nm repump pulse is simply exciting a population of ground-state S,O isomer formed following the initial 355 nm pump pulse, as the photochemical reaction from excitation of the S,S isomer is nearly complete by this time (see Fig. 1). Numerous runs of this experiment suggest that the absolute difference in the ratios (1.75 versus 1.60) is significant albeit modest, though we are uncertain how to assess error precisely and reliably to these values. Indeed, the product ratio is determined through division of difference spectra. Importantly, we note that the 400 nm repump of the bipyridine π* → π* transition does not yield a pump–dump–probe response of either pathway as an instantaneous photoproduct formation is not observed in the spectral traces (Fig. S6a–f†). This observation further supports our assertion that the change in the product distribution is due to excitation of the newly formed ground state S,O isomer. For the 0.5 ps time delay, the increase in the relative amount of O,O isomer suggests some re-direction of the fate of the excited-state population such that more O,O isomer is formed. This may simply be thought of as a scrambling of the excited-state population. Again, the effect is modest, but it does indicate that the timing of the pulse with the bifurcation event is not coincident.
Surprisingly, an S,O/O,O ratio of 2.35 is observed with a 355 nm pump-400 nm repump delay of ∼3 ps. This is interpreted as an increase in the relative concentration of the S,O isomer with respect to the pump–probe measurement (S,O/O,O = 1.75). A similar trend is observed for the 390 nm pump-400 nm repump–probe experiments, indicating that the effect is not unique to a single pair of pump repump wavelengths. Δ(ΔA) kinetic traces were fit for both the 355 and 390 nm pump–repump–probe experiments at an intermediate repump delay of ∼3 ps to yield a new 5 ps time constant after the repump (Fig. S42†). A 1 to 10 ps time constant is typically observed in ruthenium sulfoxide pump–probe experiments (and other [Ru(bpy)3]2+-type chromophores) and is ascribed to a combination of solvent reorganization and intramolecular vibrational redistribution (IVR) processes to form a thermally relaxed state from which isomerization occurs, as noted above. We interpret the appearance of a second 5 ps time constant as the relaxation of the S,O-isomer to the isomerizing surface from higher-lying CT states. We propose that this isomer has a conformation prone to relaxation to the ground state S,O surface. In sum, these data suggest that a time delay of ∼3 ps in the PRP experiments appears to coincide with the arrival of the molecule near or at a bifurcation point on the MLCT excited-state surface.
Based on the results above, we conducted PRP experiments on the O,O isomer consisting of a 500 nm pump excitation followed by a 400 nm repump time delay of ∼3 ps. Following the repump pulse, a new negative signal from 400–480 nm as well as an induced excited-state absorption from 500 to 650 nm are observed with a lifetime of 14.8 ± 1.9 ps (ESI, Fig. S41†). Moreover, this new repump state relaxes to a spectrum with a positive signature at 355 nm and a bleach across the visible region (400–650 nm). We interpret this result as evidence for the formation of the S,S isomer after the repump pulse. This result contrasts with the pump–probe measurement that did not reveal a photochemical O,O → S,S or O,O → S,O pathway. The nature of the higher-lying CT surface coupling to the isomerizing surface and ground states will be addressed in subsequent publications.
Low-temperature emission spectroscopy
Emission experiments at 77 K were conducted to address whether or not the emitting MLCT states formed from different excitation energies are identical. Unlike room-temperature measurements, non-adiabatic coupling at 77 K in the isomerization reaction is negligible allowing us to predominantly probe the S,S-isomer excited state. Depicted in Fig. 4 are the instrument corrected 77 K emission spectra for S,S-bonded compound 3 at 350, 370, 400, 430, 460, and 490 nm excitations. For clarity, the 77 K emission spectrum of [Ru(bpy)3]2+ (black dashed line) has been added as well as four vertical dashed lines to highlight the peak progression. The emission spectrum at 350 nm excitation is assigned to emission from the S,S-bonded isomer. The emission spectrum features four resolved peaks at 21410, 20120, 18660, and 17330 cm−1. At lower-energy excitation, a second species is observed ranging from 18000 to 14000 cm−1. This second species is tentatively assigned to a small amount of S,O isomer, which is below the detection limits of NMR. The 77 K emission spectra of the S,O and O,O isomers may be found in ESI (Fig. S45†). An interesting observation of the S,S emission (Fig. 4A and B) is that the emission peaks are well resolved with the highest energy peak (21410 cm−1) displaying a lower intensity than the second peak (20120 cm−1).
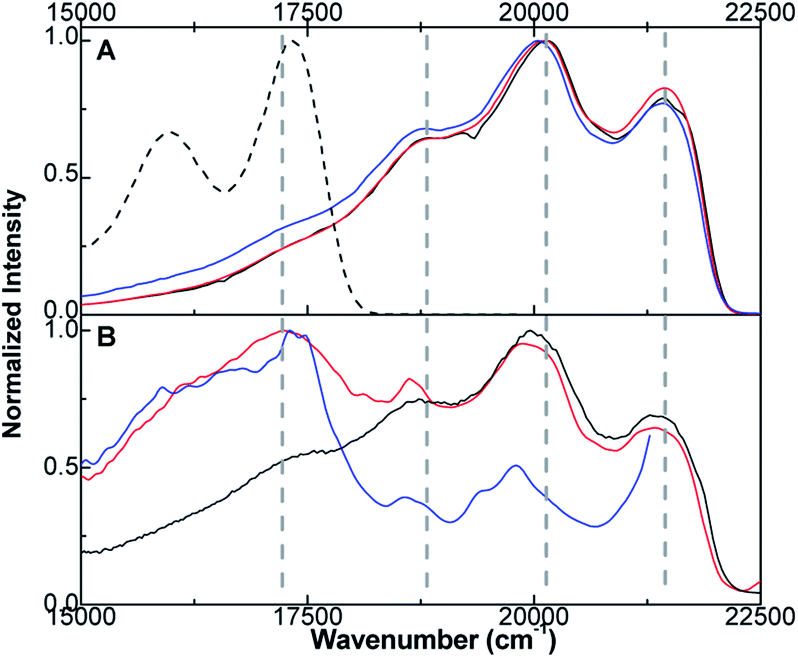 | ||
| Fig. 4 (A) Emission spectra of S,S isomer for compound 3 at 350 (black), 370 (red), and 400 (blue) nm excitation. The emission spectrum of [Ru(bpy)3]2+ (black dashed line) is shown for comparison. Four vertical dashed lines are added for comparison of peak maxima at 21410, 20120, 18660, and 17330 cm−1. (B) Emission spectra of S,S isomer for compound 3 at 415 (black), 430 (red), and 460 (blue) nm excitation. | ||
While uncommon for the vast majority of ruthenium polypyridyl complexes (see spectrum of [Ru(bpy)3]2+, Fig. 4A), this type of peak intensity ordering has been observed with [Ru(CH3CN)4(bpy)]2+ and [Ru(aneS4)(bpy)]2+ (where aneS4 is 1,4,8,11-tetrathiacyclotetradecane), where the emission peaks are ascribed to higher energy 3MLCT excited states.54–56 This differs from the standard Meyer analysis of ruthenium polypyridyl emission spectra, where the vibronic progression can be fit by a two-mode approximation of ∼1300 cm−1 (bipyridine localized vibrations) and ∼400 cm−1 (metal–ligand torsion).1 Moreover, as the excitation wavelength moves to lower energy (Fig. 4B), the 20120 cm−1 peak changes in shape and position to lower energy. We interpret this shift to mean that lower energy excitation(s) of the S,S isomer is coupled to different 3MLCT states. In aggregate, the 77 K emission data point to the creation of different emitting states following excitation of the S,S-isomer. Presumably, population of these 3MLCT states at room temperature leads to the observed wavelength dependence of the photoisomerization product distribution.
A new mechanistic hypothesis
Given the data presented thus far, we now propose the following model. Excitation of the ground state S,S-isomer produces a 1MLCTS,S state that rapidly and efficiently intersystem crosses into the 3MLCTS,S manifold. Coincident with this process, solvent reorganizes around the molecule stabilizing one bipyridine over another, thus mitigating coherence effects. The excitation wavelength appears to project the molecule away from the Franck–Condon region towards different products. There are likely many common vibrations that are conserved along the distinct S,O- and O,O- reaction coordinates. Accordingly, there must be multiple saddle points and bifurcation regions on this relatively flat potential energy surface. A critical juncture is reached approximately 3 ps after excitation, where depending upon the precise energy and structure of the complex, sub-populations of the excited state ensemble pass through this region ultimately leading to an asymmetric product distribution (Fig. 5). In this model, the transition states along the MLCT surface for conversion from S,S → S,O and S,S → O,O are similar in energy. The pump–probe data suggest that the MLCT state is lowest in energy (as opposed to LF or metal-centered) as evidenced by the presence of excited state absorptions near 375 and 650 nm throughout the experiment. The LF or metal-centered states may be thermally accessible and may well be activated during isomerization, but this study does not address their role. Lastly, the overall gradient of MLCT surface from S,S to O,O is negative and does not permit a photochemical O,O → S,O or O,O → S,S pathway. However, such a pathway can be found upon excitation of the O,O excited state (pump–repump–probe).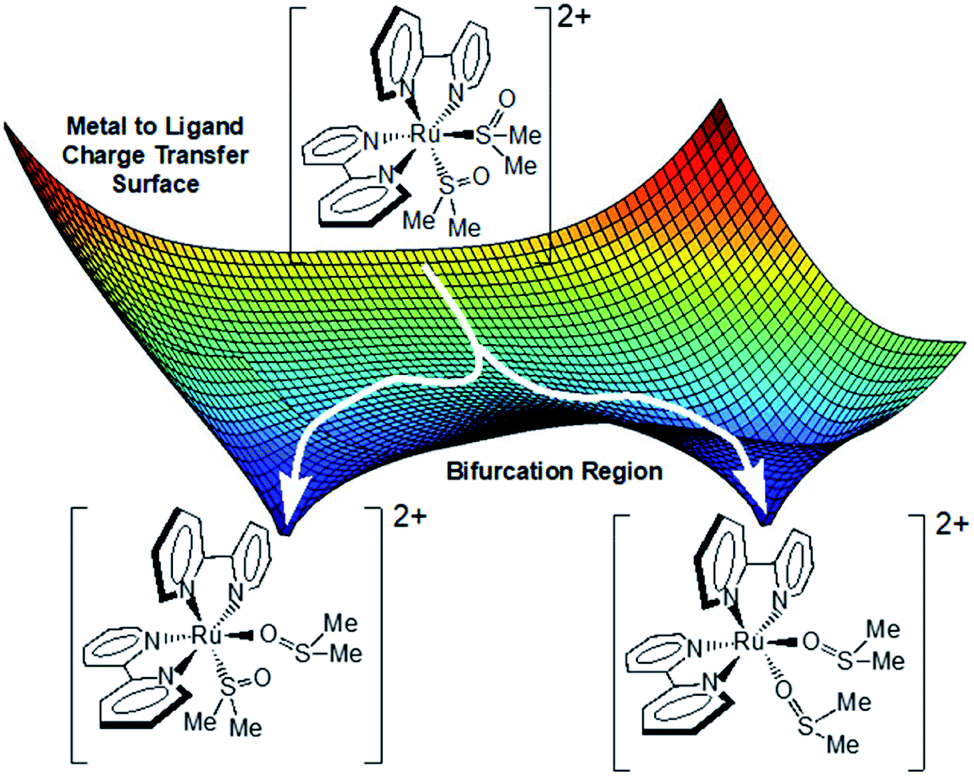 | ||
| Fig. 5 Proposed photochemical mechanistic model for the isomerization of complex 3. The surface depicted is the lowest energy excited state surface from where isomerization occurs. | ||
Conclusion
We have documented an unusual wavelength dependence in the photoisomerization of cis-S,S-[Ru(bpy)2(DMSO)2]2+ to produce cis-S,O-[Ru(bpy)2(DMSO)2]2+ and cis-O,O-[Ru(bpy)2(DMSO)2]2+. Through these studies, we have found that the two isomerization pathways are independent and not in equilibrium along the excited-state surface. Moreover, we postulate that the mechanism for the wavelength dependence on the product distribution originates from intersection of the excited molecule at a bifurcation point on the isomerization potential energy surface. It may be that this bifurcation point reflects the intersection of different MLCT and/or LF potential energy surfaces. Finally, we have also found a nontrivial role of higher-lying CT states in the final isomer photoproduct distribution.Conflicts of interest
There are no conflicts to declare.Acknowledgements
JJR acknowledges NSF (Grant CHE 1602240 and CHE 1856492) and the University of New Mexico for financial support.Notes and references
- A. Ito and T. J. Meyer, The Golden Rule. Application for fun and profit in electron transfer, energy transfer, and excited-state decay, Phys. Chem. Chem. Phys., 2012, 14(40), 13731–13745 RSC.
- M. Chergui, Ultrafast Photophysics of Transition Metal Complexes, Acc. Chem. Res., 2015, 48(3), 801–808 CrossRef CAS PubMed.
- J. C. Dean and G. D. Scholes, Coherence Spectroscopy in the Condensed Phase: Insights into Molecular Structure, Environment, and Interactions, Acc. Chem. Res., 2017, 50(11), 2746–2755 CrossRef CAS.
- B. D. Datko, M. Y. Livshits, Z. Zhang, D. Portlock, Y. Qin, J. J. Rack and J. K. Grey, Unravelling the enigma of ultrafast excited state relaxation in non-emissive aggregating conjugated polymers, Phys. Chem. Chem. Phys., 2018, 20, 22159–22167 RSC.
- J. K. McCusker, Electronic structure in the transition metal block and its implications for light harvesting, Science, 2019, 363, 484–488 CrossRef CAS PubMed.
- J. Ghosh, H. Gajapathy, A. Konar, G. M. Narasimhaiah and A. Bhattacharya, Sub-500 fs electronically nonadiabatic chemical dynamics of energetic molecules from the S1 excited state: Ab initio multiple spawning study, J. Chem. Phys., 2017, 147(20), 204302 CrossRef PubMed.
- Q. Hu, H. Song, C. J. Johnson, J. Li, H. Guo and R. E. Continetti, Imaging a multidimensional multichannel potential energy surface: photodetachment of H–(NH3) and NH4−, J. Chem. Phys., 2016, 144(24), 244311 CrossRef PubMed.
- D. H. Ess, S. E. Wheeler, R. G. Iafe, L. Xu, N. Çelebi-Ölçüm and K. N. Houk, Bifurcations on Potential Energy Surfaces of Organic Reactions, Angew. Chem., Int. Ed., 2008, 47(40), 7592–7601 CrossRef CAS PubMed.
- P. G. Wenthold, D. A. Hrovat, W. T. Borden and W. C. Lineberger, Transition-State Spectroscopy of Cyclooctatetraene, Science, 1996, 272(5267), 1456 CrossRef CAS PubMed.
- B. R. Ussing, C. Hang and D. A. Singleton, Dynamic Effects on the Periselectivity, Rate, Isotope Effects, and Mechanism of Cycloadditions of Ketenes with Cyclopentadiene, J. Am. Chem. Soc., 2006, 128(23), 7594–7607 CrossRef CAS PubMed.
- Z. Yang, X. Dong, Y. Yu, P. Yu, Y. Li, C. Jamieson and K. N. Houk, Relationships between Product Ratios in Ambimodal Pericyclic Reactions and Bond Lengths in Transition Structures, J. Am. Chem. Soc., 2018, 140(8), 3061–3067 CrossRef CAS PubMed.
- O. Castaño, R. Palmeiro, L. M. Frutos and J. Luisandrés, Role of bifurcation in the bond shifting of cyclooctatetraene, J. Comput. Chem., 2002, 23(7), 732–736 CrossRef PubMed.
- R. R. Frontiera, C. Fang, J. Dasgupta and R. A. Mathies, Probing structural evolution along multidimensional reaction coordinates with femtosecond stimulated Raman spectroscopy, Phys. Chem. Chem. Phys., 2012, 14(2), 405–414 RSC.
- T. Österman, M. Abrahamsson, H.-C. Becker, L. Hammarström and P. Persson, Influence of Triplet State Multidimensionality on Excited State Lifetimes of Bis-tridentate Ruii Complexes: A Computational Study, J. Phys. Chem. A, 2012, 116(3), 1041–1050 CrossRef PubMed.
- H. Durr, Photochromism – Molecules and Systems, 2003, pp. 1–14 Search PubMed.
- J. J. Rack, Excited state isomerization in photochromic ruthenium complexes, Zeitschrift Fur Kristallographie, 2008, 223(4–5), 356–362 CAS.
- J. J. Rack, Electron transfer triggered sulfoxide isomerization in ruthenium and osmium complexes, Coord. Chem. Rev., 2009, 253(1–2), 78–85 CrossRef CAS.
- J. J. Rack, J. R. Winkler and H. B. Gray, Phototriggered Ru(ii)–Dimethylsulfoxide Linkage Isomerization in Crystals and Films, J. Am. Chem. Soc., 2001, 123(10), 2432–2433 CrossRef CAS PubMed.
- J. J. Rack and N. V. Mockus, Room-Temperature Photochromism in cis- and trans-[Ru(bpy)2(dmso)2]2+, Inorg. Chem., 2003, 42(19), 5792–5794 CrossRef CAS PubMed.
- K. S. Volker Dieckmann, S. Eicke, M. Imlau and J. J. Rack, Thermal stability, photochromic sensitivity and optical properties of [Ru(bpy)2(OSOR)]+ compounds with R = Bn, BnCl, BnMe, Optics Express, 2010, 18(22), 23495–23503 CrossRef PubMed.
- J. J. R. D. Beth Anne McClure, Two-Color Reversible Switching in a Photochromic Ruthenium Sulfoxide Complex, Angew. Chem., Int. Ed., 2009, 48(45), 8556–8558 CrossRef PubMed.
- A. W. King, B. A. McClure, Y. Jin and J. J. Rack, Investigating the Effects of Solvent on the Ultrafast Dynamics of a Photoreversible Ruthenium Sulfoxide Complex, J. Phys. Chem. A, 2014, 118(45), 10425–10432 CrossRef CAS PubMed.
- S. Shoko, S. Ryota and N. Hiroshi, Two-way Linkage Photoisomerization of [Ru(2,2′:6′,2′′-terpyridine)(6-{(methylsulfinyl)methyl}picolinate)]BF4, Chem. Lett., 2013, 42(1), 17–18 CrossRef.
- M. K. Smith, J. A. Gibson, C. G. Young, J. A. Broomhead, P. C. Junk and F. R. Keene, Photoinduced Ligand Isomerization in Dimethyl Sulfoxide Complexes of Ruthenium(ii), Eur. J. Inorg. Chem., 2000, 2000(6), 1365–1370 CrossRef.
- A. A. Rachford, J. L. Petersen and J. J. Rack, Phototriggered sulfoxide isomerization in [Ru(pic)2(dmso)2], Dalton Trans., 2007,(30), 3245–3251 RSC.
- A. W. King, J. P. Malizia, J. T. Engle, C. J. Ziegler and J. J. Rack, Ultrafast spectroscopy and structural characterization of a photochromic isomerizing ruthenium bis-sulfoxide complex, Dalton Trans., 2014, 43(47), 17847–17855 RSC.
- K. Garg, A. W. King and J. J. Rack, One Photon Yields Two Isomerizations: Large Atomic Displacements during Electronic Excited-State Dynamics in Ruthenium Sulfoxide Complexes, J. Am. Chem. Soc., 2014, 136(5), 1856–1863 CrossRef CAS.
- A. W. King, Y. Jin, J. T. Engle, C. J. Ziegler and J. J. Rack, Sequential Picosecond Isomerizations in a Photochromic Ruthenium Sulfoxide Complex Triggered by Pump–Repump–Probe Spectroscopy, Inorg. Chem., 2013, 52, 2086–2093 CrossRef CAS PubMed.
- N. V. Mockus, D. Rabinovich, J. L. Petersen III and J. J. Rack I, Femtosecond Isomerization in a Photochromic Molecular Switch, Angew. Chem., Int. Ed., 2008, 120(8), 1480–1483 CrossRef.
- A. W. King, L. Wang and J. J. Rack, Excited State Dynamics and Isomerization in Ruthenium Sulfoxide Complexes, Acc. Chem. Res., 2015, 48(4), 1115–1122 CrossRef CAS PubMed.
- M. S. Scholz, J. N. Bull, E. Carrascosa, B. D. Adamson, G. K. Kosgei, J. J. Rack and E. J. Bieske, Linkage Photoisomerization of an Isolated Ruthenium Sulfoxide Complex: Sequential versus Concerted Rearrangement, Inorg. Chem., 2018, 57(9), 5701–5706 CrossRef CAS PubMed.
- A. J. Göttle, F. Alary, I. M. Dixon, J.-L. Heully and M. Boggio-Pasqua, Unravelling the S → O Linkage Photoisomerization Mechanisms in cis- and trans-[Ru(bpy)2(DMSO)2]2+ Using Density Functional Theory, Inorg. Chem., 2014, 53(13), 6752–6760 CrossRef PubMed.
- M. Montalti, Chemical Actinometry, in Handbook of Photochemistry, ed. Credi A., Prodi L. and Gandolfi M. T., CRC, Boca Raton, FL, 2006, 3rd edn, pp. 601–603 Search PubMed.
- H. J. Kuhn, S. E. Braslavsky and R. Schmidt, Chemical Actinometry, Pure Appl. Chem., 2004, 76(12), 2105–2146 CAS.
- E. Fisher, Ferri-Oxalate Actinometry, EPA Newsletters, 1984, vol. 21, pp. 33–34 Search PubMed.
- N. H. Damrauer, G. Cerullo, A. Yeh, T. R. Boussie, C. V. Shank and J. K. McCusker, Femtosecond Dynamics of Excited-State Evolution in [Ru(bpy)3]^{2+}, Science, 1997, 275(5296), 54–57 CrossRef CAS PubMed.
- Q. Sun, S. Mosquera-Vazquez, L. M. Lawson Daku, L. Guénée, H. A. Goodwin, E. Vauthey and A. Hauser, Experimental Evidence of Ultrafast Quenching of the 3MLCT Luminescence in Ruthenium(ii) Tris-bipyridyl Complexes via a 3dd State, J. Am. Chem. Soc., 2013, 135(37), 13660–13663 CrossRef CAS PubMed.
- N. H. Damrauer and J. K. McCusker, Ultrafast Dynamics in the Metal-to-Ligand Charge Transfer Excited-State Evolution of [Ru(4,4′-diphenyl-2,2′-bipyridine)3]2+, J. Phys. Chem. A, 1999, 103(42), 8440–8446 CrossRef CAS.
- N. H. Damrauer and J. K. McCusker, Variable-Temperature Emission Studies of Solvation Dynamics: Evidence for Coupling of Solvation to Chromophore Structural Dynamics in the Evolution of Charge-Transfer Excited States, Inorg. Chem., 1999, 38(19), 4268–4277 CrossRef CAS.
- S. Yoon, P. Kukura, C. M. Stuart and R. A. Mathies, Direct observation of the ultrafast intersystem crossing in tris(2,2′-bipyridine)ruthenium(ii) using femtosecond stimulated Raman spectroscopy, Mol. Phys., 2006, 104(8), 1275–1282 CrossRef CAS.
- P. Nuernberger, S. Ruetzel and T. Brixner, Multidimensional Electronic Spectroscopy of Photochemical Reactions, Angew. Chem., Int. Ed., 2015, 54(39), 11368–11386 CrossRef CAS.
- S. A. Rice and M. Zhao, Optical Control of Molecular Dynamics, Wiley, 2000 Search PubMed.
- M. Shapiro and P. Brumer, Quantum Control of Molecular Processes, Wiley, 2012 Search PubMed.
- T. Brixner and G. Gerber, Quantum Control of Gas-Phase and Liquid-Phase Femtochemistry, ChemPhysChem, 2003, 4(5), 418–438 CrossRef CAS PubMed.
- P. Nuernberger, G. Vogt, T. Brixner and G. Gerber, Femtosecond quantum control of molecular dynamics in the condensed phase, Phys. Chem. Chem. Phys., 2007, 9(20), 2470–2497 RSC.
- J. R. Schoonover and G. F. Strouse, Time-Resolved Vibrational Spectroscopy of Electronically Excited Inorganic Complexes in Solution, Chem. Rev., 1998, 98(4), 1335–1356 CrossRef CAS PubMed.
- K. C. Gordon and J. J. McGarvey, Time-Resolved Resonance Raman Spectroscopy of Bis(2,9-dimethyl-1,10-phenanthroline)Copper(1+) in Solution, Inorg. Chem., 1991, 30(15), 2986–2989 CrossRef CAS.
- O. Poizat and C. Sourisseau, Infrared, Raman and resonance Raman studies of the Ru(2,2′-bipyridine)32+ cation in its chloride crystal and as an intercalate in the layered manganese phosphide sulfide (MnPS3) compound, J. Phys. Chem., 1984, 88(14), 3007–3014 CrossRef CAS.
- G. J. Janz, J. Ambrose, J. W. Coutts and J. R. Downey, Raman spectrum of propylene carbonate, Spectrochim. Acta, Part A, 1979, 35(2), 175–179 CrossRef.
- S. Wallin, J. Davidsson, J. Modin and L. Hammarström, Femtosecond Transient Absorption Anisotropy Study on [Ru(bpy)3]2+ and [Ru(bpy)(py)4]2+. Ultrafast Interligand Randomization of the MLCT State, J. Phys. Chem. A, 2005, 109(21), 4697–4704 CrossRef CAS PubMed.
- A. T. Yeh, C. V. Shank and J. K. McCusker, Ultrafast Electron Localization Dynamics Following Photo-Induced Charge Transfer, Science, 2000, 289(5481), 935–938 CrossRef CAS PubMed.
- C. L. Ward and C. G. Elles, Controlling the Excited-State Reaction Dynamics of a Photochromic Molecular Switch with Sequential Two-Photon Excitation, J. Phys. Chem. Lett., 2012, 3(20), 2995–3000 CrossRef CAS PubMed.
- J. Buback, M. Kullmann, F. Langhojer, P. Nuernberger, R. Schmidt, F. Würthner and T. Brixner, Ultrafast Bidirectional Photoswitching of a Spiropyran, J. Am. Chem. Soc., 2010, 132(46), 16510–16519 CrossRef CAS PubMed.
- A. Petroni, L. D. Slep and R. Etchenique, Ruthenium(II) 2,2′-Bipyridyl Tetrakis Acetonitrile Undergoes Selective Axial Photocleavage, Inorg. Chem., 2008, 47(3), 951–956 CrossRef CAS PubMed.
- R. L. Lord, M. M. Allard, R. A. Thomas, O. S. Odongo, H. B. Schlegel, Y.-J. Chen and J. F. Endicott, Computational Modeling of the Triplet Metal-to-Ligand Charge-Transfer Excited-State Structures of Mono-Bipyridine–Ruthenium(II) Complexes and Comparisons to their 77 K Emission Band Shapes, Inorg. Chem., 2013, 52(3), 1185–1198 CrossRef CAS PubMed.
- H. Adams, A. M. Amado, V. Félix, B. E. Mann, J. Antelo-Martinez, M. Newell, P. J. A. Ribeiro-Claro, S. E. Spey and J. A. Thomas, RuII Complexes Incorporating Tetrathiamacrocycles: Synthesis and Conformational Analysis, Chem.–Eur. J., 2005, 11(7), 2031–2046 CrossRef CAS PubMed.
Footnote |
| † Electronic supplementary information (ESI) available: Instrumentation details and procedures for QY, fs pump–probe TA spectra and kinetic fitting for S,S and O,O cis-[Ru(bpy)2(DMSO)2]2+, temperature and solvent dependent fs pump–probe TA of S,S cis-[Ru(bpy)2(DMSO)2]2+, fs pump–repump–probe TA of S,S and O,O cis-[Ru(bpy)2(DMSO)2]2+, 77 K emission spectra of O,S and O,O cis-[Ru(bpy)2(DMSO)2]2+, fs pulse shaping of S,S cis-[Ru(bpy)2(DMSO)2]2+. See DOI: 10.1039/d0sc00551g |
| This journal is © The Royal Society of Chemistry 2020 |