
 Open Access Article
 This Open Access Article is licensed under a Creative Commons Attribution-Non Commercial 3.0 Unported Licence
Triblock polyester thermoplastic elastomers with semi-aromatic polymer end blocks by ring-opening copolymerization†
Georgina L.
Gregory
 a,
Gregory S.
Sulley
a,
Leticia Peña
Carrodeguas
a,
Thomas T. D.
Chen
a,
Alba
Santmarti
b,
Nicholas J.
Terrill
c,
Koon-Yang
Lee
b and
Charlotte K.
Williams
*a
a,
Gregory S.
Sulley
a,
Leticia Peña
Carrodeguas
a,
Thomas T. D.
Chen
a,
Alba
Santmarti
b,
Nicholas J.
Terrill
c,
Koon-Yang
Lee
b and
Charlotte K.
Williams
*a
aOxford Chemistry, Chemistry Research Laboratory, 12 Mansfield Road, Oxford, OX1 3TA, UK. E-mail: Charlotte.williams@chem.ox.ac.uk
bDepartment of Aeronautical Engineering, Imperial College London, London, SW7 2AZ, UK
cDiamond Light Source, Harwell Science and Innovation Campus, Didcot, Harwell OX11 0DE, UK
First published on 4th May 2020
Abstract
Thermoplastic elastomers benefit from high elasticity and straightforward (re)processability; they are widely used across a multitude of sectors. Currently, the majority derive from oil, do not degrade or undergo chemical recycling. Here a new series of ABA triblock polyesters are synthesized and show high-performances as degradable thermoplastic elastomers; their composition is poly(cyclohexene-alt-phthalate)-b-poly(ε-decalactone)-b-poly(cyclohexene-alt-phthalate) {PE–PDL–PE}. The synthesis is accomplished using a zinc(II)/magnesium(II) catalyst, in a one-pot procedure where ε-decalactone ring-opening polymerization yielding dihydroxyl telechelic poly(ε-decalatone) (PDL, soft-block) occurs first and, then, addition of phthalic anhydride/cyclohexene oxide ring-opening copolymerization delivers semi-aromatic polyester (PE, hard-block) end-blocks. The block compositions are straightforward to control, from the initial monomer stoichiometry, and conversions are high (85–98%). Two series of polyesters are prepared: (1) TBPE-1 to TBPE-5 feature an equivalent hard-block volume fraction (fhard = 0.4) and variable molar masses 40–100 kg mol−1; (2) TBPE-5 to TBPE-9 feature equivalent molar masses (∼100 kg mol−1) and variable hard-block volume fractions (0.12 < fhard < 0.4). Polymers are characterized using spectroscopies, size-exclusion chromatography (SEC), thermal gravimetric analysis (TGA), differential scanning calorimetry (DSC) and dynamic mechanical thermal analysis (DMTA). They are amorphous, with two glass transition temperatures (∼−51 °C for PDL; +138 °C for PE), and block phase separation is confirmed using small angle X-ray scattering (SAXS). Tensile mechanical performances reveal thermoplastic elastomers (fhard < 0.4 and N > 1300) with linear stress–strain relationships, high ultimate tensile strengths (σb = 1–5 MPa), very high elongations at break (εb = 1000–1900%) and excellent elastic recoveries (98%). There is a wide operating temperature range (−51 to +138 °C), an operable processing temperature range (+100 to +200 °C) and excellent thermal stability (Td,5% ∼ 300 °C). The polymers are stable in aqueous environments, at room temperature, but are hydrolyzed upon gentle heating (60 °C) and treatment with an organic acid (para-toluene sulfonic acid) or a common lipase (Novozyme® 51032). The new block polyesters show significant potential as sustainable thermoplastic elastomers with better properties than well-known styrenic block copolymers or polylactide-derived elastomers. The straightforward synthesis allows for other commercially available and/or bio-derived lactones, epoxides and anhydrides to be developed in the future.
Introduction
Thermoplastic elastomers (TPEs) combine elasticity, straightforward thermal processing and recyclability. Unlike conventional rubbers, TPEs are re-processable and amenable to manufacture in large volumes via high-throughput melt extrusion or injection moulding.1–5 Consequently, TPEs are widely applied, often in polymer blends, in electronics, packaging, automotive components, medical devices, coatings, fibres, tyres, sporting goods, footwear and as pressure-sensitive adhesives.1,2 Globally, the TPE market was 4.2 million tonnes in 2017 and is forecast to reach 5.5 million tonnes in 2022.6 The majority of commercial TPEs are petroleum-based, have a limited upper service temperature and have no ‘end-of-life’ degradability. High-performance elastomers showing enhanced heat resistance, higher resilience and extensibility would be useful for applications as electrolytes, nanoporous membranes, thin film lithography, stretchable optical fibres and shape-memory materials.7–9TPEs are typically ABA-type block copolymers, where ‘B’ is a soft rubbery material, with a glass transition temperature (Tg) below room temperature, that bridges between hard-glassy or semi-crystalline outer ‘A’ blocks, showing Tg or Tm values above room temperature.2 When the relative volume fractions of A and B are optimized, microphase separation of the blocks may occur yielding hard domains located within the soft matrix. Flexibility and extensibility arises from uncoiling of the soft B-blocks upon stretching and elastic recovery is provided by physical crosslinking of the hard A-blocks.10 It is well-known that block polymer phase separation depends upon the overall degree of polymerization N, the Flory–Huggins interaction parameter χ, the volume fraction of hard block fhard (i.e. the composition) and the polymer architecture.11,12
Styrenic block copolymers (SBC) are widely applied thermoplastic elastomers due to their predictable phase-separated micro-structures, low cost and ability to show stress–strain behaviours similar to some cross-linked rubber. They comprise polystyrene A-blocks and polyisoprene, polybutadiene or poly(ethylene butylene) B-blocks (SBS, SIS and SEBS).5 One drawback of all these materials is the limited upper use temperature which lies from 65 to 90 °C. The temperature stability may be increased by using a higher Tg hard block, such as poly(tert-butyl styrene) (Tg ∼ 130 °C) or poly(α-methyl styrene) (Tg ∼ 173 °C).13,14 Unfortunately, these polymers show a reduced propensity to phase separate (lower χ). Hence, a much higher degree of polymerization (molar mass) is required to achieve the same mechanical properties, with the knock-on complications for polymer processing.
Aside from improving the materials' properties, concerns over plastic's environmental impact and efforts to reduce reliance on fossil fuels continue to drive research into renewable feedstocks and degradable polymers.1,15–18 In the context of thermoplastic elastomers, Hillmyer and co-workers have pioneered aliphatic polyester TPEs many of which are bio-sourced and degradable.19–25 These polyesters are prepared by the ring-opening polymerization (ROP) of bio-derived cyclic esters which has the advantage of being highly controlled and delivering high molecular weight polymers.17 In terms of soft-block polyesters, there are a range of options, many of which are also bio-derived, and covering Tg values from −60 to −25 °C. For example, the ring-opening polymerization of menthide (derived from mint),26 ε-decalactone (derived from castor oil),21,27,28 6-methyl-ε-caprolactone,29 β-methyl-δ-valerolactone (derived from glucose),19 ε-caprolactone (widely regarded as degradable)20 or γ-methyl-ε-caprolactone are all reported.24 Other bio-derived soft block polymers are known, but not all are degradable, for example by the polymerization of terpenes,30,31 fatty acids32 or lignin.33
One striking problem is the rather narrow range of bio-derived hard block materials: almost all studies apply polylactide, PLA (derived from corn starch). PLA usage is limited by its moderate Tg (∼55 °C), which restricts the TPE upper use temperature, and by its sub-optimal mechanical properties.28,34,35 To improve upon these limitations of PLA, polyesters incorporating rigid backbone moieties and showing high temperature operability and stability are important targets. Since any new hard block materials must be covalently attached to the soft-block, it is desirable to access it using a controlled polymerization method. This means that common condensation routes to make semi-aromatic polyesters are generally unsuited to well-defined block polymer thermoplastic elastomer preparations. Cyclic ester ROP is also undesirable as a route to alternative hard polyester blocks because the required lactone monomers, incorporating rigid/aromatic groups, are usually very difficult to synthesize (multi-step routes resulting in low yields) and show reduced thermodynamic polymerizability (i.e. there is a significant quantity of residual monomer at equilibrium).22,36–40 A promising alternative controlled polyester synthesis is the ring-opening copolymerization (ROCOP) of epoxides and anhydrides.41,42 It allows straightforward access, with high conversion and yield, to a wide variety of rigid and/or semi-aromatic polyesters and delivers materials with significantly higher Tg values than PLA.43–46 For example, the ROCOP of phthalic anhydride (PA) with cyclohexene oxide (CHO) affords a polyester with a Tg from 133–146 °C (depending on molar mass).47–50 Both PA and CHO are existing commercial chemicals already used at scale in the polymer industry and, specifically, their use to make new polymers would obviate costly, time-consuming, and complex commercialization required for completely new monomers. Currently both CHO and PA are manufactured from petroleum but routes to CHO from 1,4-cyclohexadiene, a waste product of plant oil self-metathesis, and to PA from corn stover are reported.51–53
In 2018, we reported a thermoplastic polyurethane prepared from a BAB-triblock polyester, specifically poly(ε-decalactone)-b-poly(cyclohexene-alt-phthalate)-b-poly(ε-decalactone) [PDL–PE–PDL].54 The polyester component was accessed using a recently discovered switchable catalytic process whereby a mixture of PA, CHO and ε-decalactone (DL), was selectively enchained to yield a triblock polyester.55–58 To achieve the required high degree of polymerization, N, and the desired ABA morphology, it was chain-extended by reaction with a di-isocyanate. Only a single composition of the resulting polyester-urethanes (MBPE-26) was an effective thermoplastic elastomer.54 These results suggest that a systematic study of well-defined ABA triblock polyesters, featuring PE hard (A) blocks in combination with PDL soft (B) segments, is warranted as a new method to design thermoplastic elastomers. From a sustainability perspective it is desirable to obviate thermoplastic polyurethanes, both to reduce exposure to toxic isocyanates and to enable reprocessing and recycling of materials.
Experimental section
Materials
ε-Decalactone (DL) (Sigma-Aldrich, 98% purity) was dried over CaH2 and fractionally distilled (three times) before being de-gassed by bubbling N2 and stored in a glovebox. Cyclohexene oxide (CHO) (Acros) was purified according to the method reported by Greiner and co-workers (stirring over NaH both as a drying and deprotonating agent before addition of MeI to methylate any residuals diols and subsequent isolation of pure CHO by fractional distillation).59 Finally, CHO was degassed by freeze–pump–thaw and stored in a glovebox at −30 °C. 1,4-Benzenedimethanol, 1,4-BDM, (Alfa Aesar) was recrystallized (three times) from dry toluene (purified by SPS and stored over 4 Å molecular sieves). Phthalic anhydride (PA) (Sigma Aldrich, anhydrous, 98% purity) was stirred in dry benzene (purified by SPS) for 12 h, note there is visible insoluble impurity. After cannula filtration and removal of the benzene in vacuo, the white powder was recrystallized from anhydrous chloroform (Sigma-Aldrich, amylene stabilisers) and sublimed under vacuum at 80 °C before being stored in a glovebox. Polymerizations were carried out in 40 mL Teflon caped vials charged with a rare earth magnetic stirrer bar. The vials were dried in an oven, at 140 °C, for at least 24 h prior to use. Toluene was obtained from an SPS (<4 ppm H2O) and stored over 4 Å molecular sieves for at least 24 h before use. The catalyst, [LZnMg(C6F5)2] (see ESI† for its structure and synthesis), was prepared according to the literature procedure.60Typical polymerization procedure
In a glovebox, ε-DL (3.6 mL, 20.5 mmol, 1000 equiv.) was added to 1,4-BDM (11.3 mg, 0.082 mmol, 4 equiv.) followed by toluene (8.5 mL) and then [LZn2Mg2(C6F5)2] (20 mg, 0.0205 mmol, 1 equiv.). The vial was sealed and transferred to an oil bath, which was preheated to 80 °C. After 1 hour, the viscous solution was quenched by cooling the vial in an ice-water bath. Once the solution was cool it was transferred to a glovebox where an aliquot was taken for NMR analysis to quantify the DL conversion to PDL (>99%). To the remaining solution, PA (3.04 g, 20.5 mmol, 1000 equiv.) and CHO (3.1 mL, 30.8 mmol, 1500 equiv.) were added. The vial was returned to the hot oil bath (80 °C) and after 36 h, the PA conversion was determined by NMR analysis of an aliquot (>99%). The crude reaction mixture was purified by precipitation into methanol (200 mL). The polymer was separated and dried under vacuum to remove all solvents. The 0.1 mol% residual catalyst was removed by filtering a concentrated solution of the polymer in dichloromethane (minimum volume to dissolve) through a plug of silica. The triblock polymer was isolated as a colourless film (3–4 g).Results
The goal is to prepare and evaluate a series of all polyester ABA degradable thermoplastic elastomers, where the A-block is an under-explored high Tg semi-aromatic polyester and the B-block is a well-known low Tg aliphatic polyester. The preparation of these block polyesters will apply both epoxide/anhydride ROCOP and lactone ROP.41,42,61 To avoid unnecessary processing, intermediate isolation, purification and use of macro-initiators a one-pot procedure applying a single catalyst would be desirable.58,62–64 In terms of catalyst selection, many catalysts are known for either lactone ROP or epoxide/anhydride ROCOP, there are fewer active for both processes.57,65–68 A further complication is that many ROCOP catalysts deliver polyesters showing bimodal, or multi-modal, molar mass distributions arising from chains initiated from the catalyst, co-catalyst and residual protic compounds (see Fig. S1† for ROCOP reaction steps).69–72 In these ROCOP reactions, residual water reacts with epoxides to form 1,2-diols (which may also contaminate epoxides); these diols are efficient telechelic chain transfer agents and form hydroxyl telechelic polymers showing a higher molecular mass than chains which are initiated from the catalyst (Mn(diol-initiated) = 2Mn(catalyst-initiated)).72 Unfortunately these common bimodal molar mass distributions prevent ABA block polymer synthesis, since both ABA and AB structures would form. One solution to this problem is to apply a large excess of chain transfer agent (diol) which suppresses, but not completely removes, the concentration of catalyst initiated chains.70 At sufficiently high diol or water loading, this approach can be used to deliver monomodal molar mass distributions.57,65,66 The obvious limitation is that N is severely reduced likely preventing phase separation in the resulting block polymers. Our group previously reported a different solution to bimodal molar mass distributions by applying catalysts featuring an organometallic with reactive initiating groups.56,71,73 For example, di-zinc catalysts featuring phenyl co-ligands do not initiate polymerization but can react efficiently with diols to deliver zinc-alkoxide species in situ and, using these catalyst systems, produce only hydroxyl-telechelic alternating polymers.73 The advantages of using such organometallic catalysts are: (1) all the chains have the same end-group (hydroxyl telechelic chains); and (2) the overall degree of polymerization, N, is optimized since only a small excess of diol vs. catalyst is required and polymerizations are living. The di-zinc catalysts are effective but slow catalysts; in the target systems they are not applicable since unacceptably long times would be needed to reach high molar mass triblock polyesters.63 Recently, heterodinuclear zinc/magnesium catalysts have shown much faster rates than dizinc counterparts.74 Very recently, a Zn/Mg catalyst, featuring pentafluorophenyl co-ligands, was prepared and demonstrated high activity in ε-decalactone ROP and in cyclohexene oxide/CO2 ROCOP.60 Here we investigate the use of this catalyst for the target CHO/PA ROCOP and DL ROP to produce ABA triblock polyesters.Triblock polyester (TBPE) synthesis
The ABA triblock polyesters (TBPEs) were synthesised using a one-pot, sequential monomer addition method. Both the DL ring-opening polymerization (ROP) and the ring-opening copolymerization (ROCOP) of CHO/PA were catalysed by the heterodinuclear catalyst [LZnMg(C6F5)2] with 1,4-benzenedimethanol (BDM) (Scheme 1A). Using this catalyst system, at an initial DL concentration of 1.7 M in toluene at 80 °C, the DL ROP proceeds fast, with a turn-over-frequency (TOF) of 952 ± 35 h−1. Once the DL was consumed, a mixture of PA and CHO was added and triggers a ‘mechanistic’ switch from ROP to ROCOP (Scheme 1B). The PA/CHO ROCOP occurs with a TOF of 25 ± 2 h−1, and fully converts ∼1000 equivalents of each monomer. This catalyst performance is at the upper end in ROCOP, particularly given that most catalysts operate effectively only when exposed to <200 equivalents of anhydride.10,41,42,75–77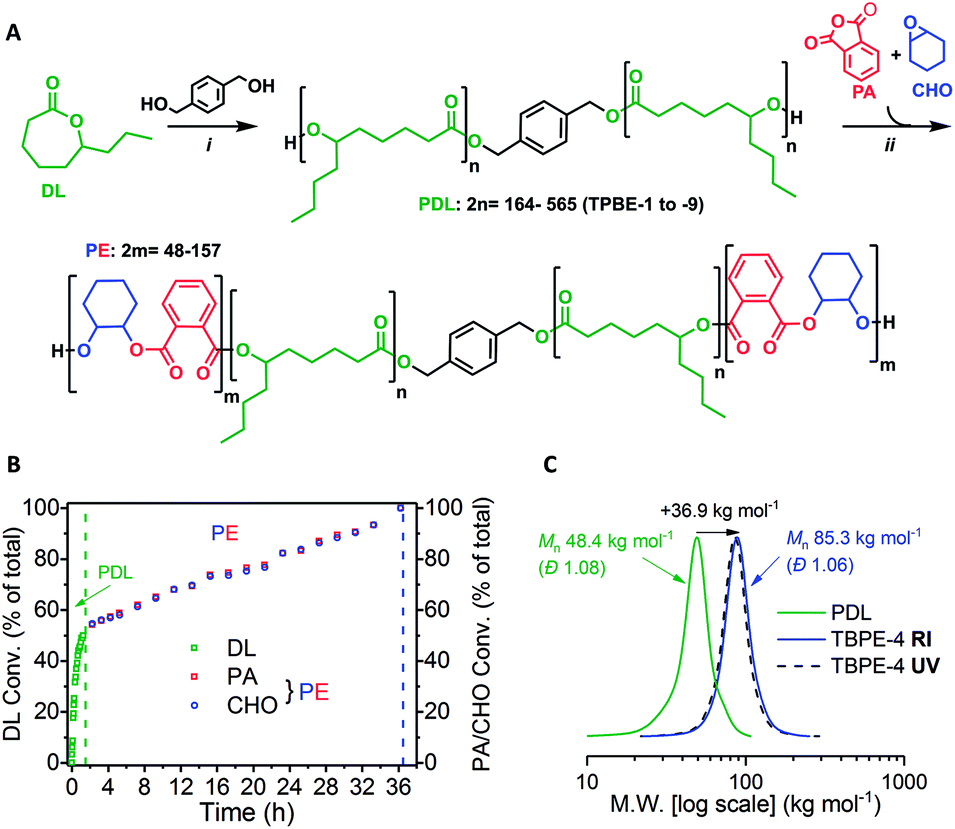 | ||
Scheme 1 Synthesis of ABA-type triblock polyesters (TBPEs). (A) (i) ROP [DL]0 = 1.7 M in toluene, 80 °C, catalyst = [LZnMg(C6F5)2] (see ESI† for chemical structure); (ii) ROCOP, 80 °C, excess CHO (1.5 equiv. relative to PA). (B) Conversion vs. time data for TBPE-4 (Table S1†) showing DL, PA or CHO conversion as a percentage of the total monomer conversion where [LZnMg(C6F5)2]0![[thin space (1/6-em)]](https://www.rsc.org/images/entities/char_2009.gif) :[BDM]0:[PA]0:[CHO]0 = 1:4:1000:700:1050 (Table S1†). (C) SEC traces for TBPE-4 (THF eluent) vs. narrow PS standards showing PDL (99% DL conv.) and purified polymer (99% PA conv.) after PE growth with RI and UV detectors. :[BDM]0:[PA]0:[CHO]0 = 1:4:1000:700:1050 (Table S1†). (C) SEC traces for TBPE-4 (THF eluent) vs. narrow PS standards showing PDL (99% DL conv.) and purified polymer (99% PA conv.) after PE growth with RI and UV detectors. | ||
To assess the polymerization kinetics, a reaction was conducted with regular removal of aliquots which were analyzed by 1H NMR spectroscopy to determine conversion with time. Analysis of the overall triblock polyester conversion vs. time data, reveals an exponential growth of PDL and a linear increase in alternating polyester, since the latter process is assessed by anhydride conversion which is zeroth order (Scheme 1B).58,78 The data confirm that both reactions reach complete conversion and the overall block composition is consistent with the starting monomer stoichiometry. The polymerization kinetics are fully consistent with block polymer formation and a series of characterization experiments were used to confirm this structural assignment.
The 1H NMR spectrum of the triblock polymer (TBPE) samples all show a 2:1 integration ratio of PA aromatic environments to the CHO methine groups, consistent with fully alternating PA and CHO repeat units (Fig. S2 and S3†). Further, the catalysis is highly selective for polyester formation as there are no detectable ether linkages by 1H NMR spectroscopy. The NMR spectra do not show signals attributable to block junction units and this is likely due to the samples' high molar masses.58 Analysis of the carbonyl region, in the 13C{1H} NMR spectra, shows signals for both PDL and poly(CHO-alt-PA), (PE) blocks, at 173.4 and 166.8 ppm, respectively (Fig. S4†). The appearance of two carbonyl signals is consistent with block polymer formation; previously it was noted that when transesterification reactions occur many cross-peaks are observed at intermediate chemical shifts.58
The selective formation of block copolymers is also supported by size exclusion chromatography (SEC) which shows an increase in polymer molar mass (Mn) after ROCOP whilst retaining a narrow dispersity (Đ < 1.1), i.e. there was no evidence of residual PDL (Scheme 1C). The SEC instrument is equipped with RI and UV detectors which both show the same elution time for the polymer sample. This is important since only the ROCOP block is UV-active, thus the fact that the polymers elute with the same retention time signifies that all of the alternating polyester (PE) block grows onto the PDL central block. Some of the SEC traces for the other TBPE samples show a low molar mass tail (Fig. S5–S12†). This could be due to the presence of trace water impurities acting as additional initiators/chain-transfer agents during the ROP step. However, it was not possible to carry out MALDI-ToF mass spectrometry of the samples to determine end-groups owing to the high Mn. There is also excellent agreement between the theoretical Mn (based on the initial monomer-to-initiator ratio and NMR conversion data) and experimental values determined either by SEC or NMR integration methods (Table S1†). Other contributing factors might include inefficient macro-initiation from the cyclohexylene end-group, formed during the ROCOP stage, which is exacerbated by the high viscosity of the PDL solution. Indeed, it has been observed previously that cyclohexylene alkoxide groups suffer relatively slow initiation vs. propagation in lactone ring-opening polymerizations.79 The block structure is further corroborated by DOSY NMR spectroscopy which shows a single diffusion coefficient for the TBPEs which is consistent with joined blocks of PDL and PE. A blend of the corresponding homopolymers (i.e. PDL + PE) shows two separate diffusion coefficients (Fig. S13†). Chain end-group analysis of the TBPE, using 31P{1H} NMR spectroscopy following reaction of the α,ω-hydroxyl groups with a phosphorous reagent, shows only the cyclohexenol end-group signal (146.4 ppm) (Fig. S14†). Once the TBPE is formed there is no evidence of any of the signals observed for the PDL end-groups (147.1 ppm).58
With the spectroscopic proofs of formation of TBPE in hand, the TBPE samples were purified by precipitation of the toluene solutions of the crude polymers into methanol. The polymers were also filtered through silica plugs (to remove residual catalyst). Another important indicator of the high process selectivity was that the composition of the triblock polymers (TBPE) remained identical before and after purification (i.e. there was no removal of any homopolymers or by-products) (Fig. S15†).
To systematically investigate the TPE properties, two series of samples were synthesized with different compositions and molar masses (Table 1). In all the syntheses, monomer conversions were high (90–99% for DL and 85–99% for PA as summarised in Table S1†) and reactions were highly selective for triblock polyester formation. For all samples, the relative wt% of hard (PE) block was determined from the relative ROCOP:ROP integrals in the 1H NMR spectrum. The PE wt% was converted to a volume fraction, fhard, using the previously determined density of PE (1.04 g cm−3).54
| Sample | M n,NMR (kg mol−1) | M n,SEC (kg mol−1) [Đ] | f hard | DPPE–DPPDL–DPPEe | N tot | T g1, Tg2g (°C) | OTWi (°C) |
|---|---|---|---|---|---|---|---|
| a Reaction conditions: = 1.7 M in toluene, catalyst = [LZnMg(C6F5)2] (see ESI for structure), chain transfer agent = 1,4-BDM, T = 80 °C, see Table S1 for more reaction data. b Estimated from the 1H NMR spectra of the purified polymer by integration of the aromatic 1,4-BDM resonance (7.34 ppm) against those of PE (7.58 ppm) and PDL (4.85 ppm). c Estimated by SEC with THF eluent, RI and UV detector, calibrated using PS standards. d Volume fraction of hard block determined from the wt% hard block using eqn (S1) and previously reported room temperature densities for PE = 1.04 g cm−3 and PDL = 0.97 g cm−3.21,54 The wt% hard was calculated from the 1H NMR spectra of the purified polymers by comparison of the relative integrals (±3% error) of an aromatic resonance in PE (7.58 ppm) and the –CH resonance in PDL (4.85 ppm). e Degree of polymerization for PE–PDL–PE blocks calculated from Mn,SEC of the overall triblock, the wt% hard block from 1H NMR spectroscopy and the mass of repeat unit for PE (246.3 g mol−1) and PDL (170.3 g mol−1). f Total degree of polymerization (eqn (S2)) calculated from the sum of Mn of the component blocks and using a reference segment volume of 0.118 nm3. g Estimated by DSC (10 °C min−1 heating rate), second heating curve. h Determined from the maximum in the peak of tan(δ) by DMTA (1 Hz, 5 °C min−1 heating rate). i Operating temperature window (OTW) calculated as the difference between upper and lower Tg values. | |||||||
| TBPE-1 | 8–27–8 | 45.0 [1.05] | 0.40 | 35–164–35 | 653 | −49, 105 | 173 |
| TBPE-2 | 13–34–13 | 61.3 [1.10] | 0.44 | 52–209–52 | 890 | −50, 122 | 192 |
| TBPE-3 | 14–45–14 | 75.0 [1.07] | 0.41 | 59–269–59 | 1088 | −50, 123 | 193 |
| TBPE-4 | 17–46–17 | 85.3 [1.06] | 0.44 | 73–291–73 | 1238 | −50, 126 | 195 |
| TBPE-5 | 20–65–20 | 102 [1.09] | 0.40 | 79–371–79 | 1480 | −51, 138 | 206 |
| TBPE-6 | 13–69–13 | 106 [1.06] | 0.29 | 58–455–58 | 1538 | −42, 146h | 188 |
| TBPE-7 | 10–68–10 | 89.8 [1.05] | 0.24 | 42–406–42 | 1303 | −41, 136h | 177 |
| TBPE-8 | 10–93–10 | 105 [1.07] | 0.19 | 38–506–38 | 1524 | −44, 132h | 176 |
| TBPE-9 | 5–91–5 | 108 [1.08] | 0.12 | 24–565–24 | 1567 | −44, 123h | 167 |
For samples TBPE-1 to TBPE-5, the polymers all have similar compositions, with fhard ∼ 0.40–0.44, but show different molar masses, with Mn increasing from 45 to 102 kg mol−1 (Fig. S16†). For samples TBPE-5 to TBPE-9, all polymers have approximately the same Mn (∼100 kg mol−1) but show decreasing volume fractions of hard block over the range fhard ∼ 0.4–0.12. Materials with a higher hard domain content (fhard > 0.4) are not considered because thermoplastic elastomers generally require Hard block domains within a majority soft-block matrix.5 For example, commercial SIS/SBS TPEs typically have a polystyrene content fhard = 0.2–0.4.80,81
Highly transparent and completely colourless free-standing films of the triblock polymers were prepared by solvent casting from dichloromethane solutions of the polymer (Fig. S17†). These films were of good quality (no air bubbles) and reproducible thicknesses (typically 100–200 μm depending upon the amount of polymer used). For comparison, commercial Kraton™ SBCs are similarly solvent processed for mechanical datasheets. Films were allowed to dry overnight in a well-ventilated fume-hood, before being dried in a vacuum oven at 60 °C, for at least 72 h prior to testing, to ensure complete removal of residual solvent. The absence of processing solvent was established by NMR spectroscopy and thermal gravimetric analysis (TGA).
Phase separation
The delivery of TPE properties depends upon successful phase separation of the hard and soft domains. For TBPE-1 to -5, with fhard ∼ 0.4, block immiscibility is indicated by the two glass transitions in the DSC analysis. The DSC data show that these two Tg values are close to the values expected for the constituent hard (PE) and soft (PDL) blocks (Table 1, Fig. S18 and S19†). For samples TBPE-1 to -5, the Tg of the hard blocks (PE) increases from 105 to 138 °C which is expected as the molar mass of the alternating polyester also increases across the series (Mn,PE = 8–20 kg mol−1) (Fig. S20† shows the linear dependence of Tg on 1/Mn,PE). The values are also consistent with previously reported Tg values for PE which were in the range 130–146 °C (Mn = 10–20 kg mol−1).48–50 For TBPE-1 to -5, the Tg,PE values increase to the expected values for entangled chains implying better phase separation with increasing N, a finding which is fully consistent with other phase-separated block polymers.11 Likewise, for the soft PDL block, the Tg decreases from −49 to −51 °C from TBPE-1 to TBPE-5 as the Mn increases from 27 to 65 kg mol−1. (Table S2† illustrates the expected Tg values based on the molar masses using the previously reported Fox–Flory parameters for PDL and those estimated here for PE).21For TBPE-6 to -9, there is a significant reduction in the volume fractions of hard PE block (fhard < 0.4) and the resulting upper glass transitions in the DSC are all weak and broad. Therefore, the upper Tg values were confirmed using DMTA, as the peak maxima in tan(δ) (Fig. 1A and S21–S28†). The PE Tg values progressively decrease from 146 °C for TBPE-6 to 123 °C for TBPE-9 and are consistent with the decreasing degree of polymerization (Table 1 and Fig. S29†). As a result the operating temperature range for all these materials is impressively wide, for example TBPE-5 spans an operating temperature range of 206 °C (from −42 to 146 °C).
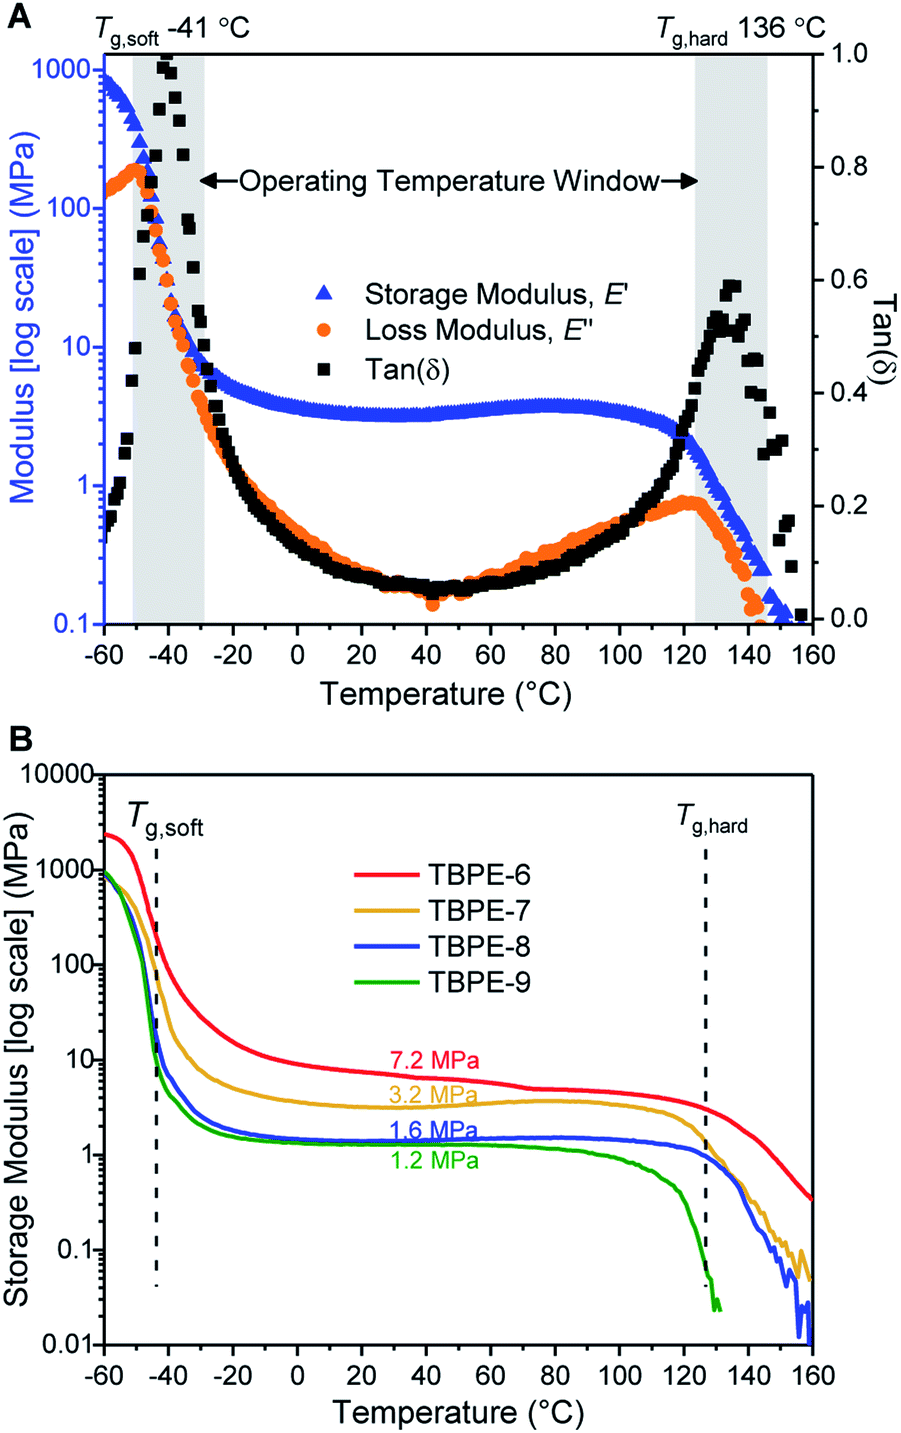 | ||
| Fig. 1 DMTA of TBPE samples (heated from −60 to 160 °C, at 5 °C min−1, 1 Hz frequency, 1% amplitude strain). (A) DMTA of TBPE-7 showing two glass transitions and a theoretical operating temperature window from −41 to +136 °C; (B) storage moduli for TBPE-6 to -9 showing increasing plateau moduli with hard domain content (fhard 0.12 to 0.29). | ||
It is important to emphasise that the upper operating temperature for all block polyesters is considerably higher than alternative TPEs. For example, block polyesters incorporating PLA blocks are limited by an upper temperature of ∼55–60 °C. Styrenic block polymers show upper temperature limits at ∼100 °C.82 These new triblock polyesters also show higher temperature stability than the previously reported multi-block polyester-urethane (Tupper ∼ 97 °C).54 There is certainly a trade-off between improving the upper service temperature and retaining ease of processability. For TBPE-6 to -9, processing is expected to be feasible above the upper Tg values, whereas for TBPE-1 to -5 processing is feasible above the order-to-disorder transition temperature (TODT = 158–193 °C) (vide infra).
Over the useable temperature range, the TBPE elastic modulus (E′) shows a plateau and dominates over the viscous response (E′ > E′′, tan(δ) tends towards zero); these results correlate with elastomeric behaviour. The plateau modulus is inversely related to the PDL (soft-block) entanglement molar mass (Me) and this latter term is an important determinant of elastomeric properties. For TBPE-6 to -9, increasing the hard-block content (PE) results in a higher plateau modulus and decreased Me from 9.1 to 2.9 kg mol−1 (Fig. 1B and Table 2). The Me values were determined using the Guth–Smallwood equation, which assumes spherical hard domains. The equation makes use of the relation between storage modulus (E′) and shear modulus (G′): E′ = 2G′(1 + ν), where the Poisson ratio (ν) is generally assumed to be 0.5 for an elastomer. The soft PDL block Me is in accordance with values reported for other PLA–PDL–PLA polymers (Me = 3.9–7.2 kg mol−1, Table S3†) and with the value determined for PDL homopolymer (Me = 5.9 kg mol−1).21,28
| Sample | ε b (%) | σ b (MPa) | E y (MPa) | G′e (MPa) | M e (kg mol−1) |
|---|---|---|---|---|---|
| a Samples were tested at 10 mm min−1 extension rate, GL = 10 mm, width measured as an average of 3; error represents standard deviation of 10 specimens. b Elongation at break. c Tensile strength. d Young's modulus measured within 0.025–0.25% strain using an external camera. e Shear storage modulus at 25 °C calculated from the plateau storage modulus (E′), as illustrated in Fig. 1B and applying E′ = 2G′(1 + ν) where Poisson's ratio, ν = 0.5 which is typical of elastomers.83 f Calculated using the Guth–Smallwood equation at 25 °C: Me = ρRT(1 + 2.5fhard + 14.1fhard2)/G′ using ρPDL = 0.974 g cm−3.21 | |||||
| TBPE-6 | 1097 ± 37 | 6.5 ± 0.2 | 5.0 ± 0.7 | 2.4 | 2.9 |
| TBPE-7 | 1437 ± 30 | 5.6 ± 0.3 | 3.6 ± 0.5 | 1.1 | 5.5 |
| TBPE-8 | 1593 ± 41 | 4.0 ± 0.2 | 2.4 ± 0.4 | 0.5 | 9.0 |
| TBPE-9 | 1883 ± 20 | 2.0 ± 0.2 | 1.4 ± 0.3 | 0.4 | 9.1 |
Tensile mechanical properties
The TBPE stress–strain behaviour was determined by uniaxial tensile testing, at an extension rate of 10 mm min−1. Dumbbell-shaped specimens were cut from the polymer films, according to ISO 527-2, specimen type 5B using a cutting press. For each TBPE sample, 10 different specimens were tested and results are reported as the mean value with standard deviations representing the errors. The tensile mechanical data for TBPE-1 to -4 (fhard ∼ 0.4) show clear yield points, indicating plastic deformation, at low elongations (∼4–8%) followed by cold drawing and strain hardening behaviour (Fig. S30–S34†). For TBPE-5, which has the highest molar mass and soft-segment degree of polymerization, the stress–strain relationship is more linear with a diffuse yield point at 12.1 ± 3.8% strain (Fig. S35†). All the TBPE samples showed good agreement between the Young's modulus, Ey (measured by tensile testing in the elastic region) and the storage modulus (E′) (measured by DMTA at low strains) (Table S4†). For example, TBPE-2 showed the highest values for Ey (226 ± 8 MPa, E′ = 283 MPa) and ultimate tensile strength (σu = 29.1 ± 4.4 MPa). These values are comparable to those reported for SIS of similar composition (SIS Mn = 56 kg mol−1, fPS 0.40, shows σu = 31 MPa) and are in line with the recently reported multi-block polyester-urethane (E′ = 205.5 MPa).54,81 Generally this series of TBPE samples show ultimate tensile strengths from 13 to 29 MPa and are competitive with those for SBC (fPS ∼ 0.4) which are all in the range 19–31 MPa.82 However, these TBPEs show significantly greater values for elongation at break (1100–1400%) compared to SBC (500–800%).TBPEs-6 to -9 all have similar overall N but feature progressively lower hard domain contents. These samples all show true elastomeric behaviour namely, linear stress–strain relationships, without any obvious yield point, and low Young's moduli in the range of 1–5 MPa (Table 2, Fig. 2A and S36†). Progressing from TBPE-6 to 9 (0.29 > fhard > 0.12), results in a decrease in Ey and a reduction in stiffness. As expected, the stiffest materials sustain higher stresses but fail at lower strains, in accordance with elastic behaviour being dominated by soft chain entanglements and the hard domains acting as rigid fillers.28
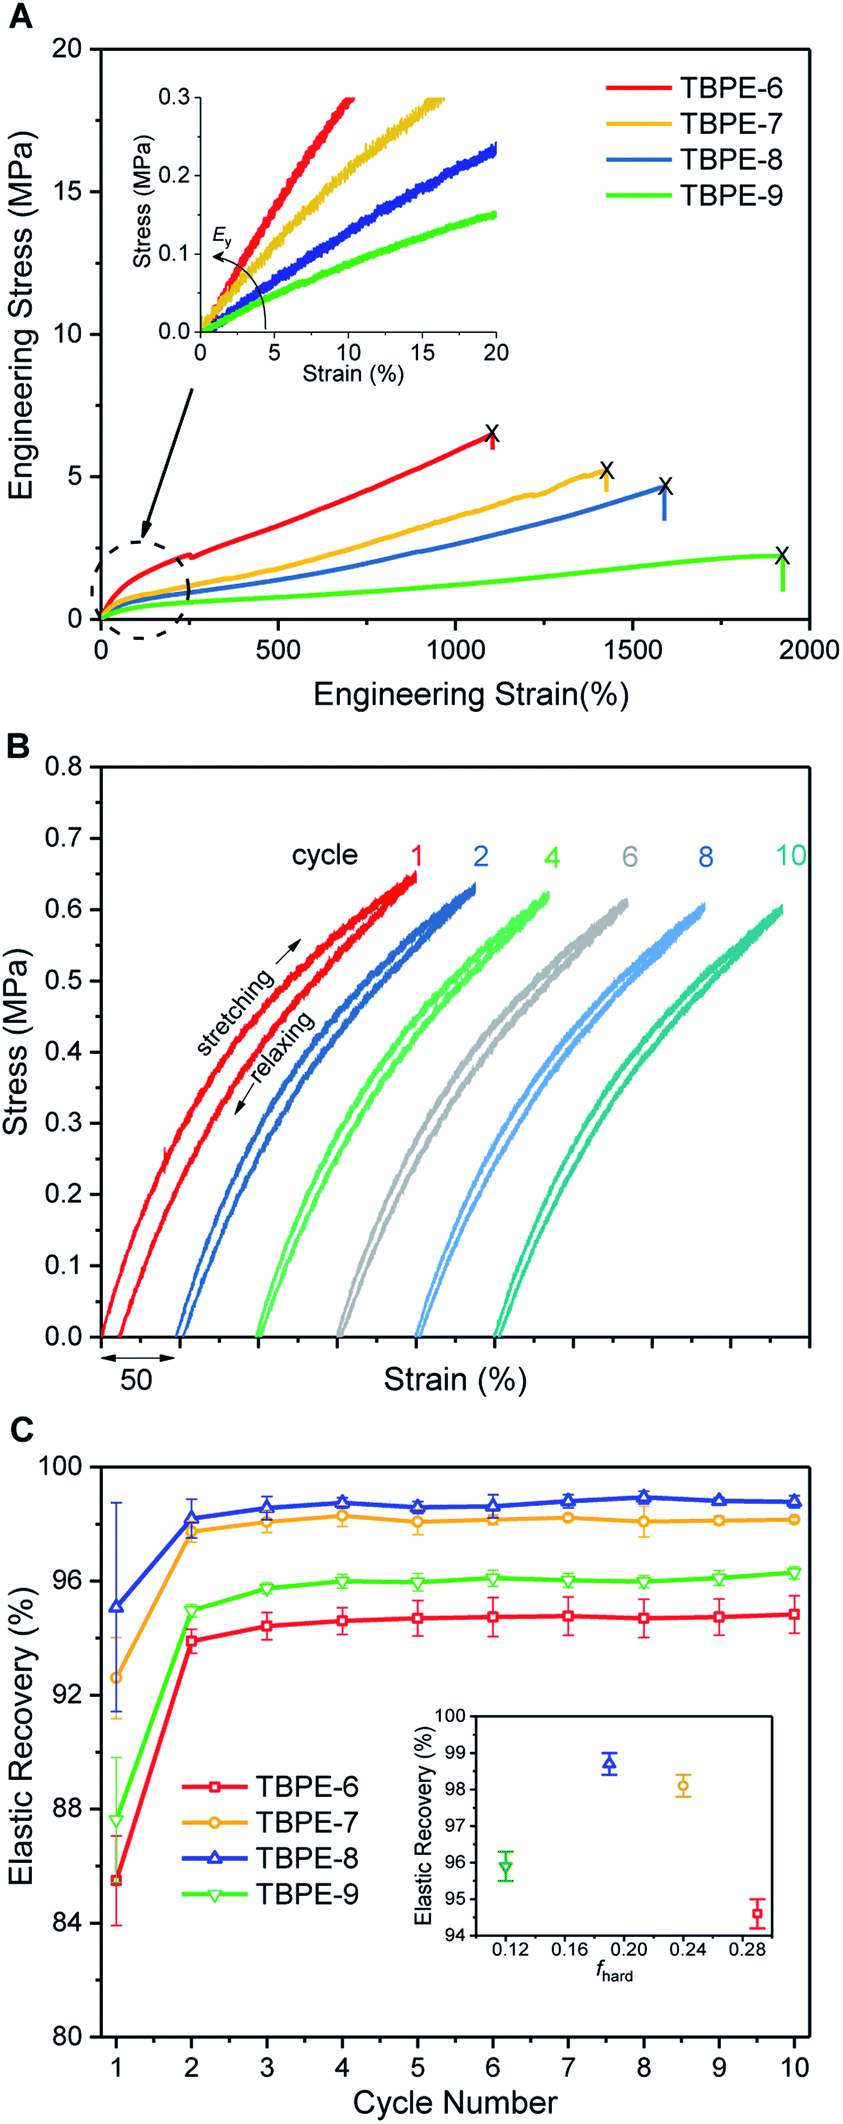 | ||
| Fig. 2 Mechanical behaviour for TBPE-6 to -9. (A) Stress–strain curves (10 mm min−1 extension rate) showing increasing Ey and σb with hard block content; (B) cyclic tensile testing (200% strain) for TBPE-7 exhibiting narrow hysteresis and (C) elastic recovery as a function of cycle number for TBPE-6 to -9; (inset) mean elastic recovery as a function of fhard. | ||
The ultimate tensile strength values decrease with the hard block content. The tensile strength depends upon both the stress that can be accommodated by each rigid domain as well as the stress shared by chain slippage of physical entanglements in the soft-block.84 The progressive reduction in ultimate tensile strength is a consequence of both decreasing the hard domain content and a larger PDL Me correlating to fewer entanglements (Table 2 and Fig. S37†). The enhanced extensibility on decreasing the hard domain content suggests that, in these materials, fewer crosslinking entanglements aid polymer elongation.85
Elastic recovery, the ability to recover the original shape after extension, is a key parameter when assessing TPE properties. TBPE-6 to -9 were each subjected to 10 hysteresis cycles where each sample was stretched to 200% strain and relaxed (at a rate of 10 mm min−1). The elastic recovery, resilience (ability of a material to recover energy during cyclic deformation) and residual strain were determined (Fig. 2B, S38 and Table S5†). In these tests, the first elastic cycle typically differs from subsequent cycles, indicating initial energy loss owing to stress induced PDL chain disentanglement.86 All the samples demonstrated high elastic recovery (>95%), high resilience (>80%) and low residual strain (<10%) (Fig. S39–S43†). TBPE-7 and -8 (fhard 0.19 and 0.24) showed optimal elastomeric properties, that is excellent elastic recovery (>98%, Fig. 2C) with minimal residual strain (3.8 ± 0.6 and 2.7 ± 0.7%, respectively) and high resilience (>90%). At lower hard block content (TBPE-9), elastic recovery is slightly diminished (∼96%) presumably because the shorter PE domains are less effective crosslinks for entropic PDL elastic recoil. At higher fhard (TBPE-5 or -6), the elastic recovery and resilience are also reduced, perhaps owing to the more highly entangled PDL matrix reducing chain mobility. Chain entanglements and interchain friction, which could be reduced by plasticization or mechanical deformation during processing, increase the energy loss during stretching and recovery.87 To illustrate its excellent elastic recovery, TBPE-8 was also subjected to cyclic tensile testing to 1000% strain and showed high elastic recovery and low residual strain (Fig. S44†).
Phase separated morphologies
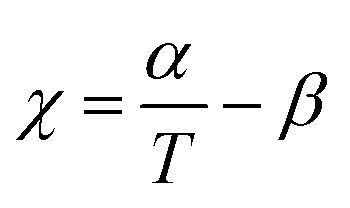
The thermodynamic equilibrium phase of segregated block polymers is determined by the product χN and the composition fhard.2 Equilibrium morphologies typically observed for linear ABA triblocks include body-centred cubic, closed-packed spherical (S), bicontinuous cubic gyroid (G), hexagonal-packed cylinders (C) and lamellar (L). The Flory–Huggins interaction parameter is typically assumed to vary inversely with temperature according to:(where α and β are empirical parameters).2 As χN increases, there is a transition from a disordered state to an ordered morphology. For linear ABA triblocks with fhard = 0.5, phase separation is predicted to occur at χN > 17.996.88 TBPE-1 to -5 are all compositionally similar (fhard ∼ 0.4–0.44) and, in all samples, DMTA analysis shows a steep drop in storage modulus after the upper Tg (Fig. 3). This behaviour is characteristic of an order-to-disorder transition (ODT) and is important when considering high-temperature processing.89 Above the order-to-disorder transition temperature (TODT), the value of which scales with the overall molar mass, the material becomes viscous and is expected to be melt processable (Fig. S45†).
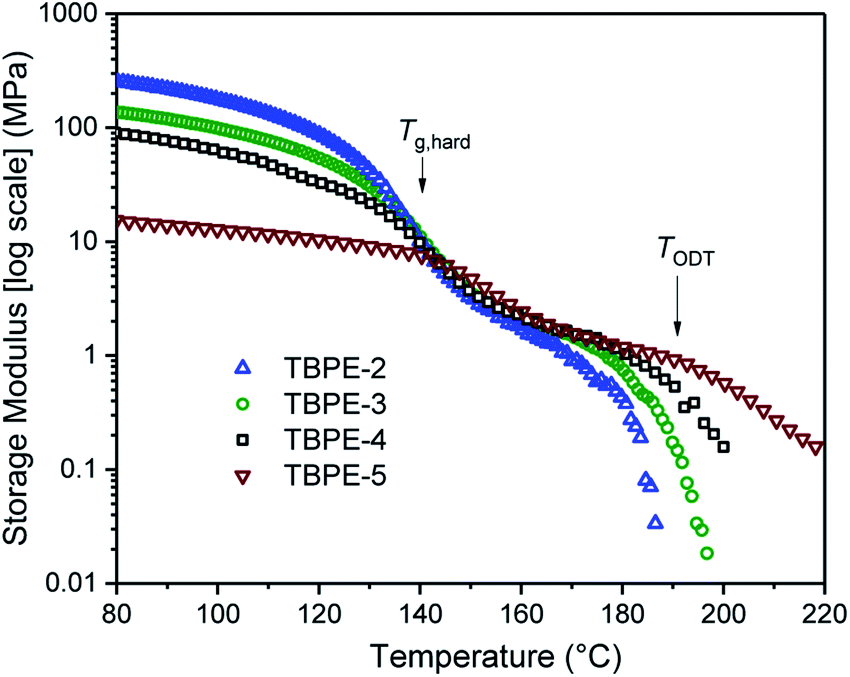 | ||
| Fig. 3 Storage modulus as a function of temperature, for TBPE-2 to -5. The order-to-disorder transition (TODT) is determined as the on-set of the second decrease in the storage modulus, following the upper Tg. (See Fig. S45† for the individual plots and determination of the TODT values). | ||
By assuming that the materials' behaviour conforms to the theoretical phase diagram for a linear ABA polymer, as described by Matsen, the temperature dependence of the Flory–Huggins parameter for PDL–PE, χPDL–PE, can be estimated.90 A plot of 1/TODTversus χ, calculated using the mean field segregation strength, (χN)ODT at fhard = 0.4 and N determined as in Table 1 (Fig. S46†) gives:
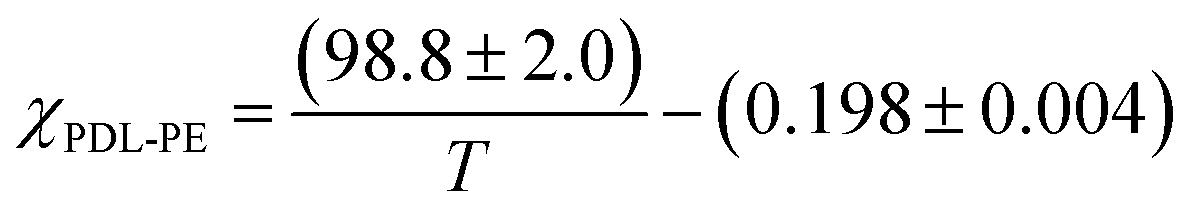
Robertson and co-workers discussed various sources of error implicit in this calculation which include: the determination of (χN)ODT from the theoretical phase diagram; the assumption that all polymers are monodisperse and show values for density and statistical segment lengths that are temperature independent. Further, at fhard = 0.4 the predicted order-to-order phase transitions with increasing temperature (from lamellar to double gyroid, to cylindrical, and finally to spherical phase separated structures) have also been ignored.89,91 Nonetheless, the calculation is useful for understanding the propensity for microphase separation. The Flory Huggins interaction parameter is determined as χPE–PDL ∼ 0.035, at a temperature of 150 °C. The value is comparable to that reported for PLA–PCL {poly(lactide)-b-poly(caprolactone)} or PS-PI, but weaker than for PLA–PDL (see ESI Table S6† for specific values and references).11 The weak segregation strength is fully consistent with the high N (total degree of polymerization) required to observe phase segregation and the broad upper glass transitions typical of wider interfacial separations.
The TGA data for these samples show on-set thermal degradation temperatures for the PE (10.2 kg mol−1) and PDL (60 kg mol−1) blocks at surprisingly similar temperatures. For example, PE loses ∼5% of its mass (T5%,d) at ∼294 °C and PDL at ∼313 °C. Consequently, the TGA data for the TBPEs did not exhibit a clear two step degradation profile, as observed for other block polymers.92 The first derivative of the data does reveal the two-step degradation and is fully consistent with the block architecture (Fig. S47†). In all cases, the approximate mass loss for each step correlates well with the polymer compositions and suggests that the outer PE blocks degrade first (Table S7†). As might be expected, the overall polymer molar mass is important in determining the onset of degradation. For example, samples TBPE-5 to -9 show higher on-set decomposition temperatures (T10%,d = 315 °C; Tinf,1 = 331 °C) than lower molar mass samples TBPE-1 to -4 (T10%,d = 309 °C; Tinf,1 = 318 °C) (Fig. S48†).
Small angle X-ray scattering (SAXS)
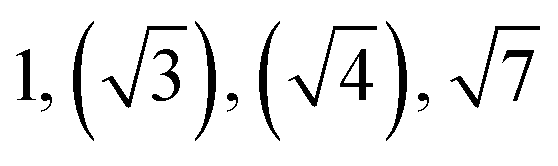
The triblock polymers' phase separated structures are expected to govern the mechanical properties. Small angle X-ray scattering (SAXS) measurements are frequently used to identify phase structures, specifically by examining the Bragg reflections.93 The series of samples were analyzed by SAXS prior to annealing, TBPE-1 to TBPE-5 (fhard ∼ 0.4–0.44) show increasing domain sizes (d = 19–27 nm) with increasing N. The domain size is calculated from the position of the principal scattering peak, q* (as d = 2π/q*). A double logarithm plot of d versus N is linear, with gradient of ∼0.5, implying a weakly segregated system (Fig. S49†).94 In all SAXS experiments, except low N TBPE-1 (which only showed q*, Fig. S50†), both a principal scattering peak and some evidence of second order peaks are observed (Table 3). The lack of long-range translational order is typical of triblock polymers and commonly observed when χ is low.11 When TBPE-2 was heated (at a rate of 10 °C min−1) to a temperature of 175 °C, the SAXS data show an increased number of higher order peaks at q*, 2q*, 3q* and 4q* that are consistent with the formation of a lamellar phase (Fig. 4 and S51†). The lattice parameter, calculated from the principal scattering peak, is 29 nm. Annealed samples of TBPE-3 and -4 (heated to 200 °C at 10 °C min−1 before cooling to room temperature), which have higher N, show analogous SAXS patterns comprising a broad principal scattering peak (d = 24.1 or 24.9 nm, respectively) and a weak second order peak (Fig. S52†). TBPE-5 exhibits a sharper principal scattering peak corresponding to a larger domain spacing of 34 nm, but there is little evidence of longer range order. There is a weak peak at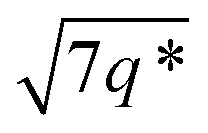 and, taken together these data are tentatively used to assign a nanostructure featuring loosely packed cylinders. Such a morphology would be consistent with the mechanical data which show a diffuse yield point. The lack of long-range order for polymers having higher N could be due to limited chain mobility resulting from a greater number of chain entanglements or to slow chain diffusion and phase separation kinetics with longer chain lengths.5
| Sample | d /nm | Observedbq*/q | Morphologyc | Expectedd |
|---|---|---|---|---|
| a Domain spacing, d calculated from the principal scattering peak, q*: d = 2π/q*. b Observed Bragg reflections, missing peaks in ( ). c Proposed phase morphology based on SAXS data. d Expected phase state based on theoretical phase diagram from Matsen for linear ABA-triblock copolymers and literature SBCs of similar N and composition. LAM = lamellar, HEX = hexagonally packed cylinders, S = closed-packed spheres and DG = double gyroid.90,95–97 | ||||
| TBPE-1 | 21.5 | 1 | n.d | S/HEX |
| TBPE-2 | 29.0 | 1, 2, 3, 4 | LAM | LAM/DG |
| TBPE-3 | 24.1 | 1, 2 | LAM (weakly ordered) | LAM |
| TBPE-4 | 24.9 | 1,2 | LAM (weakly ordered) | LAM |
| TBPE-5 | 34.0 |
|
HEX (weakly ordered) | LAM |
| TBPE-6 | 23.0 |

|
HEX | HEX |
| TBPE-7 | 20.0 |
|
HEX | HEX |
| TBPE-8 | 21.5 |

|
HEX | S |
| TBPE-9 | 18.1 |
|
S | S |
 | ||
| Fig. 4 SAXS data for selected TBPEs (see Fig. S52 and S53† for all samples). The SAXS data for TBPE-5, -7 and -9 were collected at 25 °C (but samples were subjected to annealing at 200 °C, i.e. above the upper Tg for 20 min). TBPE-2 was measured at 175 °C. Higher order scattering peaks are labelled relative to the principal scatterings peak (q*). | ||
The SAXS data for TBPE-7 (fhard = 0.24), shows diffraction peaks at q*, 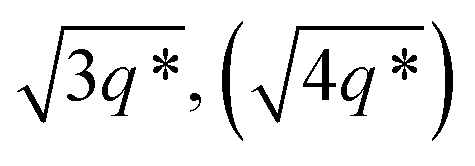 and a much weaker peak at
  This data is assigned as a local morphology of hexagonally packed cylinders
  and the lattice parameter, calculated from the first diffraction maxima (q*), is 20.0 nm (Fig. 4 and S53†). A lower degree of long range order is observed for TBPE-8 and -9 and peaks are significantly broader, which might suggest mixed morphologies. For TBPE-9, diffractions peaks at q* and
  are tentatively assigned to a body-centred cubic arrangement of spheres, as predicted based on the PE content, or a liquid-like disordered packing of spherical micelles (Fig. 4). For TBPE-8 and -9, the calculated lattice parameters are 21.5 and 18.1 nm, respectively.
Degradability
These TPEs are expected to be readily re-processable by heating them above the upper Tg (122–155 °C) or TODT (123–193 °C). This thermal recycling potential is important as natural and synthetic rubbers are thermosets and hence cannot be easily recycled.1 Ultimately all materials reach an ‘end-of-life’ stage after which further recycling is not beneficial and, at this point, the products should be degradable. One option is to develop means to chemically recycle polymers at this stage, via controlled bond scission reactions, back to monomers, monomer precursors or value-added building blocks.98–100 Another option is to enable enzymatic biodegradation of the polymers so as to prevent environmental pollution, although this option is complicated by the range of ‘real’ environments where polymers may end up.101 One clear advantage of these polyester thermoplastic elastomers is their propensity to undergo ester bond glycolysis or hydrolysis reactions. This ability to break the polymer main chain linkages is in contrast to pervasive SBC or hydrocarbon elastomers.To test the polymers' susceptibility to degradation reactions two sets of conditions were explored: (1) model conditions for chemical degradation, specifically by treatment with dilute acids to accelerate ester hydrolysis. (2) Model conditions for aqueous (bio)degradation, specifically by treatment with water or with buffered enzyme solutions.19,23,102,103 TBPE-5 was selected as the test candidate for these studies since it has a composition representative of the first series of polymers (fhard ∼ 0.4) and an equivalent high molar mass common to the second series (Mn ∼ 100 kg mol−1). It is anticipated that degradation rates will depend on both factors.
Firstly conditions for chemical degradation were explored by dissolving TBPE-5 in toluene (2 wt% solution) and treating it with an organic acid (p-TSA, 6 mM). The polyester hydrolysis was regularly monitored by removal of aliquots for SEC analysis. At room temperature degradation proceeded slowly but upon heating to 60 °C, TBPE-5 rapidly degraded showing 60% mass loss over 4 hours (Fig. 5A). A degradation rate coefficient, kd = 0.15 ± 0.01 h−1, was determined as the gradient of a plot of ln(Mn0/Mnt) against time (Fig. S54†).104 The aliquot removed after 4 hours was analyzed by 1H NMR spectroscopy which showed the remaining polymer, although now of substantially lower molar mass, still retained fhard ∼ 0.4. A 31P{1H} NMR spectroscopy titration (using the end-group analysis method described earlier) showed both PDL and PE chain ends (Fig. 5B). Also it was apparent that as the degradation progressed, bimodal molar mass distributions evolved (Fig. 5C). These data are consistent with random chain scission hydrolysis to form oligomers as has been observed for other polyester degradations under similar conditions.105 After 4 h, the oligomers' PE blocks continue to degrade, as identified by changes to the relative integrals of PA and CHO environments and by the appearance of new aromatic environments (Fig. S55 and S56†). After ∼70 h, only oligomers remain (Mn < 10 kg mol−1, Đ > 1.6) and the degradation rate decreases, as apparent from the plateau-like behaviour in Fig. 5A and corresponding reduction in gradient of the linear 1/Mnversus time plot (Fig. S57†). The value of 1/Mn is proportional to the concentration of newly generated chain ends during polymer hydrolysis.106 The relative rates of chain scission may depend on the chemistry of the ester linkages, i.e. PDL or PE ester bonds may not hydrolyse at the same rates. To test this notion, control degradation reactions using separate samples of PDL and PE, under analogous conditions, showed that the rate of PE degradation is approximately half that of PDL. The slower PE degradation likely arises due to the increased ester linkage rigidity compared to PDL (Fig. S58†). It seems likely the diminution in degradation rate after 70 h results from a combination of factors including the decreased water concentration; changes to oligomer solubility caused by the formation of hydrophilic chain end-groups (note the solution becomes cloudy as the degradation progresses) and differences in PDL and PE hydrolysis rates. The reaction was continued for 3 weeks (500 h) and the final aliquot showed a further decrease in molar mass (3.6 kg mol−1, Đ 2.19) which corresponds to ∼97% total molar mass loss. Samples TBPE-6 to -9 showed faster degradation rates, under identical conditions, correlating with a lower volume fraction of PE and accordingly faster PDL hydrolysis rates (Fig. S59†). TBPE-5 degradation was also investigated, under the same conditions but using more polar solvents such as THF, acetone, iso-propyl alcohol (IPA), methanol and water. The solvents were chosen as safer and more environmentally benign alternatives to toluene. Generally, degradation was markedly slower compared to equivalent reactions in toluene and longer periods before the on-set of mass loss were observed in all solvents (Fig. S60†). TBPE-5 dissolved in THF or acetone at 60 °C, shows the on-set of mass loss only after 8 h of reaction. TBPE-5 was suspended in IPA or in MeOH, in both cases there was an induction period prior to mass loss which also correlated with the time taken for the polymer to fully dissolve (24 h for IPA or 48 h for MeOH). Reactions conducted without any acid catalyst (p-TSA), in toluene at 60 °C failed to show any polymer degradation even after several months. This finding suggests that degradation rates are accelerated by acidic chain end formation.
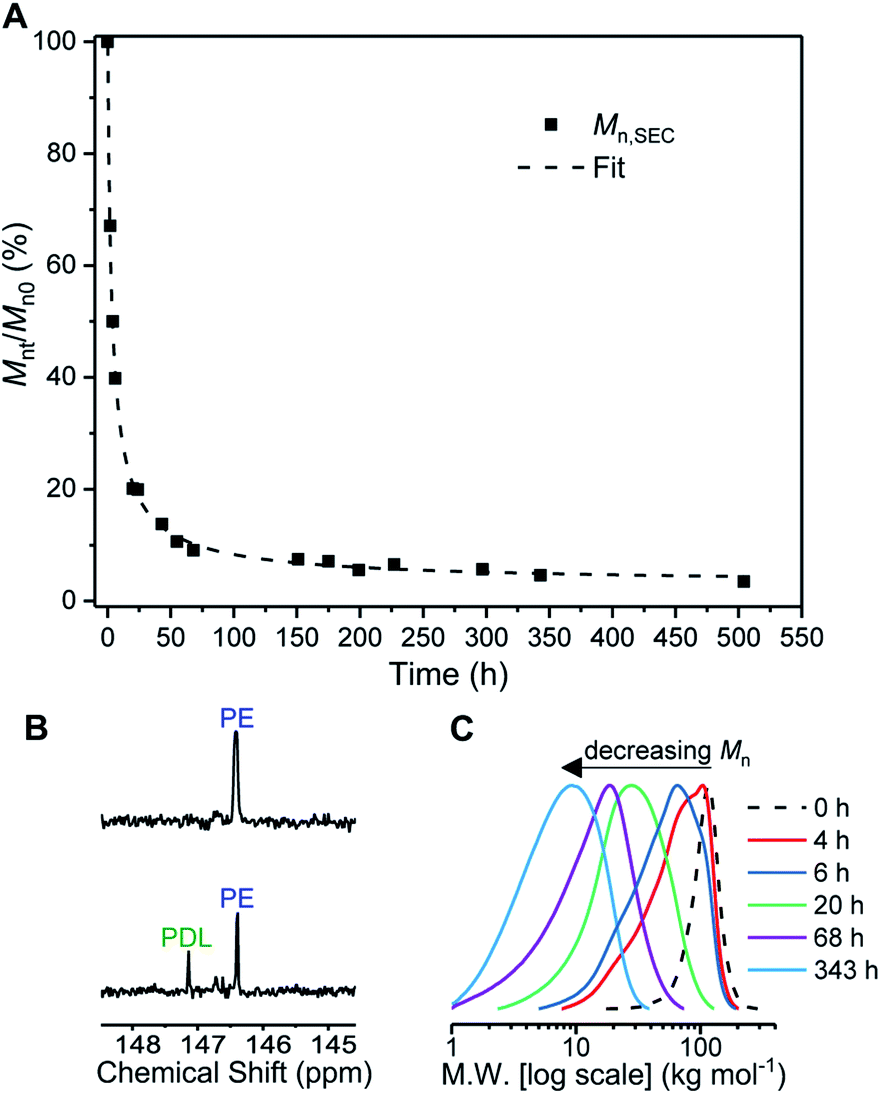 | ||
| Fig. 5 Degradation of TBPE-5. Reaction conditions: 2 wt% polymer in toluene, 6 mM p-TSA·H2O, T = 60 °C. (A) Mnt/Mn0 (%) determined by SEC of aliquots taken at time points (t) and expressed relative to Mn at t = 0 h. (B) End-group analysis showing formation of PDL end chains at t = 4 h. (C) Corresponding SEC traces at selected time points only for clarity (THF eluent, RI detector vs. PS standards). | ||
In the second series of tests, degradation reactions were conducted in aqueous solutions. Dumbbell specimens of TBPE-5 were submerged in distilled water, at 60 °C and treated with 6 mM acid. It should be noted that the polymer did not dissolve over the timescale of the experiment and that the solution pH value remained constant (pH = 3). Under these conditions, the ester hydrolysis rate is expected to depend upon the rate of water ingress into the sample and, therefore, upon the sample surface area and hydrophobicity.107 To assess the TBPE-5 surface hydrophilicity values, a static water contact angle measurement showed a value of 75.5 ± 2.4° (Table S8†). Hydrophobicity increases from TBPE-5 to -9, with a maximum static water contact angle of 98.0 ± 1.7° being observed for TBPE-9 (fhard = 0.12). Under these aqueous degradation conditions and over several months, aliquots removed from the reaction showed little change to molar mass but some broadening of the distribution (Đ). Visually the samples slowly changed appearance from transparent to cloudy films (Fig. S61†). After 4 months, the molar mass had decreased to 68 kg mol−1 (32% mass loss) with concomitant broadening of dispersity (Đ = 1.36) (Fig. S61†). Periodic mechanical testing of the dumbbell specimens, after drying them to constant mass (in a vacuum oven at 80 °C for 24 h), showed that the mechanical properties became compromised at the on-set of observable mass loss. Thus after 4 months, samples showed significantly reduced tensile strength (2 MPa) and elongation at break (700%) (Fig. 6). After 67% mass loss (5 months), the Young's modulus decreased from 20 to 13.5 MPa. These hydrolysis reactions appear to be random chain scission processes since there was no evidence, using ESI mass spectrometry, of small-molecule degradation products such as phthalic acid, cyclohexanediol or the hydroxyacid of decalactone, in the degradation medium.
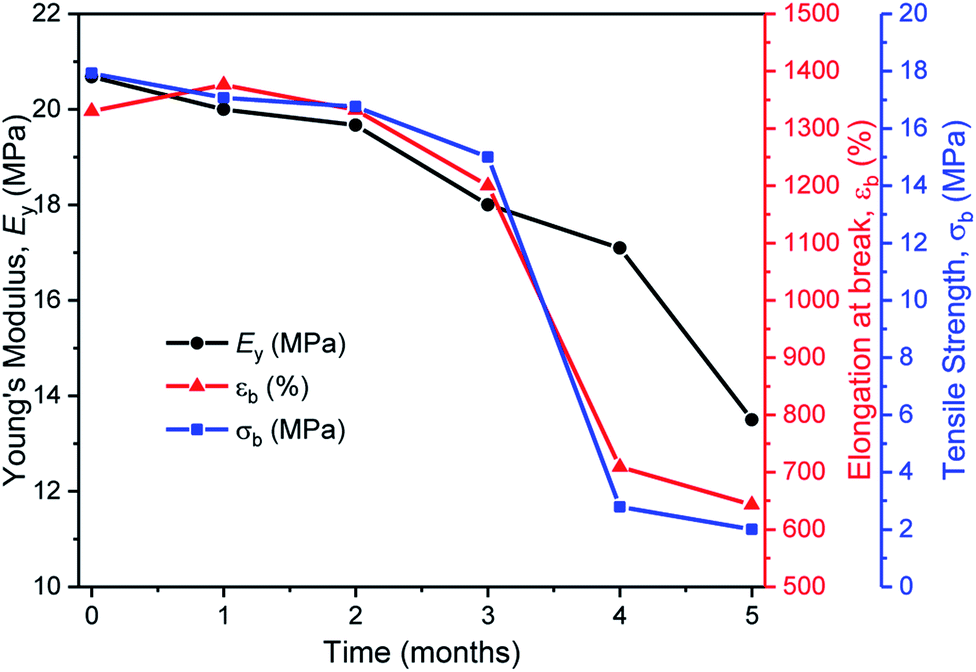 | ||
| Fig. 6 The aqueous degradation of TBPE-5 under acidic conditions and the associated reduction in tensile mechanical properties (p-TSA, water, 60 °C). Note, the initial decreases to the mechanical data are attributed to uptake of a small amount of water and the resulting plasticization of the material. | ||
Finally, degradation experiments were conducted under conditions designed to simulate biological or environmental conditions. Samples of TBPE-5 were suspended in PBS solution (pH = 7.4, 2 wt%), at 37 °C and reacted with a lipase (Novozym® 51032, 4 wt%). After 4 months, there was a 58% decrease in molar mass and broadened dispersity. As the degradation proceeded, the molar masses decreased and multi-modal distributions were observed. These findings are indicative of random chain cleavage reactions (Fig. S62†).
Discussion
The new block polyester's tensile mechanical performances are sufficiently promising to warrant comparison against known commercial materials, including thermoplastic polyolefins (TPO), polyurethanes (TPU), copolyesters (COPE) and polyamides (PEA) (Fig. 7A). The best performances were observed using TBPE-6 to -9 which show competitive tensile strengths and significantly higher elongation at break values than most commercial TPE. The overall performances are best matched to polystyrene-b-polyisoprene-b-polystyrene elastomers (SIS) but the new polyesters show better extensibility (Fig. 7B). They also show significantly wider operating temperature ranges, from −42 to 146 °C (from DMTA), compared to those applicable to SIS thermoplastic elastomers, which span −60 to 95 °C. The related mechanical performances of the TBPEs and SIS are likely due to comparable entanglement molecular mass values, Me, for polyisoprene (6.1 kg mol−1) and PDL (5.9 kg mol−1).84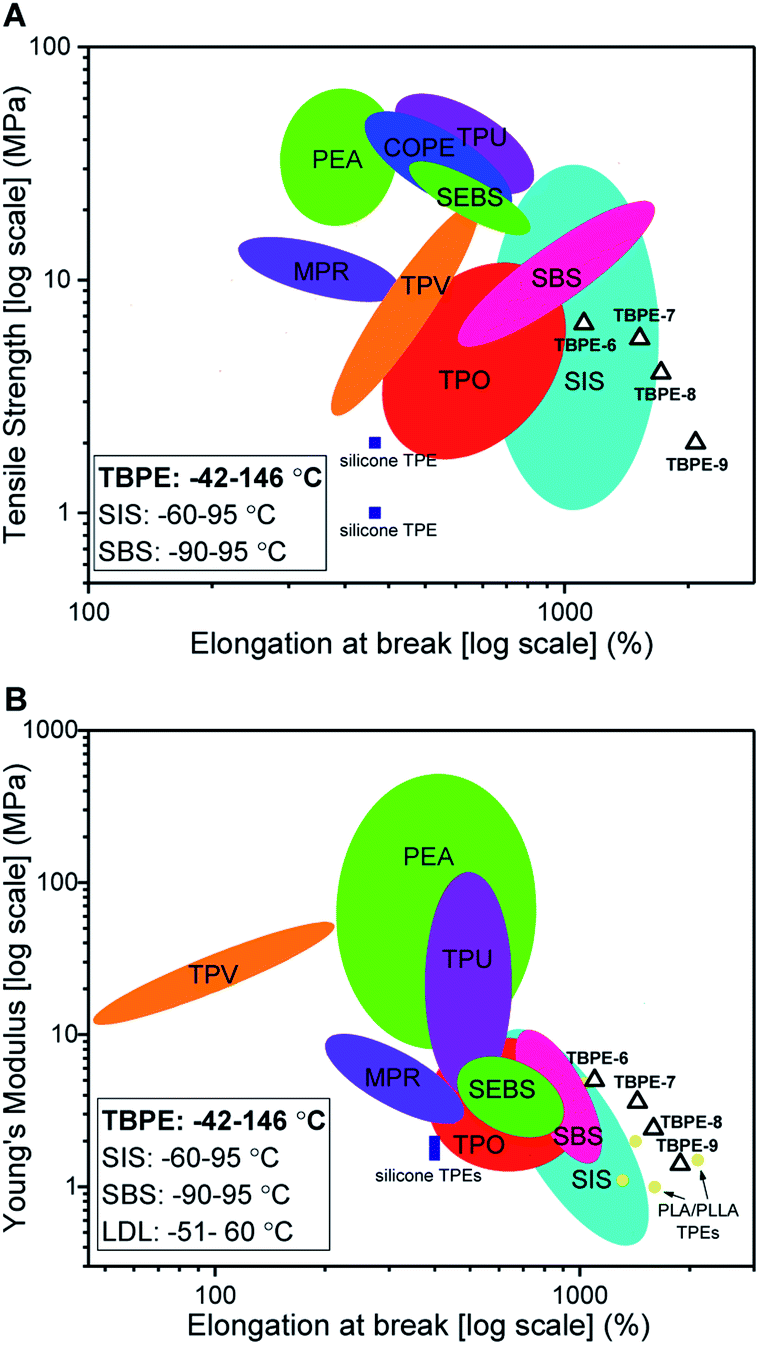 | ||
| Fig. 7 Comparison of mechanical properties of TBPEs-6 to-9 with commercial TPEs. Double logarithm Ashby plots of (A) ultimate tensile strength (σb) and (B) Young's modulus (Ey) against elongation at break (εb). SBS includes Elastamax™ series from PolyOne Corporation, Vector® from Dexco Polymers, LLC and Kraton® D SBS linear triblock copolymers. SIS includes Kraton® D SIS linear triblock polymers, Hybrar™ series from Kurarary Co Ltd. and Kraton® G series with 0% oil content. SEBS = poly(styrene-b-ethylene-co-butylene-b-styrene) including Kraton® G family. TPEs with polyamide hard blocks denoted as PEA include poly(ester-amides), poly(ether-ester-amides) and poly(carbonate-ester-amides). TPO = thermoplastic olefins namely Elastamax™ series from PolyOne Corporation and Engage™ examples from Dow Chemical Company. TPV = thermodynamic vulcanizates, COPE = copolyester thermoplastic elastomers, MPR = melt processable rubbers and TPU = thermoplastic polyurethanes to include ester- and ether-based. PLA/PLLA TPEs refers to those with PDL or PγMCL soft blocks and PL(L)A hard domains reported within the literature (see Table S9†). Operating temperature windows reported here for TBPE-6 to -9 and SIS/SBS TPEs are given in the bottom left hand corner.108 | ||
Comparing the TBPE samples with sustainable aliphatic polyesters reported in the literature, such as PLLA–PDL–PLLA, shows similar tensile strengths and elongations at break. For example, TBPEs-6 to -9 show slightly higher Young's moduli (1.4–5 MPa) than the analogous systems with PLA (1.0–1.1 MPa) or PLLA (2.0–2.9 MPa) hard blocks (Fig. 6B). Importantly, the TBPE series again show significantly higher upper service temperatures than PLLA/PLA analogues (Table S5†).21 Recently, a triblock of the form PLLA–PγMCL–PLLA [PγMCL = poly(γ-methyl-ε-caprolactone)] showed higher tensile strength than the PDL analogue, attributed to a lower Me of 2.8–2.9 kg mol−1.24 In future, it would be interesting to combine the rigid polyester blocks (PE) reported here with PγMCL soft blocks to optimize for applications requiring greater tensile strength. The previously reported multi-block polyester-urethane shows higher toughness than the TBPE-6 or -7 (which have equivalent overall hard block contents). This enhanced toughness may arise from multi-block configurations increasing bridging domain density between hard segments.21 Another area for future investigation would be to prepare multi-block polyesters at analogous volume fractions of PE so as to better understand the influence of block structures, and phase behaviours, on mechanical performances. Finally, triblock polyesters could be prepared from vinyl-CHO which would enable post-functionalization reactions, such as cross-linking or hydroxyl group installation, which would be expected to allow moderation of polyester mechanical properties and hydrophilicity. Overall, the properties of the TBPEs fall within the range of highly resilient synthetic elastomers used to mimic natural products resilin or elastin. Resilin is an elastomeric protein, found in insects, and shows high tensile strain (300%), low stiffness (0.6–2 MPa) and high resilience (92%). Biocompatible polymers showing equivalent mechanical properties are of interest for the engineering of replacement muscle, cartilage or cardiovascular tissue and these TBPEs should be particularly interesting for these applications as they show some of the highest strain to break values yet reported.87
Further work is certainly required to optimise properties and applications for these new thermoplastic elastomers. Nonetheless, this work demonstrates that their mechanical performances could allow for replacement of SIS in some sectors. In contrast to styrenic block polymers these polyesters are, or could be, partly bio-derived. Decalactone is already sourced from castor oil, but PA and CHO are currently petrochemicals. Overall, these TBPEs contain 73–89% theoretical renewable content and this could be increased further if bio-based routes to PA and CHO were scaled.
Phase separated structures
Optimal TPE properties are proposed to derive from phase separated structures where spherical or cylindrical domains of hard blocks are distributed within a continuous soft-block matrix.5 SBCs typically show a spherical morphology at fPS < 0.2 and glassy cylindrical domains from 0.25 < fPS < 0.35, although the exact morphology depends on the block dispersity and sample processing history.109,110 TBPE-6 to -9 (0.12 < fhard < 0.29) exhibit linear stress–strain and elastomeric behaviours and these correlate with cylindrical and/or spherical hard-block phases observed by SAXS measurements. Moreover, TBPE-7 and -8 have the highest elastic recovery and show cylindrical hard domains (SAXS data). TBPE-9 shows lower elastic recovery and SAXS data indicate a spherical morphology. Tensile mechanical behaviours of TBPE-1 to -4 (fhard ∼ 0.4) are very similar to analogous styrenic block polymers and show plastic deformation attributed to a lamellar morphology.81,108,111 Such a morphology disrupts the continuous rubbery matrix and causes an irreversible yield point at low elongation.5 For SBS, the lamellae form when fPS = 0.35–0.65,110i.e. similar to the compositions of TBPE-1 to -4. Compared to these samples, TBPE-5 has more linear stress–strain behaviour, a lower Ey (18 ± 3 MPa) and higher elastic recovery – these properties correlate with SAXS data showing a cylindrical hard-block morphology.80,81 For TBPE-2 to -5, the Young's Modulus decreases (Ey = 226 to 18 MPa) with increasing molar mass (Mn = 61 to 102 kg mol−1, Đ ∼ 1.1) and this is likely attributed to phase morphology changes. It is expected that for this volume fraction, i.e. 0.4 < fhard < 0.44, increasing N drives phase segregation to different morphologies. There may also be differences in the relative rates of phase separation leading to non-equilibrium structures.81,109,112 A similar trend was observed for SBS, at ∼30 wt% polystyrene content, with increasing molar mass: at lower N there was partial block miscibility leading to an interfacial region and decreased elastomeric performances. As N increased, phase separation transitions occurred from hard domain close-packed spheres (S); to cylinders within a hexagonal lattice (L); to gyroid (G) and lastly to lamellar (L) structures.113Polymer recycling and degradation
In terms of polymer processing, the TODT values are quite accessible (>150 °C) and alongside the upper Tg (123–155), well below the onset of thermal degradation (T5%,d > 300 °C).11 This should facilitate thermal processing for all samples and suggests polymer reusability is a real option for these materials. In terms of chemical degradation options, there are conditions under which near complete chain degradation and ester hydrolysis can be achieved. It is rather difficult to compare the rates of hydrolyses with other materials since there is not yet an agreed standardized set of recycling or degradation conditions. For example, polyester hydrolyses have been reported using a range of catalysts, pH values, temperatures and sample preparations.23 Our approach to better understanding the range of feasible degradation conditions was to investigate hydrolysis rates and conversions using polymer solutions in acidified organic solvents, polymer samples suspended in acidified water and by polymer samples suspended in buffered aqueous solutions treated with lipase enzymes. Conditions were selected to model those used in PLA thermoplastic elastomer degradation experiments, in work which was pioneered by Hillmyer and co-workers. Under comparable conditions, these block polyesters also show random chain scission ester hydrolyses and near complete mass loss was observed. In general terms, the overall degradation rates of these TBPE are aligned with similar materials in the literature.23,102,103 For example, PLA–PM–PLA (PM = polymenthide) suspended in phosphate buffered saline solution (pH 7.4) at 37 °C, showed the onset of significant molar mass loss, by SEC, after 15 weeks.103Overall, this work is able to establish that the materials show reasonable stability when exposed only to water but that degradation can be accelerated either by exposure to organic acids or to enzymes. Degradation reactions are slow at room temperature but accelerated by gentle warming either in aqueous suspensions or organic solutions (60 °C). The ability to degrade the polyesters suggests they may be suitable replacements for SIS where complete removal or chemical degradation of the polymer after use is desirable. This future option to build-in circularity to the lifecycle of elastomers may be useful when considering the disassembly of multi-layers common to the electronics, house-hold goods or built-environment sectors.
Conclusions
A series of linear ABA-type triblock polyesters featuring alternating polyester A blocks and flexible PDL B-blocks show excellent performances as thermoplastic elastomers. The materials were efficiently prepared by a combination of the ring-opening polymerization of ε-decalactone and the ring-opening copolymerization of cyclohexene oxide and phthalic anhydride. The process is efficiently catalysed, using a highly active and selective heterodinuclear Zn/Mg complex, which yields high molecular mass triblock polyesters. A series of 9 polyesters were investigated and allowed for systematic study of the influences of overall degree of polymerization (N = 650–1500) and differing compositions (fhard = 0.4–0.12) on thermal–mechanical performances. Materials with fhard ∼ 0.4 were subjected to tensile mechanical testing and showed plastic deformations at low elongations. Samples with lower hard block contents, fhard < 0.4, showed linear stress–strain behaviour and high elongation at break. The best thermoplastic elastomers (fhard 0.19–0.24) showed good tensile strengths (σb = 1–5 MPa), very high strain at break (εb = 1900%), high elastic recovery (>98%) and minimal residual strain (<4%). These samples have block phase separated structures with cylindrical or spherical hard-block morphologies, as shown by SAXS measurements. Overall the new polyesters show tensile mechanical properties which are closely aligned to existing styrenic block polymers, most especially to polystyrene-b-polyisoprene-b-polystyrene (SIS). They show greater elongations at break, a significantly wider operating temperature window and a higher upper service temperature than SIS. A further benefit is the ability to hydrolyse these polyester thermoplastic elastomers using organic acids or by treatment with the lipase Novozyme® 51032.Overall, there is clearly significant potential for alternative polyester hard-blocks in TPE applications and, in particular, polyesters prepared by epoxide/anhydride ring-opening copolymerization (ROCOP) deliver significant material property improvements. Compared to existing PLA-based polyester elastomers, the ROCOP polyester hard-blocks show wider operating temperature ranges and higher upper service temperatures: both important application features. The polymerization processes delivering the block polyesters are straightforward to operate using one-pot procedures combined with a single highly active, selective and controlled polymerization catalyst. To accelerate implementation and reduce costs, the process applies commercially available monomers, already used at scale in the polymer industry, and demonstrates their efficient combination into new block polymer structures. The properties of these block polyesters are consistent with existing styrenic and polyester block materials and, as such, can be rationally optimized. The methods, and polymer structure types, presented in this work are expected to be generally applicable to a very wide range of other monomers. There are many other commercial, functionalized and bio-derived epoxides and anhydrides which merit future investigation to deliver sustainable thermoplastic elastomers, plastics and mimics of natural tissues.
Conflicts of interest
There are no conflicts to declare.Acknowledgements
The EPSRC are (EP/L017393/1, EP/S018603/1); the Faraday Institution [FIRG007] and the Oxford Martin School (Future of Plastics) are acknowledged for research funding. We thank Diamond Light Source for access to beamline I22 through grant number SM23087-1.Notes and references
- D. K. Schneiderman and M. A. Hillmyer, Macromolecules, 2017, 50, 3733–3749 CrossRef CAS.
- F. S. Bates, M. A. Hillmyer, T. P. Lodge, C. M. Bates, K. T. Delaney and G. H. Fredrickson, Science, 2012, 336, 434 CrossRef CAS PubMed.
- P. Cordier, F. Tournilhac, C. Soulie-Ziakovic and L. Leibler, Nature, 2008, 451, 977–980 CrossRef CAS PubMed.
- C. C. Honeker and E. L. Thomas, Chem. Mater., 1996, 8, 1702–1714 CrossRef CAS.
- W. Wang, W. Lu, A. Goodwin, H. Wang, P. Yin, N.-G. Kang, K. Hong and J. W. Mays, Prog. Polym. Sci., 2019, 95, 1–31 CrossRef CAS.
- Thermoplastic Elastomers Market by Type (SBC, TPO, TPV, COPE, PEBA), End-use Industry (Automotive, Building & Construction, Footwear, Engineering, Medical, Wires & Cables), Region - Global Forecast to 2022, Markets and Markets, 2017 Search PubMed.
- The Future of High Performance Elastomers to 2024, Smithers Rapra, 2019 Search PubMed.
- A. Leber, B. Cholst, J. Sandt, N. Vogel and M. Kolle, Adv. Funct. Mater., 2019, 29, 1802629 CrossRef.
- M. Pantoja, P.-Z. Jian, M. Cakmak and K. A. Cavicchi, ACS Appl. Polym. Mater., 2019, 1, 414–424 CrossRef CAS.
- A. M. DiCiccio and G. W. Coates, J. Am. Chem. Soc., 2011, 133, 10724–10727 CrossRef CAS PubMed.
- C. Sinturel, F. S. Bates and M. A. Hillmyer, ACS Macro Lett., 2015, 4, 1044–1050 CrossRef CAS.
- H. Feng, X. Lu, W. Wang, N.-G. Kang and W. J. Mays, Polymers, 2017, 9, 494 CrossRef PubMed.
- L. J. Fetters, E. M. Firer and M. Dafauti, Macromolecules, 1977, 10, 1200–1207 CrossRef CAS.
- L. J. Fetters and M. Morton, Macromolecules, 1969, 2, 453–458 CrossRef CAS.
- X. Zhang, M. Fevre, G. O. Jones and R. M. Waymouth, Chem. Rev., 2018, 118, 839–885 CrossRef CAS PubMed.
- Y. Zhu, C. Romain and C. K. Williams, Nature, 2016, 540, 354–362 CrossRef CAS PubMed.
- Z. Wang, L. Yuan and C. Tang, Acc. Chem. Res., 2017, 50, 1762–1773 CrossRef CAS PubMed.
- A. L. Holmberg, K. H. Reno, R. P. Wool and T. H. Epps III, Soft Matter, 2014, 10, 7405–7424 RSC.
- J. P. Brutman, G. X. De Hoe, D. K. Schneiderman, T. N. Le and M. A. Hillmyer, Ind. Eng. Chem. Res., 2016, 55, 11097–11106 CrossRef CAS.
- D. K. Schneiderman, E. M. Hill, M. T. Martello and M. A. Hillmyer, Polym. Chem., 2015, 6, 3641–3651 RSC.
- M. T. Martello, D. K. Schneiderman and M. A. Hillmyer, ACS Sustainable Chem. Eng., 2014, 2, 2519–2526 CrossRef CAS.
- M. A. Hillmyer and W. B. Tolman, Acc. Chem. Res., 2014, 47, 2390–2396 CrossRef CAS PubMed.
- G. X. De Hoe, M. T. Zumstein, B. J. Tiegs, J. P. Brutman, K. McNeill, M. Sander, G. W. Coates and M. A. Hillmyer, J. Am. Chem. Soc., 2018, 140, 963–973 CrossRef CAS PubMed.
- A. Watts, N. Kurokawa and M. A. Hillmyer, Biomacromolecules, 2017, 18, 1845–1854 CrossRef CAS PubMed.
- A. Watts and M. A. Hillmyer, Biomacromolecules, 2019, 20, 2598–2609 CrossRef CAS PubMed.
- M. A. Hillmyer and W. B. Tolman, Acc. Chem. Res., 2014, 47, 2390–2396 CrossRef CAS PubMed.
- S. Lee, K. Lee, J. Jang, J. S. Choung, W. J. Choi, G.-J. Kim, Y.-W. Kim and J. Shin, Polymer, 2017, 112, 306–317 CrossRef CAS.
- S. Lee, K. Lee, Y.-W. Kim and J. Shin, ACS Sustainable Chem. Eng., 2015, 3, 2309–2320 CrossRef CAS.
- M. T. Martello and M. A. Hillmyer, Macromolecules, 2011, 44, 8537–8545 CrossRef CAS.
- J. M. Bolton, M. A. Hillmyer and T. R. Hoye, ACS Macro Lett., 2014, 3, 717–720 CrossRef CAS.
- S. Noppalit, A. Simula, N. Ballard, X. Callies, J. M. Asua and L. Billon, Biomacromolecules, 2019, 20, 2241–2251 CrossRef CAS PubMed.
- S. Wang, S. Vajjala Kesava, E. D. Gomez and M. L. Robertson, Macromolecules, 2013, 46, 7202–7212 CrossRef CAS.
- J. Yu, J. Wang, C. Wang, Y. Liu, Y. Xu, C. Tang and F. Chu, Macromol. Rapid Commun., 2015, 36, 398–404 CrossRef CAS PubMed.
- E. M. Frick, A. S. Zalusky and M. A. Hillmyer, Biomacromolecules, 2003, 4, 216–223 CrossRef CAS PubMed.
- M. Nasiri and T. M. Reineke, Polym. Chem., 2016, 7, 5233–5240 RSC.
- J. P. MacDonald and M. P. Shaver, Polym. Chem., 2016, 7, 553–559 RSC.
- T. Liu, T. L. Simmons, D. A. Bohnsack, M. E. Mackay, M. R. Smith and G. L. Baker, Macromolecules, 2007, 40, 6040–6047 CrossRef CAS.
- A. Buchard, D. R. Carbery, M. G. Davidson, P. K. Ivanova, B. J. Jeffery, G. I. Kociok-Köhn and J. P. Lowe, Angew. Chem., Int. Ed., 2014, 53, 13858–13861 CrossRef CAS PubMed.
- C. K. Williams, Chem. Soc. Rev., 2007, 36, 1573–1580 RSC.
- F. Jing and M. A. Hillmyer, J. Am. Chem. Soc., 2008, 130, 13826–13827 CrossRef CAS PubMed.
- S. Paul, Y. Zhu, C. Romain, R. Brooks, P. K. Saini and C. K. Williams, Chem. Commun., 2015, 51, 6459–6479 RSC.
- J. M. Longo, M. J. Sanford and G. W. Coates, Chem. Rev., 2016, 116, 15167–15197 CrossRef CAS PubMed.
- E. Hosseini Nejad, A. Paoniasari, C. E. Koning and R. Duchateau, Polym. Chem., 2012, 3, 1308–1313 RSC.
- P. K. Saini, C. Romain, Y. Zhu and C. K. Williams, Polym. Chem., 2014, 5, 6068–6075 RSC.
- D. J. Darensbourg, R. R. Poland and C. Escobedo, Macromolecules, 2012, 45, 2242–2248 CrossRef CAS.
- E. H. Nejad, A. Paoniasari, C. G. W. van Melis, C. E. Koning and R. Duchateau, Macromolecules, 2013, 46, 631–637 CrossRef CAS.
- L. Lin, J. Liang, Y. Xu, S. Wang, M. Xiao, L. Sun and Y. Meng, Green Chem., 2019, 21, 2469–2477 RSC.
- X. Yu, J. Jia, S. Xu, K. U. Lao, M. J. Sanford, R. K. Ramakrishnan, S. I. Nazarenko, T. R. Hoye, G. W. Coates and R. A. DiStasio, Nat. Commun., 2018, 9, 2880 CrossRef PubMed.
- H. Li, H. Luo, J. Zhao and G. Zhang, Macromolecules, 2018, 51, 2247–2257 CrossRef CAS.
- G. Si, L. Zhang, B. Han, Z. Duan, B. Li, J. Dong, X. Li and B. Liu, Polym. Chem., 2015, 6, 6372–6377 RSC.
- S. Giarola, C. Romain, C. K. Williams, J. P. Hallett and N. Shah, Chem. Eng. Res. Des., 2016, 107, 181–194 CrossRef CAS.
- M. Winkler, C. Romain, M. A. R. Meier and C. K. Williams, Green Chem., 2015, 17, 300–306 RSC.
- E. Mahmoud, D. A. Watson and R. F. Lobo, Green Chem., 2014, 16, 167–175 RSC.
- Y. Zhu, M. R. Radlauer, D. K. Schneiderman, M. S. P. Shaffer, M. A. Hillmyer and C. K. Williams, Macromolecules, 2018, 51, 2466–2475 CrossRef CAS.
- C. Romain, Y. Zhu, P. Dingwall, S. Paul, H. S. Rzepa, A. Buchard and C. K. Williams, J. Am. Chem. Soc., 2016, 138, 4120–4131 CrossRef CAS PubMed.
- Y. Zhu, C. Romain and C. K. Williams, J. Am. Chem. Soc., 2015, 137, 12179–12182 CrossRef CAS PubMed.
- T. Stößer and C. K. Williams, Angew. Chem., Int. Ed., 2018, 57, 6337–6341 CrossRef PubMed.
- T. Stößer, T. T. D. Chen, Y. Zhu and C. K. Williams, Philos. Trans. R. Soc., A, 2018, 376, 20170066 CrossRef PubMed.
- O. Hauenstein, M. Reiter, S. Agarwal, B. Rieger and A. Greiner, Green Chem., 2016, 18, 760–770 RSC.
- G. S. Sulley, G. L. Gregory, T. T. D. Chen, L. P. Carrodeguas, G. Trott, A. Santmarti, K.-Y. Lee, N. J. Terrill and C. K. Williams, Selective Catalysis Delivers Versatile Properties to CO2-Derived Block Polymers, J. Am. Chem. Soc., 2019, 142, 4367–4378 CrossRef PubMed.
- P. Olsén, T. Borke, K. Odelius and A.-C. Albertsson, Biomacromolecules, 2013, 14, 2883–2890 CrossRef PubMed.
- C. Romain and C. K. Williams, Angew. Chem., Int. Ed., 2014, 53, 1607–1610 CrossRef CAS PubMed.
- T. T. D. Chen, Y. Zhu and C. K. Williams, Macromolecules, 2018, 51, 5346–5351 CrossRef CAS.
- S. Kernbichl, M. Reiter, F. Adams, S. Vagin and B. Rieger, J. Am. Chem. Soc., 2017, 139, 6787–6790 CrossRef CAS PubMed.
- T. Stößer, D. Mulryan and C. K. Williams, Angew. Chem., Int. Ed., 2018, 57, 16893–16897 CrossRef PubMed.
- T. Stößer, G. S. Sulley, G. L. Gregory and C. K. Williams, Nat. Commun., 2019, 10, 2668 CrossRef PubMed.
- H.-Y. Ji, B. Wang, L. Pan and Y.-S. Li, Angew. Chem., Int. Ed., 2018, 57, 16888–16892 CrossRef CAS PubMed.
- S. Paul, C. Romain, J. Shaw and C. K. Williams, Macromolecules, 2015, 48, 6047–6056 CrossRef CAS.
- G.-P. Wu and D. J. Darensbourg, Macromolecules, 2016, 49, 807–814 CrossRef CAS.
- M. R. Kember and C. K. Williams, J. Am. Chem. Soc., 2012, 134, 15676–15679 CrossRef CAS PubMed.
- M. R. Kember, J. Copley, A. Buchard and C. K. Williams, Polym. Chem., 2012, 3, 1196–1201 RSC.
- F. Jutz, A. Buchard, M. R. Kember, S. B. Fredriksen and C. K. Williams, J. Am. Chem. Soc., 2011, 133, 17395–17405 CrossRef CAS PubMed.
- C. Romain, J. A. Garden, G. Trott, A. Buchard, A. J. P. White and C. K. Williams, Chem.–Eur. J., 2017, 23, 7367–7376 CrossRef CAS PubMed.
- G. Trott, J. A. Garden and C. K. Williams, Chem. Sci., 2019, 10, 4618–4627 RSC.
- B. A. Abel, C. A. L. Lidston and G. W. Coates, J. Am. Chem. Soc., 2019, 141, 12760–12769 CrossRef CAS PubMed.
- J. Li, B.-H. Ren, S.-Y. Chen, G.-H. He, Y. Liu, W.-M. Ren, H. Zhou and X.-B. Lu, ACS Catal., 2019, 9, 1915–1922 CrossRef CAS.
- N. J. Van Zee, M. J. Sanford and G. W. Coates, J. Am. Chem. Soc., 2016, 138, 2755–2761 CrossRef CAS PubMed.
- C. Romain and C. K. Williams, Angew. Chem., Int. Ed., 2014, 53, 1607–1610 CrossRef CAS PubMed.
- Y. Zhu, C. Romain, V. Poirier and C. K. Williams, Macromolecules, 2015, 48, 2407–2416 CrossRef CAS.
- H. Wang, W. Lu, W. Wang, P. N. Shah, K. Misichronis, N.-G. Kang and J. W. Mays, Macromol. Chem. Phys., 2018, 219, 1700254 CrossRef.
- M. Morton, J. E. McGrath and P. C. Juliano, J. Polym. Sci., Polym. Symp., 1969, 26, 99–115 CrossRef.
- J. G. Drobny, in Handbook of Thermoplastic Elastomers, William Andrew Publishing, Norwich, NY, 2007 Search PubMed.
- D. Rosato and D. Rosato, in Plastics Engineered Product Design, Elsevier Science, Amsterdam, 2003, pp. 161–197, DOI:10.1016/b978-185617416-9/50004-1.
- J.-D. Tong and R. Jerôme, Macromolecules, 2000, 33, 1479–1481 CrossRef CAS.
- W. Wang, J. Zhang, F. Jiang, X. Wang and Z. Wang, ACS Appl. Polym. Mater., 2019, 1, 571–583 CrossRef CAS.
- B. Erman and J. E. Mark, in The Science and Technology of Rubber, ed. J. E. Mark, B. Erman and C. M. Roland, Fourth edn, Academic Press, Boston, 2013, pp. 167–192, DOI:10.1016/b978-0-12-394584-6.00004-2.
- Z. Wang, L. Yuan, F. Jiang, Y. Zhang, Z. Wang and C. Tang, ACS Macro Lett., 2016, 5, 220–223 CrossRef CAS.
- M. W. Matsen, Macromolecules, 2012, 45, 2161–2165 CrossRef CAS.
- S. Wang and M. L. Robertson, ACS Appl. Mater. Interfaces, 2015, 7, 12109–12118 CrossRef CAS PubMed.
- M. W. Matsen, J. Chem. Phys., 2000, 113, 5539–5544 CrossRef CAS.
- W. Ding and M. L. Robertson, Eur. Polym. J., 2019, 113, 411–423 CrossRef CAS.
- Thermal Analysis of Rubbers and Rubbery Materials, ed. N. R. Choudhury, P. P. De and N. K. Dutta, Smithers Rapra Technology Ltd, iSmithers Shawbury, Shrewsbury, Shropshire, SY4 4NR, UK, 2010 Search PubMed.
- I. W. Hamley and V. Castelletto, Prog. Polym. Sci., 2004, 29, 909–948 CAS.
- K. Azuma, J. Sun, Y. Choo, Y. Rokhlenko, J. H. Dwyer, B. Schweitzer, T. Hayakawa, C. O. Osuji and P. Gopalan, Macromolecules, 2018, 51, 6460–6467 CrossRef CAS.
- N. Hadjichristidis, S. Pispas and G. A. Floudas, in Block Copolymers: synthetic strategies, physical properties and applications, 2003 Search PubMed.
- D. B. Drazkowski, A. Lee and T. S. Haddad, Macromolecules, 2007, 40, 2798–2805 CrossRef CAS.
- D. Man Baek, C. D. Han and J. K. Kim, Polymer, 1992, 33, 4821–4831 CrossRef.
- M. Hong and E. Y. X. Chen, Green Chem., 2017, 19, 3692–3706 RSC.
- A. Rahimi and J. M. García, Nat. Rev. Chem., 2017, 1, 0046 CrossRef.
- C. Jehanno, M. M. Pérez-Madrigal, J. Demarteau, H. Sardon and A. P. Dove, Polym. Chem., 2019, 10, 172–186 RSC.
- T. P. Haider, C. Völker, J. Kramm, K. Landfester and F. R. Wurm, Angew. Chem., Int. Ed., 2019, 58, 50–62 CrossRef CAS PubMed.
- R. L. Snyder, D. J. Fortman, G. X. De Hoe, M. A. Hillmyer and W. R. Dichtel, Macromolecules, 2018, 51, 389–397 CrossRef CAS.
- C. L. Wanamaker, W. B. Tolman and M. A. Hillmyer, Biomacromolecules, 2009, 10, 443–448 CrossRef CAS PubMed.
- C. G. Pitt and G. Zhong-wei, J. Controlled Release, 1987, 4, 283–292 CrossRef CAS.
- S. Kobayashi, H. Uyama and T. Takamoto, Biomacromolecules, 2000, 1, 3–5 CrossRef CAS PubMed.
- S. Lyu, J. Schley, B. Loy, D. Lind, C. Hobot, R. Sparer and D. Untereker, Biomacromolecules, 2007, 8, 2301–2310 CrossRef CAS PubMed.
- L. N. Woodard and M. A. Grunlan, ACS Macro Lett., 2018, 7, 976–982 CrossRef CAS PubMed.
- R. Shanks and I. Kong, in Thermoplastic Elastomers, 2012, ch. 18, DOI:10.5772/36807.
- G. Kim and M. Libera, Macromolecules, 1998, 31, 2569–2577 CrossRef CAS.
- J. M. Widin, A. K. Schmitt, A. L. Schmitt, K. Im and M. K. Mahanthappa, J. Am. Chem. Soc., 2012, 134, 3834–3844 CrossRef CAS PubMed.
- J. E. Puskas, P. Antony, M. El Fray and V. Altstädt, Eur. Polym. J., 2003, 39, 2041–2049 CrossRef CAS.
- B. J. Dair, C. C. Honeker, D. B. Alward, A. Avgeropoulos, N. Hadjichristidis, L. J. Fetters, M. Capel and E. L. Thomas, Macromolecules, 1999, 32, 8145–8152 CrossRef CAS.
- S. Ghosh, A. K. Bhowmick, N. Roychowdhury and G. Holden, J. Appl. Polym. Sci., 2000, 77, 1621–1628 CrossRef CAS.
Footnote |
| † Electronic supplementary information (ESI) available: Experimental methods, spectroscopic data and thermal–mechanical data. See DOI: 10.1039/d0sc00463d |
| This journal is © The Royal Society of Chemistry 2020 |