 Open Access Article
Self-assembly of reversed bilayer vesicles through pnictogen bonding: water-stable supramolecular nanocontainers for organic solvents†
Shiva
Moaven
 ,
Brandon T.
Watson
 ,
Shelby B.
Thompson
 ,
Veronica J.
Lyons
,
Daniel K.
Unruh
,
Veronica J.
Lyons
,
Daniel K.
Unruh
 ,
Dominick J.
Casadonte
,
Dimitri
Pappas
,
Dominick J.
Casadonte
,
Dimitri
Pappas
 and
Anthony F.
Cozzolino
 *
*
Department of Chemistry and Biochemistry, Texas Tech University, Box 41061, Lubbock, Texas 79409-1061, USA. E-mail: Anthony.f.cozzolino@ttu.edu
First published on 9th April 2020
Abstract
A new air and moisture stable antimony thiolate compound has been prepared that spontaneously forms stable hollow vesicles. Structural data reveals that pnictogen bonding drives the self-assembly of these molecules into a reversed bilayer. The ability to make these hollow, spherical, and chemically and temporally stable vesicles that can be broken and reformed by sonication allows these systems to be used for encapsulation and compartmentalisation in organic media. This was demonstrated through the encapsulation and characterization of several small organic reporter molecules.
Introduction
Storage and delivery of different compounds for medicinal applications, chemical reactions and analysis, cosmetics, and coatings is of great importance.1–4 Biological systems have developed a very useful tool to achieve this. Biological cell membranes can compartmentalize into different sizes (nano to micrometre) of vesicles to protect and transport the different components of life within a physiological medium.5 Non-aqueous environments play a dominant role in synthetic chemistry and different approaches are being investigated for the preparation of vesicles amenable to these environments. The real and perceived applications of these include synthetic cells,5–7 nanocontainers1,3,8,9 and nanoreactors.1,10 These vesicles can be prepared using either covalent (polymers, metal-coordinated amphiphiles)11–16 or non-covalent (dendrimers, phospholipids, polymers)7,17–21 strategies. Polymersomes and metal-coordinated amphiphiles have proven to be useful in organic solutions for carrying and delivering their cargoes. Non-covalent interactions can be used to self-assemble reversed vesicles with more dynamic behaviour. Hydrogen bonding (HB)22,23 and pnictogen bonding (PnB)24 have also been successfully applied to this problem.In this paper, an antimony thiolate cage, Sb-1Et is prepared and its ability to form stable vesicles mediated by pnictogen bonding is studied. We contrast this to our previously reported bicyclic antimony alkoxide compounds (Sb-2Pr and Sb-2NHCONon) that self-assemble into reversed bilayers facilitated by pnictogen bonding (Fig. 1).24,25 Sonication of crystalline Sb-2NHCONon under strictly anhydrous conditions resulted in the formation of reversed bilayer vesicles with an average diameter of 70 nm.24 These compounds represent a well-behaved model system that allows for careful study, but they are susceptible to hydrolysis at the Sb–O bonds. This imposes limits on the future application of these unique supramolecular structures. Stibnite (Sb2S3) is one of the most stable and abundant sources of antimony.26 Unlike the oxide analogue (Sb2O3), stibnite favours formation of ribbons. The presence of PnBs between ribbon layers has been recognized previously suggesting that a thiol analogue of the previously studied antimony alkoxides might still self-assemble.27–29 Synthesis of antimony thiolates was envisioned as an approach to engender moisture stability30–32 in these compounds while retaining the ability to self-assemble into reversed bilayers.
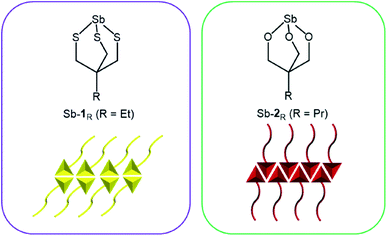 | ||
| Fig. 1 Antimony thiolate cage (left) and previously reported antimony alkoxide cage25 (right) and depiction of pnictogen-bonded bilayer motifs that they each form (bottom). | ||
Synthesis and characterization of a trivalent antimony thiolate
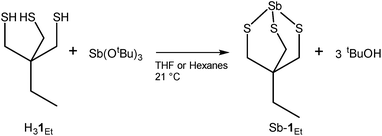
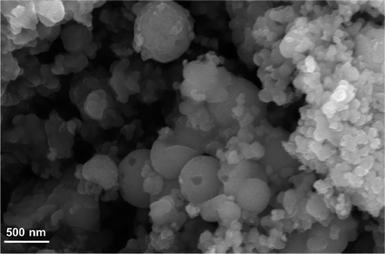
Treatment of H31Et with antimony tris-tert-butoxide (see S1.2 in ESI†) in anhydrous THF or hexanes results in the formation of Sb-1Et (Scheme 1). Compound Sb-1Et is confirmed by the loss of the band at 2552 cm−1 (Fig. S16†) associated with the S–H bond stretching vibration and disappearance of the chemical shift signal at 2.21 ppm (Fig. S7†) in the FTIR and 1H NMR spectra, respectively. This is accompanied by the formation of tert-butanol. Additionally, protons of the methylene groups adjacent to the sulphur atoms shift to 2.98 ppm from 2.47 ppm upon the formation of the cage and the C–S stretching frequencies of Sb-1Et show a significant red shift to 672, 622, and 520 cm−1 (from 713 and 677 cm−1 in H31Et). These experimental values were compared with DFT calculated values from monomer Sb-1H and dimer (Sb-1H)2 and the frequency values calculated for both are in good agreement with the experimental values from Sb-1Et. To confirm the water stability of the newly prepared compound, a hydrolytic stability test was performed. To a dry DMSO-d6 solution of Sb-1Et, 10 equivalents of D2O were added and the chemical shifts of the protons were monitored for 24 hours and no changes were observed (see Fig. S8†).Regardless of polarity of the solvent used in the synthesis of Sb-1Et, only an amorphous material was recovered as confirmed by powder X-ray diffraction (PXRD) analysis. This was further confirmed by light microscopy where some of the larger particles of Sb-1Et appeared spherical and translucent, suggesting the formation of hollow spheres. To gain a better understanding of the morphology of Sb-1Et (as-synthesized), it was subjected to SEM which verified that Sb-1Et spontaneously forms spherical supramolecular structures (Fig. 2).
In situ encapsulation of guest molecules
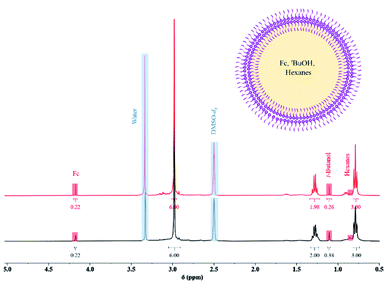
To investigate whether these spherical structures are hollow or not, a known amount of ferrocene (Fc) was used as a marker molecule to be encapsulated during the synthesis of Sb-1Et (for more details see S4.1 in ESI†). After removal of the free Fc molecules, the vesicles were lysed and dissolved with DMSO-d6 and studied by 1H NMR. Characterization of the ruptured vesicles of Sb-1Et by 1H NMR revealed the presence of the Fc marker molecule and tert-butanol (the co-product of the reaction) along with hexanes (the reaction solvent). The theoretical ratio of the protons of Fc compared to protons of tert-butanol in the reaction is 0.56. Integrated values from the 1H NMR in Fig. 3 reveal an experimental ratio of 0.58 which is very close to the theoretical value and confirms the ability to form hollow vesicles that encapsulate other chemicals during synthesis. In this case a total of approximately 0.2% of the Fc molecules were captured in the vesicles during their in situ formation. A sample was stored and dissolved in DMSO-d6 after 6 months at ambient conditions. All Fc molecules were still encapsulated inside the vesicles (based on the ratio of Fc protons to methylene cage protons of Sb-1Et). However, the ratio of the Fc protons to tert-butanol was not equal to the value obtained initially which suggests that more volatile chemicals (tert-butanol and hexanes) can escape vesicles over an extended time period. This behaviour contrasts significantly with the isostructural antimony alkoxide cage which is isolated as a crystalline material with a helical columnar supramolecular structure.25Solid-state characterization of antimony thiolate bilayer
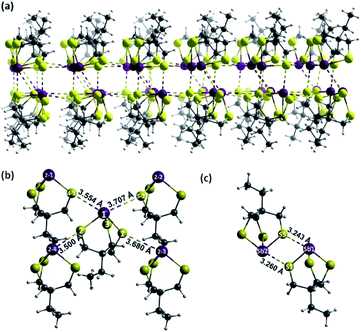
X-ray quality single crystals of Sb-1Et were obtained from the slow evaporation of a solution of Sb-1Et following sonication in acetonitrile. XRD analysis revealed the anticipated cage structure with three Sb–S primary bonds with average bond distance of 2.444(7) Å as depicted in Fig. 4 which is in agreement with the average reported Sb–S (2.44 Å) bond distance.33 The longer Sb–S bonds lead to a cage that is significantly more distorted away from C3v symmetry than in alkoxides Sb-2R (R = Me, Et, Pr, NHCONon). The Sb–Ch–C angles are significantly more acute in Sb-1Et (∼102°) than in alkoxide Sb-2R (∼118°).24,25 In the crystal structure, molecules of Sb-1Et self-assemble through pnictogen bonds to form a reversed bilayer structure where each antimony interacts with three distinct sulphur atoms (Fig. 4a). Within each layer, every molecule is surrounded by four molecules of Sb-1Et as shown in Fig. 4b. The Sb atom in the central molecule forms PnBs with two S atoms on adjacent molecules, the Sb1⋯S4-1 and Sb1⋯S5-2 distances are 3.554(8) Å and 3.707(5) Å respectively, which are 92% and 96% of the ∑rvdW of Sb and S. Two of the sulphur atoms (S1 and S2) act as PnB acceptors for the adjacent Sb2-3 and Sb2-4 atoms. The S1⋯Sb2-3 and S2⋯Sb2-4 bond distances are 3.680(8) Å and 3.500(6) Å, respectively, or 95% and 90% of the ∑rvdW of Sb and S. In addition to the intralayer PnBs depicted in Fig. 4b, each molecule forms a set of interlayer interactions. This set of interactions occurs between molecules in an antiparallel alignment to form a supramolecular synthon that contains two primary Sb–S bonds and two PnBs (Fig. 4c). PnB distances for Sb1⋯S5 and Sb2⋯S1 in this dimeric unit are shorter than the other PnBs at 3.243(6) Å and 3.260(6) Å which averages to 84% of the ∑rvdW. This motif differs slightly from those observed with the antimony alkoxide cages, where every pnictogen bond is with a molecule in the opposing layer.24,25 The ability of the thiol analogue to form a similar bilayer structure contrasts with Sb(S2C6H4)SMe which does not form a bilayer structure in the solid state whereas the oxygen analogue, Sb(O2C6H4)OMe, does.34 This hints at the importance of the cage structure in promoting a predictable bilayer assembly. The synthesis and crystal structure of the arsenic analogue (As-1Et) has been reported previously. No bilayer structure was observed, rather simple dimers of As-1Et assembled through two PnBs are observed. The As1⋯S1 distance is 3.537 Å which is 97% of the ∑rvdW of As and S.35 The difference between the number and distances of PnBs formed in As-1Et and Sb-1Et illustrates the important role of the heavier elements in the application and design of supramolecular structures. The heavier pnictogen thiolate cages are more Lewis acidic as a result of increasing stereochemical inactivity of the lone pairs and the increasing polarity of the primary bonds. This is in line with findings for the analogous alkoxide cages36 and is in line with other experimental and computational findings for pnictogen, chalcogen and halogen bonding in the +3, +2 and +1 oxidation states, respectively.37–42Computational study of the pnictogen bonding
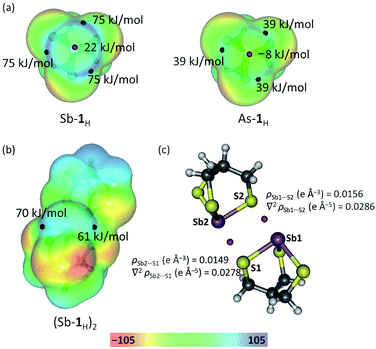
An often suggested prerequisite for strong PnBs, following studies on halogen and chalcogen bonding, is the presence of large Vmax (maximum in the electrostatic potential energy surface calculated on a molecular surface at 0.001 au)43,44 values associated with the electrophilic regions of the ESP surface.40,45–48 A typical design strategy used to achieve this is to incorporate polar primary bonds. The replacement of O with S to enhance the stability of the primary bonds is therefore expected to result in smaller Vmax values and weaker PnBs. Given the observed self-assembly, it became of interest to determine the driving force behind the formation of these PnBs as compared with the alkoxide congeners. Molecular geometries and electronic structures were optimized using DFT (B97-D3, ZORA, def2-TZVPP). The electrostatic potential energy (ESP) shown in Fig. 5a and Fukui functions(see Fig. S1 in ESI†) integrated from above (f+(r)) were plotted on the molecular surface (0.001 au) of Sb-1H and As-1H monomers. Three localized electrophilic regions are observed on the Fukui function. These regions complement the three Vmax regions on the electrostatic potential surface and serve to give directionality to these interactions. The Vmax values, however, are intermediate to the analogous antimony alkoxide cage, which forms three pnictogen bonds, and the arsenic alkoxide cage, which only forms one in the solid state suggesting a diminished electrostatic contribution to the Sb⋯S pnictogen bonds.36 Despite the lower Vmax values calculated for Sb-1H, they are still considerably larger than those calculated for As-1H (Fig. 5a) which further supports the use of the heavier pnictogens for stronger and more PnBs.To gain a better understanding of the ability of Sb-1Et to form the multiple pnictogen bonds required for reversed bilayer assembly, the energetics of pnictogen bond formation were probed and contrasted with those of the Sb-2Pr using simplified model systems (see Fig. S2 and Table S2†). The alkoxide dimer (Sb-2H)2, and thiolate dimer (Sb-1H)2 are assembled through two PnBs (as depicted in Fig. S2†) and have dimerization energies of −53 kJ mol−1 (average of two crystallographically independent dimers) and −41 kJ mol−1, respectively. To verify the presence of PnBs in the dimer, and probe the role of orbital overlap in stabilizing these interactions, an atoms in molecules (AIM) analysis was performed on (Sb-1H)2 (represented in Fig. 5b). The analysis revealed two bond critical points (BCP) between each Sb and S pair located on the bond path associated with the PnBs in the dimer (Fig. 5c). The densities at the PnB BCPs are 0.0156 and 0.0149 e Å−3 for Sb1⋯S2 and Sb2⋯S1, respectively. These values are consistent with those reported for pnictogen, chalcogen and halogen bonding.36,39,49 It is noteworthy that the BCP values for (Sb-1H)2 are about 60% smaller than the BCP values for (Sb-2H)2 reported previously.36 This suggests that, in addition to a diminished electrostatic contribution to the Sb⋯S PnBs, the covalency is also lower. The near zero, but positive Laplacian of the electron density at the PnB BCPs indicates the closed-shell nature of these interactions.49 The lower energy associated with (Sb-1H)2 is consistent with the lower electrostatic potentials. This appears to contrast with the ability of these systems to self-assemble into bilayers and spontaneously form spherical structures upon synthesis. It seemed possible that the loss of stabilization from directional electrostatic attraction could be offset by an increase in non-direction London dispersion forces resulting from the increase in polarizability of the chalcogen. Inclusion of dispersion corrections in the energy calculations50 revealed how important this contribution becomes in the thiolate system. The dispersion-corrected dimerization energy of thiolate (Sb-1H)2 is −97 kJ mol−1 which is slightly more than the alkoxide (Sb-2H)2 (−93 kJ mol−1). Dispersion represents 58% of the dimerization energy in (Sb-1H)2 (compared to 43% in (Sb-2H)2). This illustrates the significant role the non-directional London dispersion forces play in reinforcing the directional electrostatic and polarization contributions associated with pnictogen bonding. The role of solvent in stabilizing these bilayers with respect to the monomeric units was not addressed in this study, but it can be expected that solvent plays an important role in this.
Preparation and characterization of vesicles
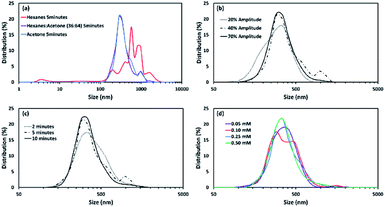
The as-synthesized vesicles of Sb-1Et appear to have a very large size distribution (Fig. 2). To control the size distribution of the vesicles, samples were sonicated using a 20 kHz, VCX 750 (Sonics and Materials) ultrasonic probe. Following sonication, particle sizes were measured using a Nanotrac Model NPA250 DLS (Dynamic Light scattering) instrument. Four different parameters, solvent, probe power amplitude, sonication time, and concentration (0.05, 0.10, 0.25, 0.50 mM), were evaluated in order to understand the impact of each. A summary of the findings are provided in Fig. 6 (see S3 in ESI† for full details on all experiments).The distributions are relatively invariant with respect to all of the parameters except for the nature of the solvent. This contrasts with samples of Sb-2NHCONon, where concentration also has a significant effect on the size distribution of the particles. The size distributions of particles of Sb-1Et under most conditions tends to centre at 320 nm. These particles are larger than the vesicles observed for Sb-2NHCONon (∼70 nm). Hexanes gave rise to a broader distribution of larger particles. As a result, 5 minutes sonication time and 40% power amplitude were chosen as a standard set of conditions for the preparation of reversed vesicles for further study.
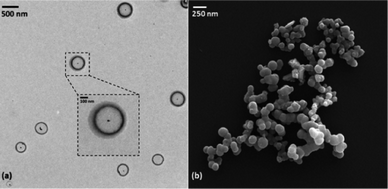
Fig. 7 shows a TEM and SEM image of the vesicles prepared at a concentration of 0.25 mM in wet acetone with a sonication time of 5 minutes and 40% power amplitude. Due to the presence of antimony atoms there is no need to stain the samples for TEM imaging. Both TEM and SEM images support the average size distribution obtained from the DLS measurements. The SEM images reveal a spherical morphology for these supramolecular structures and the TEM images confirm that these structures are hollow. Taken together with the structural data, a model emerges of hollow vesicles with reversed bilayer membranes held together by pnictogen bonds. Remarkably, images of the same solutions obtained after 90 days show a similar distribution of these structures, indicating a good temporal stability of these vesicles and an excellent tolerance to typical laboratory atmospheric conditions.
To facilitate encapsulation studies in chloroform, vesicle preparation using ultrasound in this solvent was also evaluated. The size distribution of the vesicles prepared in a chloroform solution was not as uniformly distributed as those in acetone (Fig. 8a); a size distribution between 30–1000 nm with three major peaks at 86, 204, and 818 nm was observed. Extrusion has been used with biological membranes to produce uniform vesicle sizes. This strategy was adapted for these vesicles by using an extrusion setup (Avanti Polar Lipids, Inc.) with a hydrophobic PTFE membrane (Cole-Parmer, 0.22 μm pore size) sandwiched between two Teflon holders with o-rings. This membrane was chosen as it is stable to chloroform and other organic solvents, but it should be noted that the pores in these membranes are quite different than the typical track-etched polycarbonante membranes used for vesicles prepared from membranes in aqueous solutions. A 0.25 mM chloroform solution of the vesicles was prepared using an ultrasonic probe (40% power amplitude for five minutes). For each extrusion cycle, a 10 mL sample was extruded portion wise (1 mL at a time) through the membrane. All aliquots were collected in a vial and their size distribution was measured before the next cycle of the extrusion. Five rounds of extrusion yielded vesicles with a uniform and narrow size distribution around 240 nm which is the approximate size of the pores in the membrane(Fig. 8b). To confirm vesicles were still hollow TEM images (Fig. 8c) were collected and demonstrated that the majority are still hollow. However, it appeared that some of the larger vesicles have encapsulated smaller ones during the extrusion process.
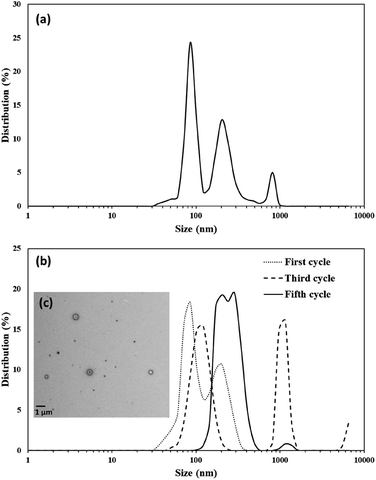 | ||
| Fig. 8 Size distribution of (a) 0.25 mM chloroform solution of vesicles prepared (b) same vesicle solution extruded for five cycles. (c) TEM image of the extruded vesicles after fifth cycle. | ||
Encapsulation of guest molecules
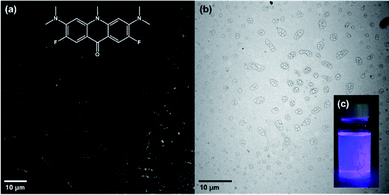
The ability to make hollow, spherical, and chemically and temporally stable vesicles that can be broken and reformed by sonication indicated that these systems could be useful for encapsulation and compartmentalisation in organic media. To test this, fluorescent dyes rhodamine B (RhB) and an acridone-based (Ac) dye were post-synthetic encapsulated and imaged.51 To capture the fluorescent dyes, 0.7 mg of RhB, or 0.1 mg of Ac were added to acetone or chloroform, respectively, containing 0.25 mM of Sb-1Et. Both samples were sonicated for 5 minutes at 40% probe power amplitude. Following sonication, each mixture was transferred into a dialysis bag (Spectra/Pro, 6–8 kD) and was dialyzed for 48 hours in the respective solvent, replacing with fresh solvent three times. After dialysis, a drop of the solution was cast on a microscope slide and studied using fluorescence microscopy (for more details see S1.8 in ESI†). The same samples were used for obtaining TEM images (Fig. 9). Fluorescent microscopy images of vesicles with encapsulated Ac are shown in Fig. 9a (for RhB sample see Fig. S34†). The vesicles appear to be more worm-shaped rather than being spherical. TEM (Fig. 9b) revealed that the vesicles retain their spherical shape but have started to aggregate which gives the illusion of elongated shapes in the fluorescence microscope images.All of the dye encapsulation and dialysis experiments clearly show that the fluorescent dyes have been encapsulated into the vesicles. They can be dialysed and emit only from within the vesicles at their corresponding wavelengths. Solutions of dialyzed samples were stored and re-examined with fluorescence microscopy after 3 months and similar images were obtained indicating that the fluorescent dyes remain within the vesicles (see Fig. S35 and S38†). This suggests that the membrane both remains intact and is resistant to passive diffusion of these molecules. An additional experiment was performed with 6-carboxyfluorescein (6-FAM) dye in an acetone solution (for more details see S4.2.2 in ESI†). After dialysis, vesicles were examined via optical and fluorescent microscopy (Fig. S36†). Larger vesicles appeared translucent and emitting under blue light which confirmed successful encapsulation of 6-FAM. After collecting the images, a drop of water was cast on the vesicles in order to lyse them and changes in emission were monitored for 20 minutes. After 20 minutes it was noticeable that the number of emitting vesicles were decreasing, and the bulk solution was becoming weakly emissive. A light image was acquired after 20 minute mark and it was observed that many of the vesicles have lysed during exposure to water and started to deflate compared to the initial white light microscopy image that was captured (Fig. S37†).
Encapsulation of ferrocene provides the opportunity to probe the effect of encapsulation by these vesicles on the redox properties of ferrocene. CV (cyclic voltammetry) analysis was performed on a 0.1 M TBAPF6 (tetrabutylammonium hexafluorophosphate) chloroform solution containing Fc (1.6 mM) and Sb-1Et (0.25 mM) that were sonicated (40% power amplitude) for five minutes. After sonication, the unencapsulated Fc molecules were removed from the bulk solution via dialysis. Light microscope images were obtained at this point to confirm the presence of vesicles (Fig. S30†). After dialysis, 2 mL of this solution was diluted with 8 mL of the electrolyte solution. CV measurements were performed in triplicate and the potentials are reported relative to the Fc/Fc+ redox couple obtained from a 0.15 mM solution of Fc in 0.1 M TBAPF6 in chloroform. The half-wave potential (E1/2) for encapsulated Fc was −45 ± 2 mV vs. free Fc/Fc+ which suggests that encapsulation in vesicles of Sb-1Et facilitates the oxidation of the Fc molecules. A possible model for this behaviour is that electron rich and polarizable membrane in these pnictogen-bonded vesicles stabilizes the charged species better than the bulk solution. To ensure that the observed shift was the result of encapsulation, a mixture of a solution of Fc-containing vesicles and free Fc (0.15 mM) was prepared. The resulting half-wave potential was intermediate to free Fc and encapsulated ferrocene, indicating that both are electrochemically active and are oxidized at different potentials.
Conclusions
A new air and moisture stable bicyclic, trivalent antimony thiolate compound has been designed to engage in triple pnictogen bonding. Structural characterization revealed a self-assembled reversed bilayer. DFT calculations reveal that the directionality of the PnBs arises from electrostatic attraction, but this is reinforced by a large contribution from London dispersion forces. The self-assembly propagates in solution as well, giving rise to the spontaneous formation of hollow reversed vesicles that were demonstrated to alter the half-wave potential of encapsulated ferrocene molecules. The size distribution of these vesicles can be controlled through sonication. In chloroform, extrusion was demonstrated as an efficient method for increasing the uniformity of vesicles. The vesicles have proven to be robust enough to be used as nanocontainers for encapsulation and storage of chemicals in solid and solution states for long periods of time.Conflicts of interest
There are no conflicts to declare.Acknowledgements
AFC and SM are grateful for research funding (CHE 1847878) and instrument support (NMR, CHE 1048553 and SEM, MRI 0421032) from the National Science Foundation. SM is indebted to Spring 2019 students of CHEM-3201 and Dr Douglas Pool for the synthesis of Ac. DP would like to acknowledge support from the National Institutes of Health (GM 120669) and National Science Foundation (1849063). We would also like to show our gratitude to the Hope-Weeks and Wylie Labs in the TTU Department of Chemistry and Biochemistry.Notes and references
- K. T. Kim, S. A. Meeuwissen, R. J. M. Nolte and J. C. M. van Hest, Nanoscale, 2010, 2, 844–858 RSC.
- Medical Applications of Liposomes, 1st edn, https://www.elsevier.com/books/medical-applications-of-liposomes/lasic/978-0-444-82917-7, accessed January 9, 2020 Search PubMed.
- C. Hofmann, A. Duerkop and A. J. Baeumner, Angew. Chem., Int. Ed., 2019, 58, 12840–12860 CrossRef CAS PubMed.
- D. Grigoriev, E. Shchukina and D. G. Shchukin, Adv. Mater. Interfaces, 2017, 4, 1600318 CrossRef.
- F. Fernandez-Trillo, L. M. Grover, A. Stephenson-Brown, P. Harrison and P. M. Mendes, Angew. Chem., Int. Ed., 2017, 56, 3142–3160 CrossRef CAS PubMed.
- H. Pick, A. C. Alves and H. Vogel, Chem. Rev., 2018, 118, 8598–8654 CrossRef CAS PubMed.
- E. Rideau, R. Dimova, P. Schwille, F. R. Wurm and K. Landfester, Chem. Soc. Rev., 2018, 47, 8572–8610 RSC.
- E. Aznar, M. Oroval, L. Pascual, J. R. Murguía, R. Martínez-Máñez and F. Sancenón, Chem. Rev., 2016, 116, 561–718 CrossRef CAS PubMed.
- R. P. Brinkhuis, F. P. J. T. Rutjes and J. C. M. van Hest, Polym. Chem., 2011, 2, 1449–1462 RSC.
- J. Gaitzsch, X. Huang and B. Voit, Chem. Rev., 2016, 116, 1053–1093 CrossRef CAS PubMed.
- D. E. Discher and A. Eisenberg, Science, 2002, 297, 967–973 CrossRef CAS PubMed.
- T. Owen and A. Butler, Coord. Chem. Rev., 2011, 255, 678–687 CrossRef CAS PubMed.
- J. Voskuhl and B. Jan Ravoo, Chem. Soc. Rev., 2009, 38, 495–505 RSC.
- T. Nishimura, S. Hirose, Y. Sasaki and K. Akiyoshi, J. Am. Chem. Soc., 2020, 142, 154–161 CrossRef CAS PubMed.
- Y. Zhu, P. Yin, F. Xiao, D. Li, E. Bitterlich, Z. Xiao, J. Zhang, J. Hao, T. Liu, Y. Wang and Y. Wei, J. Am. Chem. Soc., 2013, 135, 17155–17160 CrossRef CAS PubMed.
- F. Tosi, M. C. A. Stuart, S. J. Wezenberg and B. L. Feringa, Angew. Chem., Int. Ed., 2019, 58, 14935–14939 CrossRef CAS PubMed.
- Synthetic Surfactant Vesicles, https://www.crcpress.com/Synthetic-Surfactant-Vesicles-Niosomes-and-Other-Non-Phospholipid-Vesicular/Uchegbu/p/book/9789058230119, accessed January 9, 2020 Search PubMed.
- P. Walde, K. Cosentino, H. Engel and P. Stano, ChemBioChem, 2010, 11, 848–865 CrossRef CAS PubMed.
- V. Percec, D. A. Wilson, P. Leowanawat, C. J. Wilson, A. D. Hughes, M. S. Kaucher, D. A. Hammer, D. H. Levine, A. J. Kim, F. S. Bates, K. P. Davis, T. P. Lodge, M. L. Klein, R. H. DeVane, E. Aqad, B. M. Rosen, A. O. Argintaru, M. J. Sienkowska, K. Rissanen, S. Nummelin and J. Ropponen, Science, 2010, 328, 1009–1014 CrossRef CAS PubMed.
- S. E. Sherman, Q. Xiao and V. Percec, Chem. Rev., 2017, 117, 6538–6631 CrossRef CAS PubMed.
- P. Torre, Q. Xiao, I. Buzzacchera, S. E. Sherman, K. Rahimi, N. Y. Kostina, C. Rodriguez-Emmenegger, M. Möller, C. J. Wilson, M. L. Klein, M. C. Good and V. Percec, Proc. Natl. Acad. Sci. U. S. A., 2019, 116, 15378–15385 CrossRef CAS PubMed.
- X.-N. Xu, L. Wang and Z.-T. Li, Chem. Commun., 2009, 6634–6636 RSC.
- M. R. Molla and S. Ghosh, Chem.–Eur. J., 2012, 18, 9860–9869 CrossRef CAS PubMed.
- S. Moaven, J. Yu, M. Vega, D. K. Unruh and A. F. Cozzolino, Chem. Commun., 2018, 54, 8849–8852 RSC.
- S. Moaven, J. Yu, J. Yasin, D. K. Unruh and A. F. Cozzolino, Inorg. Chem., 2017, 56, 8372–8380 CrossRef CAS PubMed.
- S. C. Grund, K. Hanusch, H. J. Breunig and H. U. Wolf, Antimony and Antimony Compounds, https://onlinelibrary.wiley.com/doi/abs/10.1002/14356007.a03_055.pub2, accessed July 17, 2019 Search PubMed.
- A. Kyono, M. Kimata, M. Matsuhisa, Y. Miyashita and K. Okamoto, Phys. Chem. Miner., 2002, 29, 254–260 CrossRef CAS.
- V. M. Cangelosi, M. A. Pitt, W. J. Vickaryous, C. A. Allen, L. N. Zakharov and D. W. Johnson, Cryst. Growth Des., 2010, 10, 3531–3536 CrossRef CAS.
- E. Block, G. Ofori-Okai, H. Kang, J. Wu and J. Zubieta, Inorg. Chem., 1991, 30, 4784–4788 CrossRef CAS.
- V. M. Cangelosi, L. N. Zakharov and D. W. Johnson, Angew. Chem., Int. Ed., 2010, 49, 1248–1251 CrossRef CAS PubMed.
- S. A. Fontenot, V. M. Cangelosi, M. A. W. Pitt, A. C. Sather, L. N. Zakharov, O. B. Berryman and D. W. Johnson, Dalton Trans., 2011, 40, 12125–12131 RSC.
- S. K. Hadjikakou, C. D. Antoniadis, N. Hadjiliadis, M. Kubicki, J. Binolis, S. Karkabounas and K. Charalabopoulos, Inorg. Chim. Acta, 2005, 358, 2861–2866 CrossRef CAS.
- B. Cordero, V. Gómez, A. E. Platero-Prats, M. Revés, J. Echeverría, E. Cremades, F. Barragán and S. Alvarez, Dalton Trans., 2008, 2832–2838 RSC.
- C. Burschka, Z. Anorg. Allg. Chem., 1978, 446, 185–192 CrossRef CAS.
- A. J. DeGraffenreid, Y. Feng, C. L. Barnes, A. R. Ketring, C. S. Cutler and S. S. Jurisson, Nucl. Med. Biol., 2016, 43, 288–295 CrossRef CAS PubMed.
- H. J. Trubenstein, S. Moaven, M. Vega, D. K. Unruh and A. F. Cozzolino, New J. Chem., 2019, 43, 14305–14312 RSC.
- A. Bauzá, T. J. Mooibroek and A. Frontera, ChemPhysChem, 2016, 17, 1608–1614 CrossRef PubMed.
- S. Benz, A. I. Poblador-Bahamonde, N. Low-Ders and S. Matile, Angew. Chem., Int. Ed., 2018, 57, 5408–5412 CrossRef CAS PubMed.
- A. F. Cozzolino, P. J. W. Elder, L. M. Lee and I. Vargas-Baca, Can. J. Chem., 2013, 91, 338–347 CrossRef CAS.
- L. Vogel, P. Wonner and S. M. Huber, Angew. Chem., Int. Ed., 2019, 58, 1880–1891 CrossRef CAS PubMed.
- M. Erdélyi, Chem. Soc. Rev., 2012, 41, 3547–3557 RSC.
- L. P. Wolters, P. Schyman, M. J. Pavan, W. L. Jorgensen, F. M. Bickelhaupt and S. Kozuch, Wiley Interdiscip. Rev.: Comput. Mol. Sci., 2014, 4, 523–540 CAS.
- T. Brinck, J. S. Murray and P. Politzer, Int. J. Quantum Chem., 1992, 44, 57–64 CrossRef.
- T. Clark, M. Hennemann, J. S. Murray and P. Politzer, J. Mol. Model., 2007, 13, 291–296 CrossRef CAS PubMed.
- L. C. Gilday, S. W. Robinson, T. A. Barendt, M. J. Langton, B. R. Mullaney and P. D. Beer, Chem. Rev., 2015, 115, 7118–7195 CrossRef CAS PubMed.
- P. Metrangolo, H. Neukirch, T. Pilati and G. Resnati, Acc. Chem. Res., 2005, 38, 386–395 CrossRef CAS PubMed.
- M. Michalczyk, W. Zierkiewicz, R. Wysokiński and S. Scheiner, Molecules, 2019, 24, 3329 CrossRef CAS PubMed.
- A. Bauzá, S. K. Seth and A. Frontera, Coord. Chem. Rev., 2019, 384, 107–125 CrossRef.
- J.-W. Zou, Y.-X. Lu, Q.-S. Yu, H.-X. Zhang and Y.-J. Jiang, Chin. J. Chem., 2006, 24, 1709–1715 CrossRef CAS.
- S. Grimme, J. Antony, S. Ehrlich and H. Krieg, J. Chem. Phys., 2010, 132, 154104 CrossRef.
- S. Goodrich, M. Patel and Z. R. Woydziak, J. Chem. Educ., 2015, 92, 1221–1225 CrossRef CAS PubMed.
Footnote |
| † Electronic supplementary information (ESI) available: Synthesis and preparation of materials and vesicles, 1H NMR, 13C NMR, ATR-FTIR, DLS, TEM, SEM, fluorescence microscopy. Cartesian coordinates of optimized molecules. CCDC 1976847. For ESI and crystallographic data in CIF or other electronic format see DOI: 10.1039/d0sc00206b |
| This journal is © The Royal Society of Chemistry 2020 |

