 Open Access Article
An interparticle relatively motional DNA walker and its sensing application†
Hong
Zhang
,
Xiaowen
Xu
* and
Wei
Jiang
 *
*
School of Chemistry and Chemical Engineering, Shandong University, 250100 Jinan, P. R. China. E-mail: xuxw@sdu.edu.cn; wjiang@sdu.edu.cn
First published on 30th June 2020
Abstract
DNA molecular machines are DNA self-assemblies that perform quasi-mechanical movement at the micro–nano scale, and have attracted increasing attention in the fields of biosensing, drug delivery and biocomputing. Herein, we report the concept and operation of an interparticle relatively motional DNA walker. The walker is composed of walking particles (WPs) and track particles (TPs). The WPs and TPs are obtained by respective functionalization of locked walking strands containing DNAzyme sequences and fluorophore-labelled track strands containing substrate sequences onto gold nanoparticles (AuNPs). Triggered by the target that specifically unlocks the walking strand, the liberated walking strands cooperatively hybridize with the track strands. The track strand gets cleaved by the DNAzyme, accompanied by the fluorophore release. The adjacent walking strand on the WP subsequently hybridizes to the next track strand, inducing the relative motion of the WP around the TP. After walking along the surface of one TP, the WP can continue to interact with another TP. As a result of the improved moving freedom and area, the interparticle motional mode induces high continuity and achieves large signal accumulation. Taking Zika virus RNA fragments (ZIKV-RNA) as a model target, the DNA walker shows a high sensitivity with a detection limit of 118 pM, and can reliably detect the target in biological fluids due to the stability of its components. The constructed DNA walker provides a new type of free and robust motion mode between particles and holds potential in clinical diagnosis.
Introduction
Synthetic molecular machines are artificially designed self-assemblies that perform quasi-mechanical movement at the micro–nano scale under appropriate external stimuli.1–4 Among classes of building materials, DNA is considered to be an ideal candidate due to its precise base pairing, sequence programmability, structural controllability, and facile synthesis and modification.5–8 DNA walkers are a kind of DNA molecular machine in which the component nucleic acids can move autonomously and progressively along the predetermined track.9 Their features include self-directed movement and integration of repetitive stepping. Especially, if each stepping generates a signal, the DNA walker can accumulate copies of signals during the walking process and is endowed with intrinsic signal amplification capability. DNA walkers have evolved from walking on the one-dimensional (1-D) linear track10–12 to the two-dimensional (2-D) planar track13–16 and then to the three-dimensional (3-D) spherical track.17–25 Compared with 1-D and 2-D DNA walkers, 3-D DNA walkers have better amplification performance and DNA enrichment capacity, as a result of large surface-to-volume ratio of particles and the high DNA loading density on the 3-D material.22 3-D DNA walkers have shown emerging and attractive applications in bioanalysis including nucleic acid testing,17–20,24 protein detection20,22,24 or cellular imaging and analysis.21Generally, the constructed 3-D DNA walkers can be divided into two types; fixed DNA walkers17–22 and free DNA walkers.23–25 For fixed DNA walkers, typically one end of the walking strand is fixed on the surface of the particle. The walking strands and track strands are modified on the same particle in such types of DNA walkers. The movement of the walking strand is confined to the particle surface, and the walking strands can only swing near the foothold due to the strand length restriction, so the walking area of this type of DNA walker may be limited. For free DNA walkers, typically, a free single or bipedal walking strand walks along the surface of the track strand-functionalized particle. During the operation, the walking strand may deviate from the track to suspend stepping before it can be stably reconnected to a new DNA track. Overall, for the two types of DNA walkers, the walking behaviour is manifested to be the movement of a single-stranded or complexed DNA within the particle, which is liable to be confronted with a limited walking area or probable derailment, thus limiting the biosensing analysis of DNA walkers in terms of signal amplification.
Herein, we design a new type of interparticle relatively motional DNA walker, in which one kind of DNA-functionalized particle moves around the other. The locked walking strands containing DNAzyme sequences and the fluorophore-labelled track strands containing substrate sequences are respectively functionalized onto AuNPs to form walking particles (WPs) and track particles (TPs). In the presence of the target stimulus, the walking strands get unblocked and cooperatively hybridize with the track strands, inducing the landing of WPs on TPs. The track strand is then cleaved by the walking strand via the DNAzyme-induced ribonucleotide hydrolysis, along with the release of the fluorophore and fluorescence enhancement. Meanwhile, the adjacent walking strand can bind to the next track strand, initiating the relative motion of WPs to TPs. Until the consumption of most track strands on the TP surface, WP would dissociate from the TP and interact with new TPs. During the operation of the DNA walker, the multipedal walking strands on the WP cooperatively combine with the track strands, which are stable and not easy to derail. Through the continuous interaction between the WP and the TP, the DNA walker reveals sustainable operation and achieves large signal accumulation. The DNA walker shows a good detection performance by taking Zika virus RNA fragments (ZIKV-RNA) as a model target, including high sensitivity, high specificity and good recovery in a complex matrix assay, and will provide a promising analytical tool in diagnosis.
Results and discussion
Principle of the interparticle relatively motional DNA walker
The construction and operation of the DNA walker are illustrated in Scheme 1. The DNA walker is composed of two kinds of DNA-functionalized AuNPs, locked walking strand-functionalized AuNPs denoted as WPs and track strand-functionalized AuNPs denoted as TPs. The walking strands contain 8–17E DNAzyme sequences that are single strand DNA fragments with high catalytic activity and structure recognition ability. The locking strands are hybridized with the walking strands and meanwhile contain complementary sequences to the target. The track strands contain DNA–RNA chimeric substrate sequences and are labelled with fluorescent dye Carboxyfluorescein (FAM) that is initially quenched by the AuNPs. In the presence of the target sequence, the locking strand will be displaced via the strand displacement reaction and the walking strand will be liberated. Then, the liberated walking strands on the WP can cooperatively hybridize with the track strands on the TP. The track strand gets cleaved by the DNAzyme sequence by taking Mg2+ as a cofactor, and the fluorophore is released from the AuNP surface to generate enhanced fluorescence. The adjacent walking strand further hybridizes with the next track strand on the TP, inducing the relative motion of the WP around the TP as well as the step-by-step cleavage of track strands. After the movement of the WP along the surface of one TP, it can continue to interact with another TP, releasing abundant fluorophores and generating large signal accumulation. However, when the target is absent, the DNAzyme sequence on the walking strand is blocked, and thus its hybridization and catalytic action to track strands are inhibited. The DNA walker cannot be initiated and merely a weak background signal is obtained.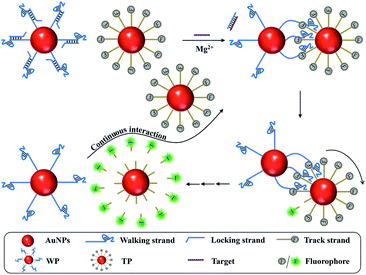 | ||
| Scheme 1 Schematic illustration of the interparticle relatively motional DNA walker triggered by the target. | ||
Feasibility study of the interparticle relatively motional DNA walker
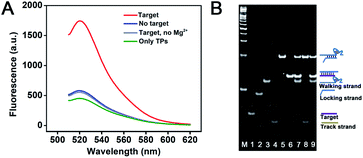
AuNPs were synthesized and characterized with a diameter of approximately 13 nm (Fig. S1†). To test the amount of DNA strands on the AuNP and the operation of the interparticle relatively motional DNA walker, fluorescence characterization was performed. Through the DTT displacement method, the amounts of walking strands and track strands modified on each WP and TP are determined to be 21 and 88 strands, respectively (Fig. S2†). The difference between the amounts of DNA on AuNPs is due to the different lengths between walking strands and track strands. This also indicates that WPs have multipedal walking strands and TPs can offer high-density 3-D tracks. As shown in Fig. 1A, in the presence of the target sequence, a significantly enhanced fluorescence signal is obtained. This suggests that the target sequence can hybridize with the locking strand, leading to the exposure of the DNAzyme sequence and the initiation of the DNA walker. In contrast, in the absence of the target sequence, merely a weak fluorescence signal is obtained, which indicates that the DNAzyme sequence is blocked and cannot trigger the DNA walker movement. In control experiments, a weak fluorescence signal is obtained if WPs are excluded, indicating that the formed track on TPs is stable unless its accommodation of WPs for walking and cleavage. Also, almost identical fluorescence intensity to the background is obtained if Mg2+ is excluded, suggesting that WPs cannot walk around TPs due to the lack of the cofactor for the DNAzyme cleavage reaction, or the disrupted hybridization between the WP and TP due to the weakened stability of the walking strand/track strand duplex. Especially, if the WP concentration is reduced to half, a similar fluorescence signal level can be obtained by elongating the operation time from 2.5 h to 6 h (Fig. S3†). This suggests the relative motion between the WP and the TP, which enables that the similar surface area of TPs can be interacted by WPs in spite of the decreased amount of WPs. The reaction was further characterized by non-denaturing polyacrylamide gel electrophoresis (PAGE). As seen in Fig. 1B, in comparison with the individual DNA marker from lane 1 to 6, it can be concluded from lane 7 that a strand displacement reaction occurs between the target and the locked walking strand. The target hybridizes with the locking strand to form a duplex, accompanied by the walking strand release. When the target sequence is absent, the band corresponding to the track strands is observed (lane 8). This suggests that the DNAzyme sequence on the walking strand is sealed by the locking strand and cannot trigger the cleavage reaction. When the target sequence is present, the band corresponding to the track strand is diminished (lane 9), indicating its cleavage by the walking strand and the walker's initiation by the target.During the operation of the DNA walker, the reaction solution was pipetted out at different time points for TEM characterization. As shown in Fig. 2, WPs and TPs remain dispersed at the beginning of the reaction (0 h). With the progress of the operation (0.5 to 1.5 h), the nanoparticles start to approach each other, and are mostly collected in dimers, less in trimers or few numbers of nanoparticles. This indicates the specific interaction between the WP and TP, resulting from the base complementarity between the walking strands on the WP and track strands on the TP. Until the end of the reaction (2.0 to 2.5 h), the nanoparticles gradually get dispersed again, suggesting that the interaction between the WP and TP is diminished and the relative motion is almost finished, due to the consumption of the majority of track strands on the TP. A similar trend can also be observed if a 20 nm TP is utilized, which allows one to distinguish WPs and TPs clearly and better exclude the possibility of the gathered particles composed of only WPs or only TPs (Fig. S4†). Meanwhile, time-dependent UV-vis spectra show neither red shift of the absorption peak nor new absorption bands at longer wavelengths (Fig. S5†), indicating that aggregation of AuNPs can hardly form during the operation and excluding the possibility of formation of large WP–TP aggregates cross-linked by the hybridization of walking strands and track strands. All results testify the operation feasibility of the designed DNA walker.
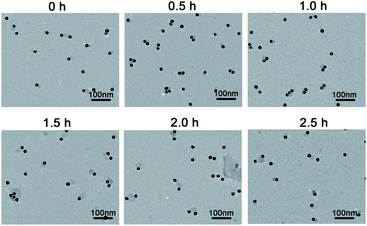 | ||
| Fig. 2 TEM image of the interparticle relatively motional DNA walker consisted of 13 nm WPs (0.2 nM) and 13 nm TPs (1.0 nM) at different reaction time points. | ||
To improve the operation performance of the interparticle relatively motional DNA walker, the reaction conditions were optimized, including the concentration ratio between WPs and TPs, the pH, the salt concentration, and the operation time (see Fig. S6† for details). The value of F/F0 was adopted to appraise the performance of the DNA walker, where F and F0 were fluorescence signal responses of this DNA walker in the presence and absence of the target sequence, respectively. The goal of optimization is to improve the F/F0, and finally obtain the best operation performance of the DNA walker. After optimization, the optimal ratio of WPs to TPs is 1![[thin space (1/6-em)]](https://www.rsc.org/images/entities/char_2009.gif) :
:![[thin space (1/6-em)]](https://www.rsc.org/images/entities/char_2009.gif) 5, and the best pH value is 8.3. The appropriate concentrations for NaCl and Mg2+ are 175 mM and 10 mM respectively, and the best operation time is 2.5 h. The following investigation is carried out under these optimal experimental conditions.
5, and the best pH value is 8.3. The appropriate concentrations for NaCl and Mg2+ are 175 mM and 10 mM respectively, and the best operation time is 2.5 h. The following investigation is carried out under these optimal experimental conditions.
Investigation of cooperative binding of walking strands to the TP
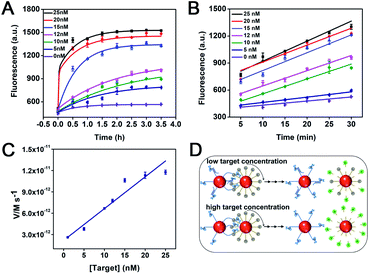
To better assess the impact of multipedal walking strands of the WP on walker performance, time-dependent fluorescence changes of the DNA walker to different concentrations of target were studied. As illustrated in Fig. 3A, the fluorescence intensity is enhanced with the target concentration from 0 nM to 25 nM as the reaction time increases. The fluorescence changes show a rapid growth in the first 30 min of reaction, followed by a slow growth (0.5–2.5 h), and eventually tend to be stable (2.5–3.5 h). This is due to the fact that the walking strands interact with a large number of track strands on the TP at the beginning, so it exhibits an obvious fluorescence enhancement in the first 30 min. As the DNA walker operates from 0.5 h to 2.5 h, the number of track strands on TPs and the walking area are gradually reduced, so the fluorescence increase is slowed down. When the track strands tend to be exhausted, the fluorescence change does not show a further increase after 2.5 h. A good linear relationship is obtained through plotting the fluorescence intensities at five-minute intervals in the first 30 min of the reaction (Fig. 3B). As the target concentration increases, the fluorescence intensity generated by the walker increases linearly. The initial reaction rates of the DNA walker, equalling to the release rates of track strands,17 are determined by calculating the concentration of the track strands consumed per unit time in the first 30 min (Fig. 3C). Within the first 30 min of the reaction, the initial reaction rates of the DNA walker (V) are linearly dependent on the concentration of the target throughout the range tested (5 to 25 nM). This is because the amount of liberated walking strands on the WP increases as the concentration of the target increases, and the cooperative binding ability of multipedal walking strands to the track is enhanced. Fig. 3D illustrates the case of the DNA walker responding to a low or high concentration of target. When the target concentration is low, the presence of locked walking strands that otherwise are liberated at high concentration of target poses a barrier for the hybridization of adjacent liberated walking strands to the track, which causes a lagging movement. When the target concentration is high, the increased amount of liberated walking strands on the WP will be more liable to bind the remaining track on TPs considering the consumption of the track. This induces increasingly stable stepping of WPs around TPs, generating gradually enhanced fluorescence accumulation along with the increasing concentration of the target.Investigation of the sustainability of the interparticle relatively motional DNA walker
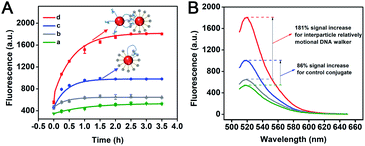
In order to verify the continuous walking ability, time-dependent fluorescence changes of the interparticle relatively motional DNA walker and its control conjugate were recorded under the optimal experimental conditions. The control DNA–AuNP conjugate is obtained by simultaneously modifying locked walking strands and track strands onto the same AuNPs with an identical DNA ratio in the interparticle relatively motional DNA walker, in which the track strand concentration is maintained the same as that for TP modification. The results are shown in Fig. 4A. The interparticle relatively motional DNA walker demonstrates a speedy and intense fluorescence signal growth (red curve). For comparison, the control DNA–AuNP conjugate exhibits a slowly growing fluorescent signal (blue curve). Moreover, the reaction rate of the interparticle relatively motional DNA walker (1.21 × 10⁻¹¹ M s−1) is 2-fold higher than that of the control DNA–AuNP conjugate (5.91 × 10⁻¹² M s−1), which means that the interparticle relatively motional DNA walker has an accelerated walking speed (Fig. S7†). When the reaction is about 1 h, there is no significant fluorescence increase in the control DNA–AuNP conjugate, while the interparticle relatively motional DNA walker still shows a continuously growing fluorescence signal until 2.5 h, which demonstrates that the constructed DNA walker holds good sustainability. According to Fig. 4B, the signal accumulation degree of two types of the walking mode can be intuitively compared from the fluorescence spectrum that reaches saturation. A 2.1-fold cumulative signal increase is obtained in the interparticle relatively motional DNA walker in comparison to the control DNA–AuNP conjugate. The signal accumulation of the interparticle relatively motional DNA walker is also superior to that of two other control systems: the control molecular beacon composed of DNAzyme strands and substrate strands, and the control nanoprobe composed of free DNAzyme strands and track strand-functionalized AuNPs. Under their respective optimal reaction conditions (Fig. S8 and S9†), the interparticle relatively motional DNA walker shows an obvious higher fluorescence increase when detecting the same concentration of target (Fig. S10†).According to the corresponding fluorescence intensity and the standard curve of FAM-labelled track strands, we calculate the concentration of released track strands during the operation of the DNA walker, and further calculate the percentage of the amount of released track strands to that of the total track strands on the TPs. It is calculated that the operation process of the interparticle relatively motional DNA walker has 52% of the track strands released, and the model diagram of the operation process is shown in Fig. 5A. The control DNA–AuNP conjugate has 31% of the track strands released, and the model diagram of the operation process is shown in Fig. 5B. This is attributed to the fact that the cooperative hybridization of multipedal walking strands on the WP to the track results in enhanced binding affinity and freely continuous stepping forward of the WP along the TP, so the walking area of the interparticle relatively motional DNA walker is expanded, which achieves enhanced fluorescent signals. To validate the relative motion of the WP along the TP rather than the simultaneous hybridization of multiple TPs to the WP, the percentage of track strand release is compared. The model of simultaneous hybridization of multiple TPs to the WP is constructed under the optimal experimental conditions with the ratio of WP to TP of 1![[thin space (1/6-em)]](https://www.rsc.org/images/entities/char_2009.gif) :
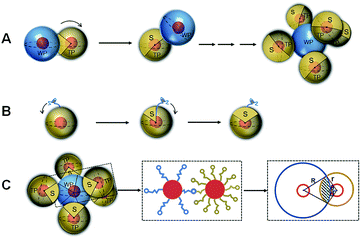
:![[thin space (1/6-em)]](https://www.rsc.org/images/entities/char_2009.gif) 5 (Fig. 5C). The overlap model of the interaction between the WP and the TP in the middle of Fig. 5C is built according to the literature,26–28 in which the complementary regions between walking strands and track strands are represented by the point-like sticky end. We further obtain the overlap model in the right diagram of Fig. 5C, in which the distance between the two surfaces of the WP and TP is equal to the length of the track strand. The size of the overlap model is calculated based on the distance between adjacent base pair planes of DNA (0.34 nm) and the size of AuNPs (13 nm). The percentage of track strand release is represented by n and calculated using eqn (1):
5 (Fig. 5C). The overlap model of the interaction between the WP and the TP in the middle of Fig. 5C is built according to the literature,26–28 in which the complementary regions between walking strands and track strands are represented by the point-like sticky end. We further obtain the overlap model in the right diagram of Fig. 5C, in which the distance between the two surfaces of the WP and TP is equal to the length of the track strand. The size of the overlap model is calculated based on the distance between adjacent base pair planes of DNA (0.34 nm) and the size of AuNPs (13 nm). The percentage of track strand release is represented by n and calculated using eqn (1):
 | (1) |
In eqn (1), S is the accessible track area, and STPs is the total area of TPs. The ratio of area in eqn (1) can be transformed into the ratio of angle and expressed as eqn (2):
 | (2) |
In eqn (2), θ is the angle between the two radii on the TP circle and can be calculated using eqn (3):
 | (3) |
In eqn (3), d is the distance from the center of the TP circle to the corresponding common chord length in the overlapping area, and can be calculated according to the two circle equations (Fig. S11†); r is the radii of TP. The calculation formula of θ can be expressed as eqn (4):
 | (4) |
Combining eqn (4) with (1) and (2), the calculation formula of n is expressed as eqn (5):
 | (5) |
Thus n is calculated as 30.2% using eqn (5). Obviously, the value is far less than 52% of track strand release obtained from the experiment. Therefore, the operation process of the DNA walker is conducted by the relative movement of the WP along the TP rather than the cross-linking of multiple TPs with the WP.
Effect of TP sizes on the operation of the interparticle relatively motional DNA walker
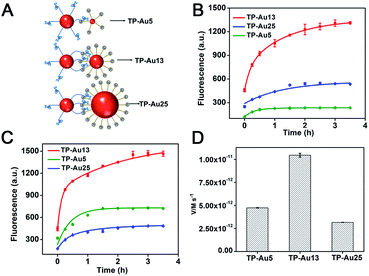
We then investigated the effect of AuNP size change of TPs on the operation performance of the DNA walker. First, the track strands were modified on AuNPs of different sizes (5 nm, 13 nm and 25 nm), in which 5 nm and 25 nm AuNPs were characterized using a UV-vis spectrometer and TEM (Fig. S12†), and TP-5 nm AuNPs (TP-Au5), TP-13 nm AuNPs (TP-Au13) and TP-25 nm AuNPs (TP-Au25) were obtained. The amount of track strands on each TP-Au5 and TP-Au25 is determined to be 17 and 185 strands, respectively (Fig. S13†). The hydrodynamic diameters of TP-Au5, TP-Au13, TP-Au25 and WP are 26.0 nm, 37.8 nm, 32.2 nm and 43.8 nm, as characterized by DLS (Fig. S14†). Among them, although the diameter of AuNPs in TP-Au25 is large, the track strands exhibit a “lying-down” conformation on TP-Au25. This may be due to the difference of the surface density for track strands on AuNPs. The surface density for track strands on TP-Au25 (9.4 × 10¹²/cm2) is much smaller than that for track strands on TP-Au13 (1.7 × 10¹³/cm2), accounting for the “lying-down” conformation and smaller hydrodynamic diameter of TP-Au25. As shown in Fig. 6B, in the case of the same concentration of TPs, the size changes of the TP affect the output value of fluorescence intensity of the DNA walker. By regarding WPs and TPs as two collision particles, these could be explained by the difference in collision efficiency between WPs and TPs of different sizes. The collision efficiency for particles of different sizes is smaller than that for particles of the same particle size, and a larger radius ratio of the two collision particles can lead to a smaller collision efficiency.29 The radius ratios of two particles (RWP/RTP) in TP-Au5, TP-Au13 and TP-Au25 are 1.68, 1.15 and 1.36, respectively. The combination of WPs and different sizes of TPs is shown in Fig. 6A. When TP-Au13 is utilized in the reaction system, the WPs and TPs in the DNA walker system have an approximate particle size, and the highest fluorescence increase is obtained. When TP-Au5 and TP-Au25 exist in the system, the difference in particle size between the WPs and TPs is large, so the collision efficiency is reduced. The radius ratio of WPs to TPs in the TP-Au5 system is larger than that in the TP-Au25 system, and the number of track strands on TP-Au5 is smallest, so TP-Au5 shows the lowest fluorescence signal.We further tested which size of TPs is favorable for distribution of the track strands of the same amount for the effective operation of the DNA walker. To maintain the same track strand concentration, the molar ratios of WPs to TP-Au5, TP-Au13 and TP-Au25 in the reaction solution are adjusted at 1![[thin space (1/6-em)]](https://www.rsc.org/images/entities/char_2009.gif) :
:![[thin space (1/6-em)]](https://www.rsc.org/images/entities/char_2009.gif) 25.8, 1
25.8, 1![[thin space (1/6-em)]](https://www.rsc.org/images/entities/char_2009.gif) :
:![[thin space (1/6-em)]](https://www.rsc.org/images/entities/char_2009.gif) 5 and 1
5 and 1![[thin space (1/6-em)]](https://www.rsc.org/images/entities/char_2009.gif) :
:![[thin space (1/6-em)]](https://www.rsc.org/images/entities/char_2009.gif) 2.3, respectively. As shown in Fig. 6C, the TP-Au13 shows the fastest signal growth and obtains the highest fluorescence intensity, because the WPs and TP-Au13 in the reaction solution have an approximate particle size. Although the collision efficiency between the WPs and TPs in the TP-Au5 reaction solution is generally weaker than that of TP-Au25, the concentration of TP-Au5 is higher, so the number of TP-Au5 that can be contacted by the WP increases. And the DNA strand on TP-Au5 has an up-right conformation compared with TP-Au25, which promotes the cooperative hybridization of the WP to the track, thereby producing an accelerated reaction rate and enhancing the fluorescence signal (Fig. 6D). The results demonstrate that arranging the track strands on the surface of TPs approximated to the size of the WPs is beneficial to improving the walking speed and signal accumulation of the interparticle relatively motional DNA walker.
2.3, respectively. As shown in Fig. 6C, the TP-Au13 shows the fastest signal growth and obtains the highest fluorescence intensity, because the WPs and TP-Au13 in the reaction solution have an approximate particle size. Although the collision efficiency between the WPs and TPs in the TP-Au5 reaction solution is generally weaker than that of TP-Au25, the concentration of TP-Au5 is higher, so the number of TP-Au5 that can be contacted by the WP increases. And the DNA strand on TP-Au5 has an up-right conformation compared with TP-Au25, which promotes the cooperative hybridization of the WP to the track, thereby producing an accelerated reaction rate and enhancing the fluorescence signal (Fig. 6D). The results demonstrate that arranging the track strands on the surface of TPs approximated to the size of the WPs is beneficial to improving the walking speed and signal accumulation of the interparticle relatively motional DNA walker.
Detection performance of the interparticle relatively motional DNA walker
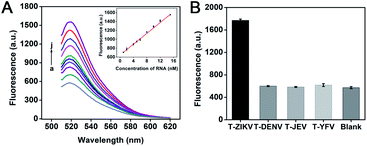
Zika virus (ZIKV) is a single-stranded positive-strand RNA virus belonging to the Flaviviridae family.30,31 ZIKV-infected diseases pose a huge threat to global human health due to their high morbidity and mortality, and so far there are no effective drugs or licensed vaccines.32,33 The key to pathogenic virus detection is high sensitivity, and early discovery and detection can assist to heighten the survival rate. Various concentrations of ZIKV-RNA were detected under the optimal experiment conditions to test the detection performance of the DNA walker. The fluorescence intensity gradually enhances as the ZIKV-RNA concentration increases (Fig. 7A). The calibration curves in the inset suggested that the estimated limit of detection (LOD) is 118 pM according to the principle of three times standard deviation (LOD = 3σ/K, where σ is the standard deviation of the blank parallel determinations, K is the slope of the calibration curve), which indicates that the proposed DNA walker has better sensitivity than some reported analysis strategies toward ZIKV related nucleic acid sequences (Table S1†). Fluorescence intensity displays a good linear relationship with the concentration of ZIKV-RNA within the range from 1 nM to 15 nM. And the correlation coefficient obtained from the linear equation indicates a good correlation at the tested concentrations of ZIKV-RNA.To investigate the specificity of the DNA walker, the RNA sequences of the target ZIKV (T-ZIKV), dengue virus (T-DENV), Japanese encephalitis virus (T-JEV) and yellow fever virus (T-YFV) were compared under the same experimental conditions. All of the four viruses are single-stranded RNA viruses belonging to the Flavivirus genus of the family Flaviviridae that have similar clinical symptoms. It can be seen that only the target RNA sequence causes significant fluorescence enhancement, while the RNA sequences of other similar viruses only cause fluorescent signals similar to the blank (Fig. 7B). This result suggests that the DNA walker has good specificity for the detection of ZIKV-RNA.
Analysis in complex biological samples
To evaluate the practical application of the interparticle relatively motional DNA walker in complex biological samples, the human serum was used as the complex system for recovery experiments. Different concentrations of ZIKV-RNA were added to human serum. The samples were tested by the DNA walker, and the spiked recoveries of ZIKV-RNA in human serum were determined. The spiked recoveries of ZIKV-RNA from the human serum are in the range from 97.5% to 103.5% (Table S2†), indicating that the DNA walker can effectively resist the interference of complex components coexisting in human serum. The good anti-interference ability should come from the stability of WPs and TPs in the reaction system. The AuNPs of WPs and TPs have a strong spatial effect and high ionic charge, which can be used to effectively stabilize DNA.34 In contrast, the two control systems generally show signal variation when applied in target detection in serum (Fig. S15†), mainly due to the degradation of the doubly-labelled substrate strands or the instability of un-immobilized locked DNAzyme. The results also demonstrate that the DNA walker has a potential application in real biological sample analysis. Although ZIKV-RNA is taken as a model target, the potential analytes can be expanded to small molecules and proteins by substituting the aptamer sequence for the RNA-complementary sequence in the locking strand.Conclusion
In summary, we have demonstrated the design and operation of an interparticle relatively motional DNA walker. First, the DNA walker is composed of WPs and TPs, and the operation is realized by conducting the relative motion of the WP around the TP under the stimulation of the specific target. Second, due to the cooperative binding of multipedal walking strands to the track and freely continuous walking of the WP along TPs, the walking affinity is enhanced, and the walking freedom and area are improved. Third, the DNA walker possesses large signal accumulation and anti-interference ability, and further achieves sensitive determination of ZIKV-RNA in the complex matrix. Such a new type of DNA walker should be promising in sensitive detection of biomolecules and real sample analysis. Besides, the construction of a DNA molecular machine based on separate components may provide new tools for the regulation of particle motion that is liable to suffer photoinduced damage by some physical methods35 and the study of interaction between surface-immobilized molecules.Experimental section
Materials and reagents
Chloroauric acid (HAuCl4·3H2O), trisodium citrate dihydrate (Na3C6H5O7·2H2O) and tris-(2-carboxyethyl)-phosphine (TCEP) were bought from Sigma (St. Louis, MO, USA). Tris base, boric acid, EDTA disodium salt, dithiothreitol (DTT), and the DNA and RNA sequences (Table S3†) were supplied by Sangon Biotechnology Co., Ltd. (Shanghai, China). 5 nm and 25 nm of gold nanoparticles (AuNPs) were synthesized by Nanjing Xianfeng Nanomaterials Technology Co., Ltd. (Nanjing, China). Some analytically pure chemical reagents were not required to be purified. All solutions were prepared from 0.1% DEPC water (DEPC-H2O).Instrumentation
A UV-2910 spectrometer (Hitachi, Japan) was applied to record UV-vis absorption spectra. A JSM-6700F transmission electron microscope (JEOL, Japan) was utilized to image the morphology of nanoparticles. A F-7000 fluorescence spectrometer (Hitachi, Japan) was used to test fluorescence spectra excited at 488 nm, the emission wavelength range was 510–650 nm and the slits of excitation and emission were 10 nm. The voltage of the photomultiplier was 700 V. The GelDocTM XR+ imaging apparatus (Bio-RAD Laboratories Inc., USA) was used to obtain the polyacrylamide gel image. A Zetasizer Nano ZS (Malvern, UK) was used to perform dynamic light scattering (DLS) measurements.Preparation and characterization of the interparticle relatively motional DNA walker
First, 13 nm-AuNPs were prepared following the procedure reported in the literature.36 Briefly, 5 mL of 38.8 mM trisodium citrate dihydrate was quickly added to 50 mL of boiling aqueous 1 mM HAuCl4 solution with vigorous stirring. After 10 min of continuous boiling, the mixture was stirred for another 15 min. The above solution was cooled to room temperature with slow stirring, filtered through a 0.22 μm filter and stored at 4 °C and shielded from light before use. The properties of AuNPs were characterized using a transmission electron microscope (TEM) and UV-vis spectrometer. The concentration of the synthesized 13 nm-AuNPs was determined based on the absorbance value at 519 nm and corresponding molar extinction coefficient.The DNA walker is composed of WPs and TPs. For the preparation of WPs, the walking strands and the locking strands at a mole proportion of 1![[thin space (1/6-em)]](https://www.rsc.org/images/entities/char_2009.gif) :
:![[thin space (1/6-em)]](https://www.rsc.org/images/entities/char_2009.gif) 5 were mixed with 1× Tris–HCl buffer (pH 8.3). The mixture was warmed to 90 °C and maintained for 10 min, and then it was cooled to room temperature to obtain locked walking strands. Prior to the functionalization, thiolated DNA was incubated with TCEP in a 1
5 were mixed with 1× Tris–HCl buffer (pH 8.3). The mixture was warmed to 90 °C and maintained for 10 min, and then it was cooled to room temperature to obtain locked walking strands. Prior to the functionalization, thiolated DNA was incubated with TCEP in a 1![[thin space (1/6-em)]](https://www.rsc.org/images/entities/char_2009.gif) :
:![[thin space (1/6-em)]](https://www.rsc.org/images/entities/char_2009.gif) 100 molar ratio for 2 h to reduce the disulfide bond of DNA. Next, a mixture containing 50 μL of 30 μM locked walking strands and 1 mL of 10 nM AuNPs was stirred slowly for 16 h. 100 μL of 2 M NaCl was then gradually added to the above mixture six times at intervals of 40 min. After incubation for an additional 24 h, the solution was centrifuged at 12
100 molar ratio for 2 h to reduce the disulfide bond of DNA. Next, a mixture containing 50 μL of 30 μM locked walking strands and 1 mL of 10 nM AuNPs was stirred slowly for 16 h. 100 μL of 2 M NaCl was then gradually added to the above mixture six times at intervals of 40 min. After incubation for an additional 24 h, the solution was centrifuged at 12![[thin space (1/6-em)]](https://www.rsc.org/images/entities/char_2009.gif) 500 rpm for 30 min to separate WPs from the unfunctionalized DNA. WPs were washed three times by using 1× Tris–HCl buffer (pH 8.0) and dispersed in 1× Tris–HCl buffer (10 mM Tris, pH 8.3). For the preparation of TPs, a mixture containing 20 μL of 100 μM TCEP-reduced track strands and 1 mL of 10 nM AuNPs was stirred slowly for 16 h. TPs were then obtained through the same process as above, including salt addition, separation and washing. Finally, the TPs were dispersed in Tris–HCl buffer (10 mM Tris, pH 8.3). The solution was stored at 4 °C and shielded from light before use. The concentrations of WPs and TPs were determined by UV-vis spectrometry.
500 rpm for 30 min to separate WPs from the unfunctionalized DNA. WPs were washed three times by using 1× Tris–HCl buffer (pH 8.0) and dispersed in 1× Tris–HCl buffer (10 mM Tris, pH 8.3). For the preparation of TPs, a mixture containing 20 μL of 100 μM TCEP-reduced track strands and 1 mL of 10 nM AuNPs was stirred slowly for 16 h. TPs were then obtained through the same process as above, including salt addition, separation and washing. Finally, the TPs were dispersed in Tris–HCl buffer (10 mM Tris, pH 8.3). The solution was stored at 4 °C and shielded from light before use. The concentrations of WPs and TPs were determined by UV-vis spectrometry.
Determination of the amount of DNA strands on WPs and TPs
To measure the amount of DNA strands on each AuNP of WPs and TPs, the DNA strands were first released from the AuNP using the dithiothreitol (DTT) displacement method.37 The WPs and TPs were mixed with 20 mM DTT respectively and incubated overnight. The mixed solution was then centrifuged at 12![[thin space (1/6-em)]](https://www.rsc.org/images/entities/char_2009.gif) 000 rpm for 15 min to precipitate AuNPs, and the fluorescence of the supernatant was tested for the analysis of released DNA strands. The concentration of the DNA strands was measured by using fluorescence of the supernatant and the calibration curve of the fluorophore-labelled DNA strands. Finally, the amount of DNA strands per AuNP of WPs and TPs was determined by dividing the concentration of DNA strands by the concentration of AuNPs.
000 rpm for 15 min to precipitate AuNPs, and the fluorescence of the supernatant was tested for the analysis of released DNA strands. The concentration of the DNA strands was measured by using fluorescence of the supernatant and the calibration curve of the fluorophore-labelled DNA strands. Finally, the amount of DNA strands per AuNP of WPs and TPs was determined by dividing the concentration of DNA strands by the concentration of AuNPs.
Operation procedure of the interparticle relatively motional DNA walker
For a typical interparticle relatively motional DNA walker operation, firstly, 6 μL of 250 nM target sequence was added to a mixed solution containing 12 μL of 1 nM WPs, 12 μL of 5× Tris–HCl (100 mM Tris–HCl, 875 mM NaCl, pH 8.3), 12 μL of 50 mM MgCl2 and 6 μL DEPC-H2O. After incubation at 37 °C for 1.5 h to expose the liberated walking strands on WPs, 12 μL of 5 nM TPs were then added to initiate the movement of the DNA walker. The mixed solution was reacted at 37 °C for 2.5 h. After the walker's operation completed, the above solution was centrifuged at 12![[thin space (1/6-em)]](https://www.rsc.org/images/entities/char_2009.gif) 000 rpm for 15 min, and the fluorescence of the supernatant was then measured.
000 rpm for 15 min, and the fluorescence of the supernatant was then measured.
During the operation of the DNA walker, the reaction solution was pipetted out at time intervals of half an hour, added on a carbon-coated copper grid, and allowed to dry under an infrared lamp, so as to prepare the samples for TEM characterization.
For UV-vis characterization of the DNA walker's operation, the reaction solution was added into a cuvette and set in the spectrophotometer equipped with a temperature controller. Time-dependent absorption curves were recorded with time intervals of half an hour at 37 °C.
To test the signal level of the DNA walker in the case of reduced WP concentration, 6 μL of 125 nM target sequence was added to a mixed solution containing 12 μL of 0.5 nM WPs, 12 μL of 5× Tris–HCl (100 mM Tris–HCl, 875 mM NaCl, pH 8.3), 12 μL of 50 mM MgCl2 and 6 μL DEPC-H2O, followed by the same procedures in the typical interparticle relatively motional DNA walker operation. After the operation at 37 °C for 6 h, the fluorescence is measured.
Polyacrylamide gel electrophoresis analysis
The feasibility of interparticle relatively motional DNA walker operation was confirmed by using the 15% non-denaturing polyacrylamide gel electrophoresis (PAGE) experiment. 10 μL of the reaction solution containing 1 μL of locked walking strands (10 μM), 1 μL of target (10 μM), 1 μL of track strands (10 μM), 2 μL of 5× Tris–HCl (pH 8.3), 2 μL of MgCl2 (50 mM) and 3 μL DEPC-H2O was incubated at 37 °C for 1 h. Subsequently, 2 μL of 6× loading buffer was added to the above solution, and the mixture was loaded onto a 15% polyacrylamide gel for DNA with different molecular weight separation. Next, 1× TBE running buffer (89 mM Tris, 89 mM boric acid, 2 mM EDTA, pH 8.3) was used to carry the gel at 15 °C for 65 min with a 30 mA constant current. SYBR gold was then utilized to stain the gel for 40 min and imaged by the gel imaging system.Test of control systems
For the control DNA–AuNP conjugate, 20 μL of 5 μM TCEP-reduced, locked walking strands and 10 μL of 200 μM TCEP-reduced track strands were added into 1 mL of 10 nM AuNPs, followed by the salt-aging process as mentioned before. The conjugate was then washed and stored in Tris–HCl buffer (10 mM Tris, 140 mM NaCl, pH 8.3). For the test, 6 μL of 250 nM target sequence was added into a mixed solution containing 12 μL of 6 nM control conjugate, 12 μL of 5× Tris–HCl (100 mM Tris–HCl, 875 mM NaCl, pH 8.3), 12 μL of 50 mM MgCl2 and 18 μL of DEPC-H2O. The mixture was allowed to react at 37 °C for 2.5 h, followed by centrifugation and fluorescence measurements.For the control nanoprobe, 22 μL of 100 nM DNAzyme strand, 66 μL of 100 nM locking strand and 22 μL of 5× Tris–HCl buffer were mixed. The mixture was heated at 90 °C for 10 min and slowly cooled to room temperature to obtain locked DNAzyme strands. 6 μL of 250 nM target sequence was added into a mixed solution containing 12 μL of 20 nM locked DNAzyme strands, 12 μL of 5× Tris–HCl (100 mM Tris–HCl, 875 mM NaCl, pH 8.0), 12 μL of 50 mM MgCl2 and 6 μL of DEPC-H2O. After incubation at 37 °C for 1.5 h, 12 μL of 5 nM TPs was added was added and the mixture was allowed to react at 37 °C for 2.5 h. The reaction solution was centrifuged and the fluorescence of the supernatant was measured.
For the control molecular beacon, 5 μL of 250 nM target sequence was added into a mixed solution containing 10 μL of 20 nM locked DNAzyme strands, 10 μL of 5× Tris–HCl (100 mM Tris–HCl, 750 mM NaCl, pH 8.3), 10 μL of 50 mM MgCl2 and 5 μL of DEPC-H2O. After incubation at 37 °C for 1.5 h, 10 μL of 400 nM substrate strands were added and the mixture was allowed to react at 37 °C for 1 h, followed by fluorescence measurements.
Conflicts of interest
There are no conflicts to declare.Acknowledgements
This work was supported by the National Natural Science Foundation of China (No. 21675100, 21675101 and 21705094), the Young Scholars Program of Shandong University (2018WLJH50), and the Open Funds of the State Key Laboratory of Electroanalytical Chemistry (SKLEAC202004).Notes and references
- A. P. Davis, Nature, 1999, 401, 120–121 CrossRef CAS PubMed.
- E. R. Kay and D. A. Leigh, Angew. Chem., Int. Ed., 2015, 54, 10080–10088 CrossRef CAS PubMed.
- J. M. Abendroth, O. S. Bushuyev, P. S. Weiss and C. J. Barrett, ACS Nano, 2015, 9, 7746–7768 CrossRef CAS PubMed.
- W. J. Wang, S. Yu, S. Huang, S. Bi, H. Y. Han, J.-R. Zhang, Y. Lu and J.-J. Zhu, Chem. Soc. Rev., 2019, 48, 4892–4920 RSC.
- J. Bath and A. J. Turberfield, Nat. Nanotechnol., 2007, 2, 275–284 CrossRef CAS PubMed.
- N. C. Seeman, Annu. Rev. Biochem., 2010, 79, 65–87 CrossRef CAS PubMed.
- L. Ge, W. X. Wang, X. M. Sun, T. Hou and F. Li, Anal. Chem., 2016, 88, 9691–9698 CrossRef CAS PubMed.
- Q. F. Xu, Y. Zhang and C.-Y. Zhang, Chem. Commun., 2015, 51, 5652–5655 RSC.
- S. D. Mason, Y. N. Tang, Y. Y. Li, X. Y. Xie and F. Li, TrAC, Trends Anal. Chem., 2018, 107, 212–221 CrossRef CAS.
- Y. Tian, Y. He, Y. Chen, P. Yin and C. D. Mao, Angew. Chem., Int. Ed., 2005, 44, 4355–4358 CrossRef CAS PubMed.
- L. Peng, P. Zhang, Y. Chai and R. Yuan, Anal. Chem., 2017, 89, 5036–5042 CrossRef CAS PubMed.
- Z. G. Wang, J. Elbaz and I. Willner, Nano Lett., 2011, 11, 304–309 CrossRef CAS PubMed.
- K. Lund, A. J. Manzo, N. Dabby, N. Michelotti, A. Johnson-Buck, J. Nangreave, S. Taylor, R. J. Pei, M. N. Stojanovic, N. G. Walter, E. Winfree and H. Yan, Nature, 2010, 465, 206–209 CrossRef CAS PubMed.
- S. F. J. Wickham, M. Endo, Y. Katsuda, K. Hidaka, J. Bath, H. Sugiyama and A. J. Turberfield, Nat. Nanotechnol., 2011, 6, 166–169 CrossRef CAS PubMed.
- C. Li, X. X. Li, L. M. Wei, M. Y. Liu, Y. Y. Chen and G. X. Li, Chem. Sci., 2015, 6, 4311–4317 RSC.
- L. Y. Zhu, Q. H. Liu, B. Y. Yang, H. X. Ju and J. P. Lei, Anal. Chem., 2018, 90, 6357–6361 CrossRef CAS PubMed.
- X. Yang, Y. Tang, S. D. Mason, J. Chen and F. Li, ACS Nano, 2016, 10, 2324–2330 CrossRef CAS PubMed.
- Z. Q. Xu, L. L. Liao, Y. Q. Chai, H. J. Wang and R. Yuan, Anal. Chem., 2017, 89, 8282–8287 CrossRef CAS PubMed.
- P. L. Cheng, P. Q. Ma, H. Liu, X. G. Guo, B. C. Yin and B. C. Ye, Angew. Chem., Int. Ed., 2017, 56, 9077–9081 CrossRef PubMed.
- H. Q. Zhang, M. D. Lai, A. Zuehlke, H. Y. Peng, X. F. Li and X. C. Le, Angew. Chem., Int. Ed., 2015, 54, 14326–14330 CrossRef CAS PubMed.
- H. Peng, X. F. Li, H. Zhang and X. C. Le, Nat. Commun., 2017, 8, 14378 CrossRef PubMed.
- C. Feng, Z. H. Wang, T. S. Chen, X. X. Chen, D. S. Mao, J. Zhao and G. X. Li, Anal. Chem., 2018, 90, 2810–2815 CrossRef CAS PubMed.
- C. Jung, P. B. Allen and A. D. Ellington, Nat. Nanotechnol., 2016, 11, 157–163 CrossRef CAS PubMed.
- J. Zheng, N. X. Li, C. R. Li, X. X. Wang, Y. C. Liu, G. B. Mao, X. H. Ji and Z. K. He, Biosens. Bioelectron., 2018, 107, 40–46 CrossRef CAS PubMed.
- X. M. Qu, D. Zhu, G. B. Yao, S. Su, J. Chao, H. J. Liu, X. L. Zuo, L. H. Wang, J. Y. Shi, L. H. Wang, W. Huang, H. Pei and C. H. Fan, Angew. Chem., Int. Ed., 2017, 56, 1855–1858 CrossRef CAS PubMed.
- P. Varilly, S. Angioletti-Uberti, B. M. Mognetti and D. Frenkel, J. Chem. Phys., 2012, 137, 094108 CrossRef PubMed.
- S. Angioletti-Uberti, B. M. Mognetti and D. Frenkel, Nat. Mater., 2012, 11, 518–522 CrossRef CAS PubMed.
- F. J. Martinez-Veracoechea, B. M. Mognetti, S. Angioletti-Uberti, P. Varilly, D. Frenkel and J. Dobnikar, Soft Matter, 2014, 10, 3463–3470 RSC.
- Y. M. Wang and J. Z. Lin, Appl. Math. Mech., 2011, 32, 1019–1028 CrossRef.
- C. Botting and R. J. Kuhn, Expet Opin. Drug Discov., 2012, 7, 417–428 CrossRef CAS PubMed.
- W. M. Kok, Expet Opin. Drug Discov., 2016, 11, 433–445 CrossRef CAS PubMed.
- P. W. Orellano, J. I. Reynoso, H. C. Stahl and O. D. Salomon, Vaccine, 2016, 4, 616–621 CrossRef PubMed.
- A. D. Bentsi-Enchill, J. Schmitz, R. Edelman, A. Durbin, J. T. Roehrig, P. G. Smith, J. Hombach and J. Farrar, Vaccine, 2013, 31, 2603–2609 CrossRef CAS PubMed.
- Y. C. Shiang, C. M. Ou, S. J. Chen, T. Y. Ou, H. J. Lin, C. C. Huang and H. T. Chang, Nanoscale, 2013, 5, 2756–2764 RSC.
- S. Ota, S. Wang, Y. Wang, X. B. Yin and X. Zhang, Nano Lett., 2013, 13, 2766–2770 CrossRef CAS PubMed.
- K. C. Grabar, R. G. Freeman, M. B. Hommer and M. J. Natan, Anal. Chem., 1995, 67, 735–743 CrossRef CAS.
- S. J. Hurst, A. K. R. Lytton-Jean and C. A. Mirkin, Anal. Chem., 2006, 78, 8313–8318 CrossRef CAS.
Footnote |
| † Electronic supplementary information (ESI) available. See DOI: 10.1039/d0sc00109k |
| This journal is © The Royal Society of Chemistry 2020 |

