 Open Access Article
Creative Commons Attribution 3.0 Unported Licence
Novel NIR-II organic fluorophores for bioimaging beyond 1550 nm†
Yang
Li‡
ab,
Yufang
Liu‡
ab,
Qianqian
Li
a,
Xiaodong
Zeng
 a,
Tian
Tian
b,
Wenyi
Zhou
a,
Yan
Cui
b,
Xikun
Wang
b,
Xiaoding
Cheng
a,
Qihang
Ding
a,
Xiaofei
Wang
d,
Junzhu
Wu
d,
Hai
Deng
a,
Tian
Tian
b,
Wenyi
Zhou
a,
Yan
Cui
b,
Xikun
Wang
b,
Xiaoding
Cheng
a,
Qihang
Ding
a,
Xiaofei
Wang
d,
Junzhu
Wu
d,
Hai
Deng
 e,
Yanqin
Li
a,
Xianli
Meng
c,
Zixin
Deng
a,
Xuechuan
Hong
 ab and
Yuling
Xiao
 *a
*a
aState Key Laboratory of Virology, Key Laboratory of Combinatorial Biosynthesis and Drug Discovery (MOE), Hubei Province Engineering and Technology Research Center for Fluorinated Pharmaceuticals, Wuhan University School of Pharmaceutical Sciences, Wuhan 430071, China. E-mail: xiaoyl@whu.edu.cn
bCollege of Science, Innovation Center for Traditional Tibetan Medicine Modernization and Quality Control, Medical College, Tibet University, Lhasa, 850000, China
cInnovative Institute of Chinese Medicine and Pharmacy, Chengdu University of Traditional Chinese Medicine, Chengdu, Sichuan 611137, China
dHubei Provincial Key Laboratory of Developmentally Originated Disease, Center for Experimental Basic Medical Education, Wuhan 430071, China
eDepartment of Chemistry, University of Aberdeen, Aberdeen, UK
First published on 6th February 2020
Abstract
Near-infrared fluorescence imaging in the 1500–1700 nm sub-window (NIR-IIb) has shown a deeper penetration depth, higher resolution and zero auto-fluorescence for biomedical imaging. Till now, very few small molecule NIR-IIb fluorophores have been reported due to the extremely rare organic NIR-IIb skeleton and a notorious aggregation-caused quenching (ACQ) effect in aqueous solution. In this study, highly twisted NIR-II small molecule fluorophores such as HL3 (45.5° at the S0 state) with the emission wavelength extending into the NIR-IIb region were designed and synthesized using an aggregation-induced emission (AIE) strategy. HL3 dots showed a remarkable increase in fluorescence intensity with a QY of 11.7% in the NIR-II window (>1000 nm) and 0.05% in the NIR-IIb region (>1550 nm) in water. High-resolution in vivo imaging of the whole body, cerebral vasculature, and lymphatic drainage beyond 1550 nm was achieved using NIR-II AIE HL3 dots for the first time. These attractive results may promote the development of small-molecule NIR-IIb fluorophores with the maximum emission wavelength beyond 1500 nm with a deeper penetration depth and higher resolution.
Introduction
Optical fluorescence imaging is a promising modality for real-time monitoring of disease progression, drug delivery and image-guided surgery with high spatial and temporal resolution.1 However, traditional fluorescence imaging techniques mostly focused on the visible and near-infrared region below 900 nm, where imaging resolution and penetration depths were largely limited due to the photo-scattering, auto-fluorescence and absorption of biological tissues. Hence, developing novel fluorophores with longer emission wavelengths to improve imaging resolution for in vivo deeper imaging is crucial and still a great challenge.2During the past few years, molecular imaging in the second near-infrared region (NIR-II, 1000–1700 nm) has emerged as a powerful tool for the delineation and treatment of cancers.3–12 The first organic small-molecule dye CH1055 with 90% renal excretion for NIR-II bio-imaging was reported in 2015,5 and opened up a new era for small molecule imaging. Deeper imaging depths (up to 3 cm), excellent temporal and spatial resolutions (50 FPS and 1 μm), and a higher tumor-to-normal tissue (T/NT) ratio (up to 15) were achieved in the NIR-II region.5,12 Especially, the NIR-IIb sub-window (1500–1700 nm) showed tremendous advantages of near-zero auto-fluorescence, negligible scattering, and unparalleled tissue-imaging depths, and turned out to be a hot spot for in vivo fluorescence bioimaging.13 Very few inorganic NIR-IIb fluorophores such as single-walled carbon nanotubes (SWNTs), rare earth doped nanoparticles, and quantum dots have been investigated for biosensing and bioimaging beyond 1500 nm.7g,8f,13–17 It is worth noting that organic FD-1080 J-aggregates were first accomplished with high resolution imaging of the cerebral and hindlimb vasculature with fluorescence emission tailing into 1500 nm with a quantum yield (QY) of 0.0545%.17 The signal-to-background ratio (SBR) was 3.3-fold higher than that of NIR-IIa (1300–1400 nm) imaging. However, small-molecule NIR-IIb fluorophores (beyond 1500 nm) are still in their infancy. Shifting small-molecule NIR-II fluorophore emissions, specifically into the NIR-IIb sub-window, is a great challenge but crucial for their expansion to in vivo biomedical applications. Thus, it is imperative to pursue new sorts of small molecule NIR-IIb dyes for enhanced optical imaging.
Here, we have rationally designed and synthesized new fluorescent probes HL1–HL3 based on our previously reported NIR-II fluorophores H17d and Q4.6a The hexyloxy chain substituted at positions R1 and R2 of thiophene not only served as a strong donor, but also significantly increased the dihedral angle up to 45.5° between BBTD and thiophene for the S0 geometries (Fig. 1). Among them, HL3 showed remarkable brightness, excellent AIE features with fluorescence emission stretching to 1550 nm and with a quantum yield of 0.05%. Furthermore, in vivo imaging beyond 1550 nm of the blood vessels, cerebral vasculature, and lymph nodes was achieved for the first time.
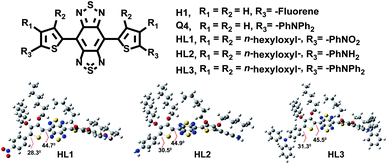 | ||
| Fig. 1 The chemical structure and optimized ground state geometries (S0) of HL1–HL3 by using the Gaussian 09 software. | ||
Results and discussion
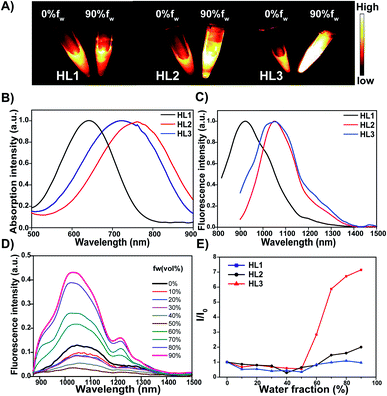
A vast majority of small-molecule NIR-II contrast agents were synthesized using the donor–acceptor–donor (D–A–D) backbones, in which benzobisthiadiazole (BBTD) was used as the electron acceptor unit.3–13 Nevertheless, the fluorescence quantum yields of organic NIR-II chromophores in aqueous solution were relatively low. The rigid planar aromatic structures with tremendous intermolecular π–π stacking interactions and the dominant non-radiative decay may be attributed to the aggregation-caused quenching (ACQ) effect in low-bandgap materials.18 A feasible solution is to fully use the brightness of the dihedral twisted NIR-II backbones with strong emission extending into the NIR-IIb region by the aggregation-induced emission (AIE) strategy.18–22 Thus, three novel organic small-molecule NIR-II fluorophores HL1–HL3 were designed (Fig. 1). 3,4-bis(hexyloxy)thiophene served as the first donor (D1), and triphenylamine was utilized as the second donor (D2) and a building block of AIEgens. In addition, the influence of the electron-withdrawing group nitrobenzene and the electron donating group aminobenzene on the whole backbone was also investigated. Density functional theory (DFT) was first employed to calculate the electronic properties of HL1–HL3 using Gaussian 09 software and the B3LYP/6-31G(d) method. For the optimized ground state (S0) geometries, the twisted angles of HL1–HL3, H1 and Q4 were calculated. All dihedral angles of HL1–HL3 between BBTD and donor 3,4-bis(hexyloxy)thiophene were ∼45° (Fig. 1), exhibiting more distortion than that of Q4 (∼1.9°) and H1 (∼0.3°) (Fig. S1†). The Egap of HL1 (1.78 eV) indicated short wavelength infrared characteristics (Table S1†). Moreover, the Egap of HL2 and HL3 was 1.45 eV and 1.48 eV, respectively (Fig. S2†), lower than that of CH1055 (1.5 eV) with a typical NIR-II optical Egap, resulting in a hypsochromic shift compared to H1 (1.21 eV) and Q4 (1.12 eV) (Table S1†).The small-molecule fluorophores HL1–HL3 were synthesized mainly through Stille coupling, Zn reduction, N-thionylaniline-induced ring closure and Suzuki coupling in 45–50% yield over 4 steps from compound 1 (Fig. 2 and ESI†). The structures were confirmed by 1H NMR, 13C NMR, MALDI-TOF-MS or ESI-MS (Fig. S12–S26†). The spectroscopic properties of HL1–HL3 in THF are shown in Fig. 3B and C, and it was found that their maximum emission wavelengths were ∼922 nm, 1062 nm and 1050 nm, respectively, which were consistent with the results of Egap calculated using the Gaussian 09 software and 6-31G(d, p). HL3 exhibited a remarkable increase in fluorescence intensity with a strong tail in the 1500 nm region (Fig. 3C). The molar extinction coefficients (ε) of HL1–HL3 in THF were measured to be 8.3 × 10³ L mol−1 cm−1, 4.1 × 10³ L mol−1 cm−1 and 7 × 10³ L mol−1 cm−1, respectively. The QYs of HL1–HL3 in THF were measured to be 0.2%, 0.34% and 2% with IR-26 (QY: 0.5%) as a reference, respectively (Fig. S3†). The AIE properties of HL1–HL3 were studied in the THF/water mixture solvents upon increasing the water volume fraction (fw). As shown in Fig. 3A, HL3 exhibited extremely strong fluorescence emission in THF/water with 90% fw. To further confirm the AIE properties of HL1–HL3, the fluorescence emission spectra with different fws were subsequently obtained under 808 nm excitation (Fig. 3D, E and S4†). The fluorescence (FL) intensity of HL1–HL3 gradually decreased with the increase of fw from 0 to 40–50%, and increased sharply for HL3 from fw 50% to 90%, indicating a typical AIE characteristic. Meanwhile, no AIE characteristics were observed for H1 and Q4 under the similar conditions.
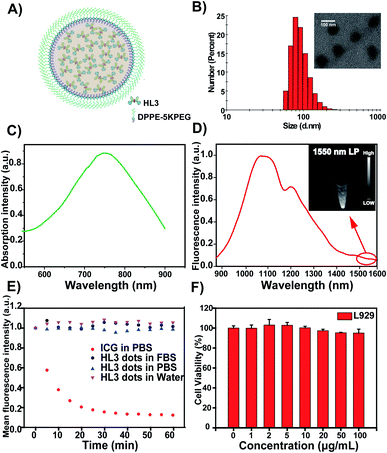
HL2 and HL3 dots with high monodispersity and homogeneity were prepared in amphiphilic DPPE-5KPEG (Fig. 4A, S5 and S6†). HL3 dots were characterized for bioimaging applications by transmission electron microscopy (TEM), dynamic light scattering (DLS) and the zeta potential with an average size of ∼90 nm, a dynamic size of ∼120 nm (Fig. 4B) and ∼ −9.2 eV, respectively (Fig. S7†). The encapsulation efficiency of HL3 dots was calculated to be ∼82% (Fig. S8†). The maximum absorption wavelength was 750 nm (Fig. 4C). The maximum emission wavelength was centered at 1050 nm and tailed to 1600 nm (Fig. 4D). The quantum yields were calculated to be ∼11.7% in the NIR-II region (1000–1700 nm) and ∼0.05% in the NIR-IIb region (beyond 1550 nm). The molar extinction coefficient (ε) of HL3 dots in water was measured to be 9.3 × 10³ L mol−1 cm−1. The reasonable quantum yields and NIR-IIb fluorescence emission of HL3 dots encouraged us to explore their NIR-IIb imaging capabilities in vitro. HL3 dots exhibited excellent fluorescence intensity beyond 1550 nm under 808 nm laser irradiation (1550 nm LP, Fig. 4D). As shown in Fig. 4E, the fluorescence intensity of the HL3 dots showed no obvious changes in different media (FBS, PBS and water) under continuous 808 nm laser irradiation for 1 h (90 mW cm−2). L929 mouse fibroblast cells were applied to evaluate the potential cytotoxicity of HL3 dots using a standard 3-(4,5-dimethylthiazol-2-yl)-2,5-diphenyl tetrazolium bromide (MTT) assay. High cell viability was observed even at a high concentration (100 μg mL−1, Fig. 4F). The pharmacokinetics of HL3 dots were also investigated through the measurement of the blood circulation half-life. The blood half-life of HL3 dots was 114 min (Fig. S9†). All these results have demonstrated that HL3 dots have superior stability and excellent biocompatibility, and are more applicable for NIR-IIb bioimaging (beyond 1550 nm) in vivo.
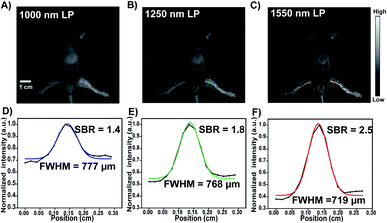
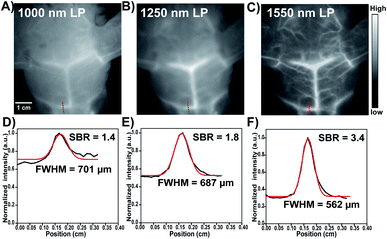
To explore the feasibility of HL3 dots as a novel AIE NIR-IIb probe for reliable imaging of the whole body and cerebral vasculature system in KM mice and C57BL/6 mice (n = 3 per group), HL3 dots (200 μL, 1 mg mL−1) were then injected into KM mice via the tail vein, and NIR-II and NIR-IIb images of blood vessels were recorded using an InGaAs camera with different LP filters (1000 nm, 1250 nm, and 1550 nm) and different exposure times under 808 nm laser irradiation (90 mW cm−2). After 5 min post-injection, whole blood vessels were clearly visualized, and the hind limb vasculature was chosen for analysis via the Gaussian-fitted full width at half maximum (FWHM) (Fig. 5). It was found that the imaging of HL3 dots in the NIR-II window (>1250 nm, 1250 nm LP) with a 50 ms exposure time exhibited highly superior resolution (Fig. 5B). An extended exposure time (500 ms) was needed for higher resolution NIR-IIb imaging beyond 1550 nm (>1550 nm, 1550 nm LP) (Fig. 5C). The FWHM values of the hind limb vasculature were 777 μm (1000 nm LP), 768 μm (1250 nm LP) and 719 μm (1550 nm LP), respectively. The signal-to-background ratio (SBR) of NIR-IIb imaging (SBR = 2.5, 1550 nm LP) was much higher than that of NIR-II imaging (SBR = 1.4, 1000 nm LP and SBR = 1.8, 1250 nm LP) (Fig. 5). The cerebral vasculature system was also imaged using the NIR-IIb probe HL3 dots. The superior resolution of tiny vessels was obtained (Fig. 6). The corresponding SBR of NIR-II 1000 nm, NIR-II 1250 nm and NIR-IIb 1550 nm imaging was 1.4, 1.8 and 3.4, respectively (Fig. 6D and E). The SBR of NIR-IIb imaging (1550 nm LP) was 2.4-fold higher than that of NIR-II imaging (1000 nm LP). The FWHM values of the vessels at the same position (red dashed line) for different LP filters were calculated to be 701 μm (1000 nm LP), 687 μm (1250 nm LP), and 562 μm (1550 nm LP), respectively. The NIR-II fluorescence images obtained using 1000 nm, 1250 nm and 1550 nm LP were also evaluated at the same exposure time (200 ms) at a concentration of 0.8 mg mL−1. It was found that HL3 saturated the detector with 1000 nm and 1250 nm long-pass filters under imaging conditions suitable for HL3 with a 1550 nm long-pass filter (Fig. S10†). All these results indicated that HL3 dots have great potential for in vivo NIR-IIb imaging (beyond 1500 nm) at an extended exposure time.
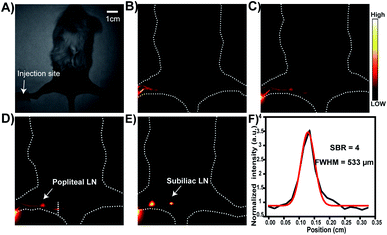
The lymph node drainage plays a vital role in tumor metastasis. We next demonstrated the application of HL3 dots for lymph node NIR-IIb imaging (beyond 1550 nm). HL3 dots (15 μL, 1 mg mL−1) were injected intra-dermally at the left forefoot pad of KM mice (n = 3 per group) (Fig. 7). The process of lymphatic drainage was monitored under 808 nm laser irradiation (90 mW cm−2) using 1550 nm LP. Lymphatic vessels were notably identified in 1 min after injection. The popliteal lymph node was gradually lighted up, and both the popliteal lymph node and the subiliac lymph node were clearly visualized in 2 h. The diameter of the lymphatic vessel between the popliteal lymph node and the subiliac lymph node was calculated to be 533 μm via FWHM, and the SBR reached 4 (Fig. 7F). The SBR values of the popliteal lymph node and the subiliac lymph node were 2.5 and 3.2 (1000 nm LP), 2.9 and 3.4 (1250 nm LP), and 5.1 and 4.8 (1550 nm LP), respectively (Fig. S11†). These results reveal that NIR-IIb imaging beyond 1550 nm of lymph node drainage can be achieved with a higher SBR.
Experimental section
All animal experiments were performed according to the Chinese Regulations for the Administration of Affairs Concerning Experimental Animals and approved by the Institutional Animal Care and Use Committee (IACUC) of Wuhan University. And all the experimental details are provided in the ESI.†Conclusions
In summary, we have successfully synthesized a series of small molecule fluorophores HL1–HL3 by introducing different donors and distortion groups. Among them, HL3 showed extremely stronger AIE characteristics and highly twisted donor–acceptor distortion. HL3 dots exhibited excellent water solubility, photo-stability and biocompatibility with a remarkable increase in NIR-II fluorescence intensity with QYs of 11.7% and 0.05% in the NIR-II (>1000 nm) and NIR-IIb region (>1550 nm), respectively, in water. Superior quality NIR-IIb imaging beyond 1550 nm of the whole body, cerebral vasculature and the lymphatic drainage system was demonstrated for the first time with a higher SBR. It is hoped that this novel NIR-II fluorophore HL3 obtained using an integrated AIE and D–A distortion strategy may become a practical strategy to develop small-molecule NIR-IIb fluorophores with the maximum emission wavelength beyond 1500 nm with a deeper penetration depth and higher resolution.Conflicts of interest
There are no conflicts to declare.Acknowledgements
This work was partially supported by grants from NSFC (81773674, 81573383, and 21473041), NSFHP (2017CFA024, 2017CFB711, and 2016ACA126), the Applied Basic Research Program of WMBST (2019020701011429), Tibet Autonomous Region Science and Technology Plan Project Key Project (XZ201901-GB-11), Project First-Class Disciplines Development Supported by Chengdu University of Traditional Chinese Medicine (CZYJC1903), and Health Commission of Hubei Province Scientific Research Project (WJ2019M177 and WJ2019M178).Notes and references
- G. Hong, A. L. Antaris and H. Dai, Nat. Biomed. Eng., 2017, 1, 0010 CrossRef CAS.
- S. He, J. Song, J. Qu and Z. Cheng, Chem. Soc. Rev., 2018, 47, 4258–4278 RSC.
- (a) G. Hong, J. C. Lee, J. T. Robinson, U. Raaz, L. Xie, N. F. Huang, J. P. Cooke and H. Dai, Nat. Med., 2012, 18, 1841 CrossRef CAS PubMed; (b) Y. Du, B. Xu, T. Fu, M. Cai, F. Li, Y. Zhang and Q. Wang, J. Am. Chem. Soc., 2010, 132, 1470–1471 CrossRef CAS PubMed; (c) G. Hong, J. T. Robinson, Y. Zhang, S. Diao, A. L. Antaris, Q. Wang and H. Dai, Angew. Chem., Int. Ed., 2012, 51, 9818–9821 CrossRef CAS PubMed; (d) Y. Sun, X. Ma, K. Cheng, B. Wu, J. Duan, H. Chen, L. Bu, R. Zhang, X. Hu, Z. Deng, L. Xing, X. Hong and Z. Cheng, Angew. Chem., Int. Ed., 2015, 54, 5981–5984 CrossRef CAS PubMed.
- (a) G. Chen, F. Tian, C. Li, Y. Zhang, Z. Weng, Y. Zhang, R. Peng and Q. Wang, Biomaterials, 2015, 53, 265–273 CrossRef CAS PubMed; (b) G. Hong, S. Diao, J. Chang, A. L. Antaris, C. Chen, Z. Bo, Z. Su, D. N. Atochin, P. L. Huang, K. I. Andreasson, C. J. Kuo and H. Dai, Nat. Photonics, 2014, 8, 723–730 CrossRef CAS PubMed; (c) S. Diao, J. L. Blackburn, G. Hong, A. L. Antaris, J. Chang, J. Z. Wu, B. Zhang, K. Cheng, C. J. Kuo and H. Dai, Angew. Chem., Int. Ed., 2015, 54(49), 14758–14762 CrossRef CAS PubMed; (d) R. Wang, X. Li, L. Zhou and F. Zhang, Angew. Chem., Int. Ed., 2014, 53, 12086–12090 CrossRef CAS PubMed; (e) D. Naczynski, M. Tan, M. Zevon, B. Wall, J. Kohl, A. Kulesa, S. Chen, C. Roth, R. Riman and P. Moghe, Nat. Commun., 2013, 4, 2199 CrossRef CAS PubMed; (f) J. Lin, Q. Li, X. Zeng, Z. Chen, Q. Ding, Y. Li, H. Zhou, X. Meng, D. Chen, Z. Deng, X. Hong and Y. Xiao, Sci. China: Chem., 2020 DOI:10.1007/s11426-019-9685-6.
- (a) A. L. Antaris, H. Chen, K. Cheng, Y. Sun, G. Hong, C. Qu, S. Diao, Z. Deng, X. Hu, B. Zhang, X. Zhang, O. K. Yaghi, Z. R. Alamparambil, X. Hong, Z. Cheng and H. Dai, Nat. Mater., 2016, 15, 235–242 CrossRef CAS PubMed; (b) A. L. Antaris, H. Chen, S. Diao, Z. Ma, Z. Zhang, S. Zhu, J. Wang, A. X. Lozano, Q. Fan, L. Chew, M. Zhu, K. Cheng, X. Hong, H. Dai and Z. Cheng, Nat. Commun., 2017, 8, 15269 CrossRef CAS PubMed.
- (a) Y. Sun, C. Qu, H. Chen, M. He, C. Tang, K. Shou, S. Hong, M. Yang, Y. Jiang, B. Ding, Y. Xiao, L. Xing, X. Hong and Z. Cheng, Chem. Sci., 2016, 7, 6203–6207 RSC; (b) J.-Y. Zhao, G. Chen, Y.-P. Gu, R. Cui, Z.-L. Zhang, Z.-L. Yu, B. Tang, Y.-F. Zhao and D.-W. Pang, J. Am. Chem. Soc., 2016, 138, 1893–1903 CrossRef CAS PubMed; (c) X. D. Zhang, H. Wang, A. L. Antaris, L. Li, S. Diao, R. Ma, A. Nguyen, G. Hong, Z. Ma, J. Wang, S. Zhu, J. M. Castellano, T. Coray, Y. Liang, J. Luo and H. Dai, Adv. Mater., 2016, 28, 6872 CrossRef CAS PubMed; (d) X. Dang, L. Gu, J. Qi, S. Correa, G. Zhang, A. M. Belcher and P. T. Hammond, Proc. Natl. Acad. Sci. U. S. A., 2016, 113, 5179–5184 CrossRef CAS PubMed.
- (a) Z. Lei, X. Li, X. Luo, H. He, J. Zheng, X. Qian and Y. Yang, Angew. Chem., Int. Ed., 2017, 56, 2979–2983 CrossRef CAS PubMed; (b) E. D. Cosco, J. R. Caram, O. T. Bruns, D. Franke, R. A. Day, E. P. Farr, M. G. Bawendi and E. M. Sletten, Angew. Chem., Int. Ed., 2017, 56, 13126–13129 CrossRef CAS PubMed; (c) S. Zhu, Q. Yang, A. L. Antaris, J. Yue, Z. Ma, H. Wang, W. Huang, H. Wan, J. Wang, S. Diao, B. Zhang, X. Li, Y. Zhong, K. Yu, G. Hong, J. Luo, Y. Liang and H. Dai, Proc. Natl. Acad. Sci. U. S. A., 2017, 114, 962–967 CrossRef CAS PubMed; (d) Y. Sun, M. Ding, X. Zeng, Y. Xiao, H. Wu, H. Zhou, B. Ding, C. Qu, W. Hou, A. Er-bu, Y. Zhang, Z. Cheng and X. Hong, Chem. Sci., 2017, 8, 3489–3493 RSC; (e) Y. Feng, S. Zhu, A. L. Antaris, H. Chen, Y. Xiao, X. Lu, L. Jiang, S. Diao, K. Yu and Y. Wang, Chem. Sci., 2017, 8, 3703–3711 RSC; (f) C. Li, Y. Zhang, G. Chen, F. Hu, K. Zhao and Q. Wang, Adv. Mater., 2017, 29, 1605754 CrossRef PubMed; (g) Y. Zhong, Z. Ma, S. Zhu, J. Yue, M. Zhang, A. L. Antaris, J. Yuan, R. Cui, H. Wan, Y. Zhou, W. Wang, N. F. Huang, J. Luo, Z. Hu and H. Dai, Nat. Commun., 2017, 8, 737 CrossRef PubMed; (h) Y. Feng, S. Zhu, A. L. Antaris, H. Chen, Y. Xiao, X. Lu, L. Jiang, S. Diao, K. Yu, Y. Wang, S. Herraiz, J. Yue, X. Hong, G. Hong, Z. Cheng, H. Dai and A. J. Hsueh, Chem. Sci., 2017, 8, 3703–3711 RSC.
- (a) J. A. Carr, D. Franke, J. R. Caram, C. F. Perkinson, M. Saif, V. Askoxylakis, M. Datta, D. Fukumura, R. K. Jain, M. G. Bawendi and O. T. Bruns, Proc. Natl. Acad. Sci. U. S. A., 2018, 115, 4465–4470 CrossRef CAS PubMed; (b) Y. Sun, X. Zeng, Y. Xiao, C. Liu, H. Zhu, H. Zhou, Z. Chen, F. Xu, M. Zhu, J. Wu, H. Zhang, Z. Deng, Z. Cheng and X. Hong, Chem. Sci., 2018, 9, 2092–2097 RSC; (c) B. Li, L. Lu, M. Zhao, Z. Lei and F. Zhang, Angew. Chem., Int. Ed., 2018, 57, 1–6 CrossRef; (d) H. Wan, J. Yue, S. Zhu, T. Uno, X. Zhang, Q. Yang, K. Yu, G. Hong, J. Wang, L. Li, Z. Ma, H. Gao, Y. Zhong, J. Su, A. L. Antaris, Y. Xia, J. Luo, Y. Liang and H. Dai, Nat. Commun., 2018, 9, 1171 CrossRef PubMed; (e) Z. Sheng, B. Guo, D. Hu, S. Xu, W. Wu, W. H. Liew, K. Yao, J. Jiang, C. Liu, H. Zheng and B. Liu, Adv. Mater., 2018, 30, 1800766 CrossRef PubMed; (f) Y. Fan, P. Wang, Y. Lu, R. Wang, L. Zhou, X. Zheng, X. Li, J. A. Piper and F. Zhang, Nat. Nanotechnol., 2018, 13, 941 CrossRef CAS PubMed; (g) S. Zhu, S. Herraiz, J. Yue, M. Zhang, H. Wan, Q. Yang, Z. Ma, Y. Wang, J. He, A. L. Antaris, Y. Zhong, S. Diao, Y. Feng, Y. Zhou, K. Yu, G. Hong, Y. Liang, A. J. Hsueh and H. Dai, Adv. Mater., 2018, 30, 1705799 CrossRef PubMed; (h) Z. Xue, S. Zeng and J. Hao, Biomaterials, 2018, 171, 153–163 CrossRef CAS PubMed; (i) Z. Ma, M. Zhang, J. Yue, C. Alcazar, Y. Zhong, T. C. Doyle, H. Dai and N. F. Huang, Adv. Funct. Mater., 2018, 28, 1803417 CrossRef PubMed; (j) M. Zhang, J. Yue, R. Cui, Z. Ma, H. Wan, F. Wang, S. Zhu, Y. Zhou, Y. Kuang, Y. Zhong, D.-W. Pang and H. Dai, Proc. Natl. Acad. Sci. U. S. A., 2018, 115(26), 6590 CrossRef CAS PubMed; (k) X. Lei, R. Li, D. Tu, X. Shang, Y. Liu, W. You, C. Sun, F. Zhang and X. Chen, Chem. Sci., 2018, 9, 4682 RSC.
- (a) X. Zeng, Y. Xiao and X. Hong, Adv. Healthcare Mater., 2018, 7, 1800589 CrossRef PubMed; (b) Y. Xu, M. Tian, H. Zhang, Y. Xiao, X. Hong and Y. Sun, Chin. Chem. Lett., 2018, 29, 1093–1097 CrossRef CAS; (c) W. Zhu, Sci. China: Chem., 2016, 59, 203–204 CrossRef CAS; (d) H. Zhou, Y. Xiao and X. Hong, Chin. Chem. Lett., 2018, 29, 1425–1428 CrossRef CAS; (e) J. Yang and X. Hong, Sci. China: Chem., 2019, 62, 7–8 CrossRef CAS.
- (a) R. Tian, H. Ma, Q. Yang, H. Wan, S. Zhu, S. Chandra, H. Sun, D. Kiesewetter, G. Niu, Y. Liang and X. Chen, Chem. Sci., 2019, 10, 326 RSC; (b) C. Qu, Y. Xiao, H. Zhou, J. Lin, X. Zeng, H. Chen, K. Qian, X. Zhang, J. Wu, Z. Deng, Z. Cheng and X. Hong, Adv. Opt. Mater., 2019, 7, 1900229 CrossRef; (c) Z. Hu, C. Fang, B. Li, Z. Zhang, C. Cao, M. Cai, S. Su, X. Sun, X. Shi, C. Li, T. Zhou, Y. Zhang, C. Chi, P. He, X. Xia, Y. Chen, S. S. Gambhir, Z. Cheng and J. Tian, Nat. Biomed. Eng., 2019 DOI:10.1038/s41551-019-0494-0; (d) B. Ding, Y. Xiao, H. Zhou, X. Zhang, C. Qu, F. Xu, Z. Deng, Z. Cheng and X. Hong, J. Med. Chem., 2019, 62, 2049–2059 CrossRef CAS PubMed; (e) X. Zeng, Z. Chen, L. Tang, H. Yang, N. Liu, H. Zhou, Z. Deng, Y. Yu, H. Deng, X. Hong and Y. Xiao, Chem. Commun., 2019, 55, 2541–2544 RSC; (f) F. Wang, H. Wan, Z. Ma, Y. Zhong, Q. Sun, Y. Tian, L. Qu, H. Du, M. Zhang, L. Li, H. Ma, J. Luo, Y. Liang, W. Li, G. Hong, L. Liu and H. Dai, Nat. Methods, 2019, 16, 545–552 CrossRef CAS PubMed; (g) S. Zhu, R. Tian, A. L. Antaris, X. Chen and H. Dai, Adv. Mater., 2019, 31, 1900321 CrossRef PubMed; (h) J. Huang, C. Xie, X. Zhang, Y. Jiang, J. Li, Q. Fan and K. Pu, Angew. Chem., Int. Ed., 2019, 58, 15120–15127 CrossRef CAS PubMed; (i) Y. Sun, F. Ding, Z. Zhou, C. Li, M. Pu, H. Li, G. Yang, Y. Sun and P. J. Stang, Proc. Natl. Acad. Sci. U. S. A., 2019, 116, 1968–1973 CrossRef PubMed; (j) Q. Wang, Y. Dai, J. Xu, J. Cai, X. Niu, L. Zhang, R. Chen, Q. Shen, W. Huang and Q. Fan, Adv. Funct. Mater., 2019, 29, 1901480 CrossRef; (k) B. Guo, Z. Feng, D. Hu, S. Xu, E. Middha, Y. Pan, C. Liu, H. Zheng, J. Qian, Z. Sheng and B. Liu, Adv. Mater., 2019, 13, 1902504 CrossRef PubMed; (l) Z. Zhang, X. Fang, Z. Liu, H. Liu, D. Chen, S. He, J. Zheng, B. Yang, W. Qin, X. Zhang and C. Wu, Angew. Chem., Int. Ed., 2019 DOI:10.1002/anie.201914397; (m) R. Tian, Q. Zeng, S. Zhu, J. Lau, S. Chandra, R. Ertsey, K. Hettie, T. Teraphongphom, Z. Hu, G. Niu, D. Kiesewetter, H. Sun, X. Zhang, A. Antaris, B. Brooks and X. Chen, Sci. Adv., 2019, 5, eaaw0672J CrossRef PubMed.
- Y. Chen, D. M. Montana, H. Wei, J. M. Cordero, M. Schneider, X. L. Guével, O. Chen, O. T. Bruns and M. G. Bawendi, Nano Lett., 2017, 17, 6330–6334 CrossRef CAS PubMed.
- Y. Cai, Z. Wei, C. Song, C. Tang, W. Han and X. Dong, Chem. Soc. Rev., 2019, 48, 22–37 RSC.
- S. Diao, J. L. Blackburn, G. Hong, A. L. Antaris, J. Chang, J. Z. Wu, B. Zhang, K. Cheng, C. J. Kuo and H. Dai, Angew. Chem., Int. Ed., 2015, 54, 1–6 CrossRef PubMed.
- Z. Deng, X. Li, Z. Xue, M. Jiang, Y. Li, S. Zeng and H. Liu, Nanoscale, 2018, 10, 9393–9400 RSC.
- Y. Li, S. Zeng and J. Hao, ACS Nano, 2019, 13, 248–259 CrossRef CAS PubMed.
- S. Wang, L. Liu, Y. Fan, A. M. El-Toni, M. S. Alhoshan, D. Li and F. Zhang, Nano Lett., 2019, 19, 2418–2427 CrossRef CAS PubMed.
- C. Sun, B. Li, M. Zhao, S. Wang, Z. Lei, L. Lu, H. Zhang, L. Feng, C. Dou, D. Yin, H. Xu, Y. Cheng and F. Zhang, J. Am. Chem. Soc., 2019, 141, 19221–19225 CrossRef CAS PubMed.
- (a) J. Mei, N. L. C. Leung, R. T. K. Kwok, J. W. Y. Lam and B. Z. Tang, Chem. Rev., 2015, 115, 11718–11940 CrossRef CAS PubMed; (b) J. Qi, C. Sun, D. Li, H. Zhang, W. Yu, A. Zebibula, J. W. Y. Lam, W. Xi, L. Zhu, F. Cai, P. Wei, C. Zhu, R. T. K. Kwok, L. L. Streich, R. Prevedel, J. Qian and B. Z. Tang, ACS Nano, 2018, 12, 7936–7945 CrossRef CAS PubMed.
- (a) J. Liu, C. Chen, S. Ji, Q. Liu, D. Ding, D. Zhao and B. Liu, Chem. Sci., 2017, 8, 2782–2789 RSC; (b) W. Wu, Y. Yang, Y. Yang, Y. Yang, K. Zhang, L. Guo, H. Ge, X. Chen, J. Liu and H. Feng, Small, 2019, 15, 1805549 CrossRef PubMed; (c) S. Wang, J. Liu, C. C. Goh, L. G. Ng and B. Liu, Adv. Mater., 2019, 31, 1904447 CrossRef CAS PubMed; (d) W. Wu, Y.-Q. Yang, Y. Yang, Y.-M. Yang, H. Wang, K.-Y. Zhang, L. Guo, H.-F. Ge, J. Liu and H. Feng, Int. J. Nanomed., 2019, 14, 3571 CrossRef CAS PubMed.
- Q. Yang, Z. Hu, S. Zhu, R. Ma, H. Ma, Z. Ma, H. Wan, T. Zhu, Z. Jiang, W. Liu, L. Jiao, H. Sun, Y. Liang and H. Dai, J. Am. Chem. Soc., 2018, 140, 1715–1724 CrossRef CAS PubMed.
- J. Lin, X. Zeng, Y. Xiao, L. Tang, J. Nong, Y. Liu, H. Zhou, B. Ding, F. Xu, H. Tong, Z. Deng and X. Hong, Chem. Sci., 2019, 10, 1219–1226 RSC.
- S. Liu, X. Zhou, H. Zhang, H. Ou, J. W. Y. Lam, Y. Liu, L. Shi, D. Ding and B. Z. Tang, J. Am. Chem. Soc., 2019, 141, 5359–5368 CrossRef CAS PubMed.
Footnotes |
| † Electronic supplementary information (ESI) available. See DOI: 10.1039/c9sc06567a |
| ‡ These authors contributed equally to this work. |
| This journal is © The Royal Society of Chemistry 2020 |


