
 Open Access Article
 This Open Access Article is licensed under a Creative Commons Attribution-Non Commercial 3.0 Unported Licence
The redox-coupled proton-channel opening in cytochrome c oxidase†
Alexander
Wolf‡
a,
Jovan
Dragelj‡
b,
Juliane
Wonneberg
a,
Johannes
Stellmacher
a,
Jens
Balke
a,
Anna Lena
Woelke
bd,
Milan
Hodoscek
 bc,
Ernst Walter
Knapp
*b and
Ulrike
Alexiev
*a
bc,
Ernst Walter
Knapp
*b and
Ulrike
Alexiev
*a
aPhysics Department, Freie Universität Berlin, 14195 Berlin, Germany. E-mail: ulrike.alexiev@fu-berlin.de
bInstitute of Chemistry and Biochemistry, Freie Universität Berlin, 14195 Berlin, Germany
cNational Institute of Chemistry, Hajdrihova 19, SI-1001 Ljubljana, Slovenia
dDepartment of Chemistry, University of Cambridge, Cambridge CB2 1EW, UK
First published on 27th February 2020
Abstract
Cytochrome c oxidase (CcO), a redox-coupled proton pump, catalyzes the reduction of molecular oxygen to water, thereby establishing the transmembrane proton gradient that fuels ATP synthesis. CcO employs two channels for proton uptake, the D- and the K-channel. In contrast to the D-channel, the K-channel does not constitute a continuous pathway of H-bonds for proton conduction and is only active in the reductive phase rendering its proton transport mechanism enigmatic. Theoretical studies have suggested selective hydration changes within the K-channel to become activated and being essential for vectorial proton transport. Here, we unravel a previously unidentified mechanism for transient proton channel activation by combining computational studies with site-directed nano-environmental probing of protonation, structural changes, and water dynamics. We show that electrostatic changes at the binuclear center lead to long-range conformational changes propagating to the K-channel entrance as evidenced by time-resolved fluorescence depolarization experiments and molecular dynamics (MD) simulations. These redox-induced long-range structural rearrangements affect the H-bond network at the K-channel's protein surface as shown by pKa-shift analysis of a local probe in experiment and simulation. Concomitantly, selective channel hydration at the K-channel entrance was revealed by dipolar relaxation studies to be associated with channel opening. We propose that instead of a singular change, it is the intricate interplay of these individual redox-triggered changes in the cause–effect relationship that defines the mechanism for transient proton conduction of the K-channel.
Introduction
The membrane protein complex cytochrome c oxidase (CcO) (Fig. 1) is an essential part of the mitochondrial respiratory chain and plays an important role in oxidative energy metabolism.1–5 CcO dysfunction causes a variety of severe metabolic diseases6 and is linked to neurodegenerative disorders.7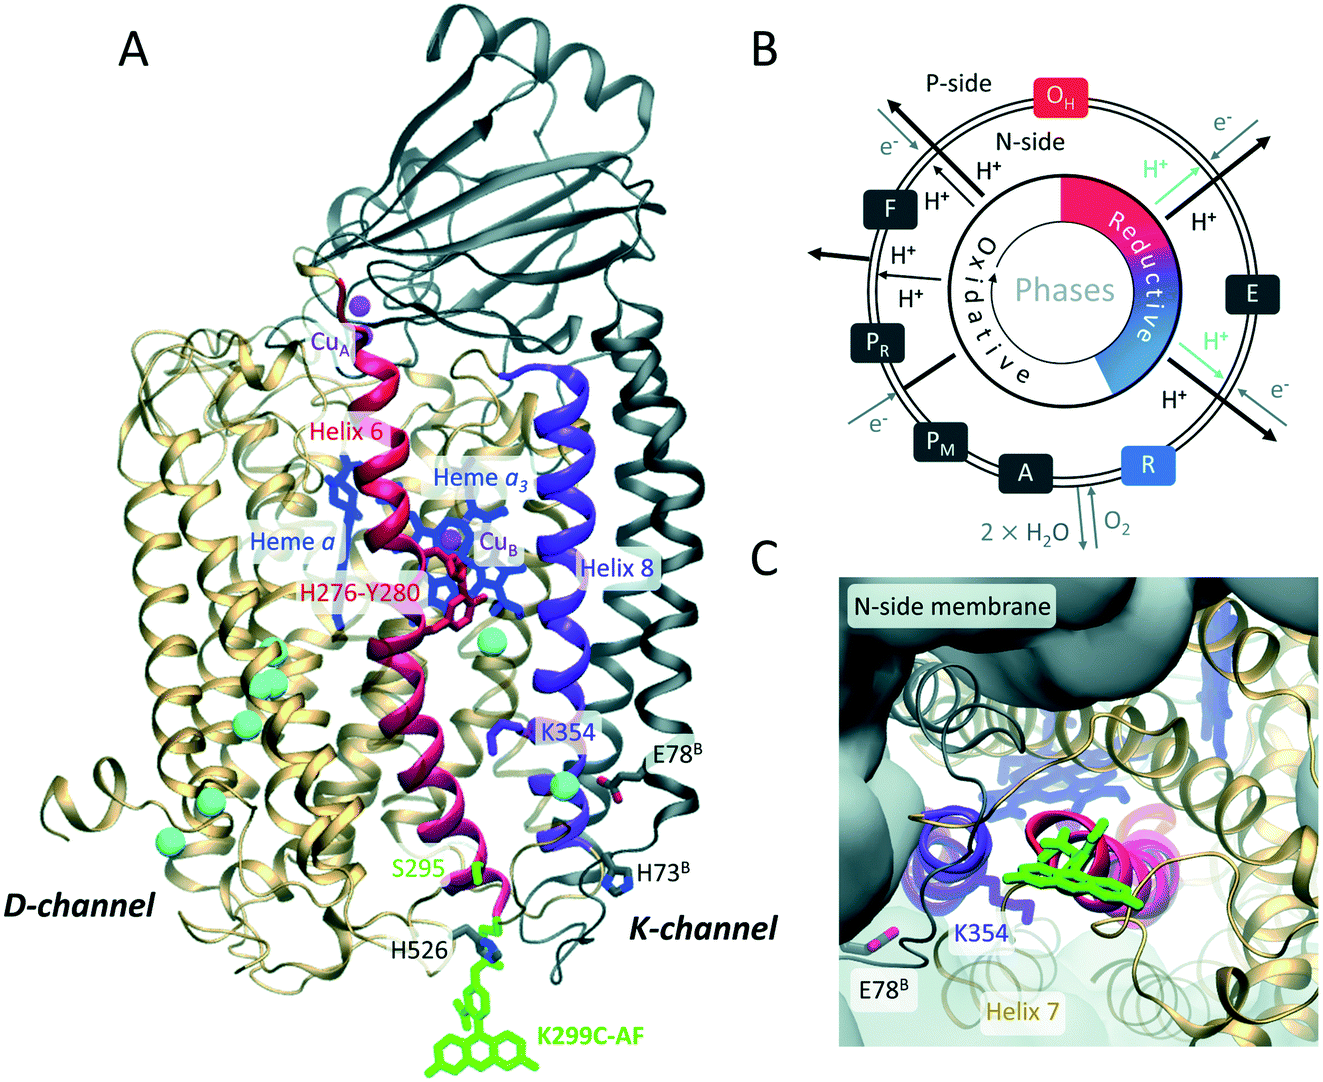 | ||
| Fig. 1 (A) Overall architecture of the two core subunits 1 (gold) and 2 (grey) of P. denitrificans CcO (based on PDB: 3HB3 (8)). Residues belonging to subunit 2 are labeled with superscript B. Fluorescein (green) is covalently linked to a cysteine introduced at position 299. CuA, CuB, heme a, and heme a3 are indicated in magenta and blue, respectively. Helices 6 and 8 are in red and purple, respectively. Water molecules in the K- and D-channels are in cyan. Residues K354, Y280, H276, H526, H73B, and E78B are highlighted. The latter is the probable starting point of the K-channel. (B) Catalytic cycle of CcO: during the reductive phase (O, red to R, blue), the K-channel (cyan) transports two protons for oxygen reduction. (C) Top view on K-channel entrance, fluorescein bound to K299C is shown. | ||
Functioning as a redox-coupled proton pump, the redox reaction of CcO, consuming four “substrate” protons, is coupled to the translocation of additional four “pumped” protons from the N- (negative) side across the membrane, thus increasing the electrochemical proton gradient.2 Major similarities between eukaryotic and prokaryotic CcO complexes have been revealed. In particular, Paracoccus denitrificans CcO is well suited to study the function and catalysis of its human mitochondrial counter part due to a high degree of homology while maintaining a less complex structure comprising only four subunits.3,8 Bacterial A-type CcOs translocate protons from the N-side (cytoplasmic side) to the catalytic center through two uptake pathways (Fig. 1A), named the K- and D-channels after their essential residues K354 and D124 (Paracoccus denitrificans CcO amino acid numbering, a one-letter amino acid code is used throughout). Proton transport through these channels is asymmetric, i.e., six protons move along the H-bond network of the D-channel, while only two protons translocate through the K-channel (Fig. 1B).5 It is generally assumed that these two protons are “substrate protons” required for the catalytic reduction of molecular oxygen to water in the binuclear center (BNC),9 consisting of the cofactors heme a3 and CuB (Fig. 1A).
The K-channel is only active during the reductive part of the catalytic cycle,5i.e., from the fully oxidized O state during two sequential electron uptake steps from cytochrome c (O → E → R transitions, Fig. 1B). The most general questions are how proton transport through the K-channel occurs in the absence of a continuous H-bond network and how selective channel activation is performed based on the enzyme's catalytic state. Redox state-dependent organization of water molecules within the protein was proposed from molecular dynamics (MD) simulations to play a role in gating and proton transfer.10–13 Theoretical models explaining K-channel opening highlight the importance of the protonation state and conformation of the essential K354 (ref. 11) in helix 8 and of the active site Y280 (ref. 9) in helix 6 (purple and red helices in Fig. 1A, respectively). Y280 might be involved in K-channel opening by connecting a water chain in the reductive phase.11,14,15 While extensive theoretical work exists, experimental evidence on how the proton channel becomes activated is missing.
Here, we dissect the mechanistic aspects of proton channel activation by investigating protonation and water dynamics, as well as conformational dynamics at the channel entrance depending on the redox-state of the catalytic center using a combination of experimental and computational methods. We employ site-directed fluorescence labeling of single reactive CcO cysteine variants with water dynamics- and protonation-sensitive fluorophores at the N-side end of helix 6, which hosts Y280. We expect the residues 299 at the protein–water interface and 295 one helix-turn inwards to be ideally suited for monitoring relevant changes that enable proton transport into the K-channel without disturbing proton uptake (Fig. 1A and C). As a thiol-reactive probe for hydration we used 6-bromoacetyl-2-dimethyl-aminonaphthalene (BADAN). Its time-dependent fluorescence shift (TDFS) varies in response to changes of hydration.16,17 As a protonation sensitive dye we employed 5-iodo-acetamidofluorescein (5-IAF) (Fig. 1A and C), which can also be used in time-resolved fluorescence anisotropy experiments to probe protein dynamics.18 To obtain an atomistic picture of the observed spectroscopic changes and to ascertain that the fluorescence probe close to the K-channel entrance is not disturbing the enzyme electrostatics, we combined experiments with MD simulations and electrostatic energy computations of the labeled enzyme.
Using this unique approach, we show a redox-induced structural rearrangement in the protein's H-bond network propagating from the cofactors to the K-channel entrance that is correlated with an increase in protein flexibility at the end of helix 6 facing the protein–water interface. At the same time, we observed in TDFS experiments a substantial increase in local solvent relaxation dynamics at the protein surface, indicating the involvement of hydration changes in K-channel opening. Through this complex mechanism, subtle conformational changes at the protein surface, triggered by cofactor redox changes, influence K-channel proton transport significantly. Thereby water molecule diffusivity also plays a decisive role. Thus, we identified cause–effect relationships in the coupling of protonation dynamics and conformational changes propagating through the extended network of hydrogen bonds.
Experimental
Design, construction, and labeling of the single-cysteine Cco-CS-K299C (in short K299C) and CcO-CS-S295C (S295C) variants were performed as previously described.19 Expression, cell growth, harvesting, isolation, purification, and fluorescence labeling of the proteins were essentially performed as described in ref. 19 and 20. Titration and pKa-determination, steady-state and time-resolved fluorescence anisotropy experiments using time-correlated single photon counting (TCSPC) were performed essentially as described by Alexiev et al.18,21,22 TDFS experiments with BADAN were performed using a confocal setup for TCSPC measurements equipped with a spectrally resolved detector. Computations of CcO were performed as described previously.11 Fluorescein coordinates were taken from the crystal structure of carbonic anhydrase II (PDB code: 2F14). Computation of fluorescence depolarization was performed similarly to Schröder et al.23 Detailed computational and additional experimental methods and materials are available in the ESI.†Results and discussion
Redox-dependent protonation changes at the K-channel entrance
To probe redox-dependent proton affinities around the K-channel entrance, we used the pH-sensitive dye fluorescein. For the covalent attachment of the thiol-reactive fluorescein derivative 5-IAF we performed site-directed fluorescence labeling of the single-cysteine CcO variant K299C located at the N-side end of helix 6, and S295C located one helix turn further into the protein (Fig. 1), yielding K299C-AF and S295C-AF.The proton affinity of fluorescein is monitored by pKa. Thus, we titrated the reporter dye in the K-channel open and closed states, corresponding to the reduced (R) and oxidized states (O) of the enzyme, respectively; the latter occurs directly before K-channel activation.13Fig. 2C shows the experimental pH–titration curves of K299C-AF in the oxidized and reduced state of the enzyme. The pKa of bound fluorescein increases by ΔpKa = +0.4 ± 0.1, from 6.69 ± 0.04 in O to 7.05 ± 0.05 in R (Fig. 2C). In contrast, the pKa of S295C-AF, located at a position further into the protein and pointing away from the K-channel (Fig. 1A), displays a negligible shift of ΔpKa = −0.1 ± 0.2, from 7.11 ± 0.05 in O to 7.03 ± 0.06 in R (Fig. S1†).
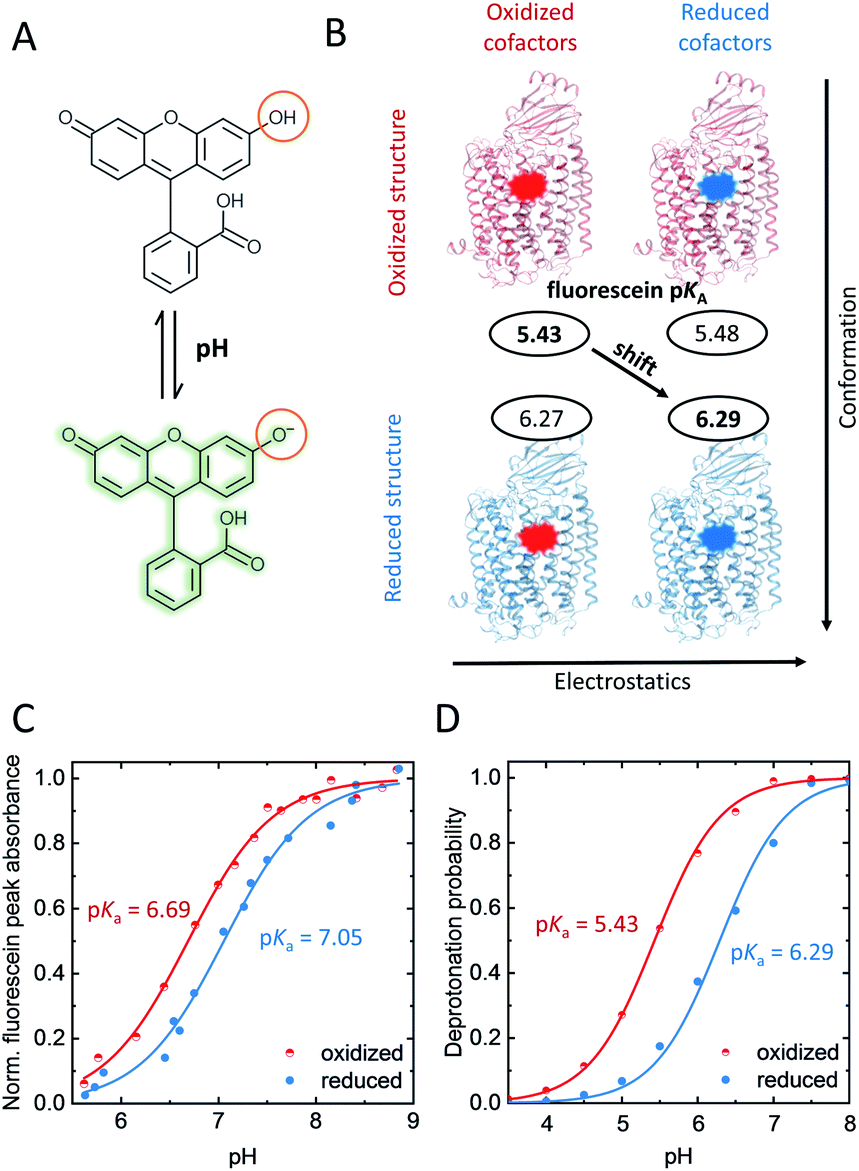 | ||
| Fig. 2 (A) Protonation equilibrium of fluorescein between the mono-anion and the alkaline di-anion state, whose absorbance band at ∼500 nm is pH-dependent. (B) Computed pKa-shift considering just change of conformation or change of the redox state of cofactors alone, or of both (diagonal arrow). (C) Measured and (D) computed pH–titration curve of K299-AF at the N-side end of helix 6, oxidized CcO: red; reduced CcO: blue. Errors of measured pKas are given in the text. Both in experiment and computation, a 4-electron reduced state was considered. Experimental conditions: 2 mM potassium phosphate buffer, 100 mM NaCl, 0.05% β-dodecyl-maltoside (β-DM), 20 °C. Generation of oxidized and reduced forms as described in the ESI.† | ||
To investigate the molecular origin of the pKa-upshift at position 299 we performed MD simulations and electrostatic energy computations of K299C-AF (Fig. S2†). Test simulations involving wild-type CcO indicate that the presence of fluorescein at position 299 at the end of helix 6 essentially does not influence the electrostatic properties of amino acid residues on the enzyme surface. The computed pKa-value of CcO-bound fluorescein shifts by +0.86 pH-units from 5.43 to 6.29 (Fig. 2D). The computed pKa-values have a slight negative offset compared to the experiments and the amount of the computed redox-induced pKa-shift is larger compared to the experimental titrations. However, qualitatively the experimental pKa-upshift is clearly reproduced in the electrostatic energy computation, both in sign of shift and magnitude (Fig. 2D). Note that pKa-upshifts comparable to those of K299C-AF have been measured for residues at the surface of other proteins.21
Electrostatic calculations and computations of pKa-values have previously contributed to the elucidation of the proton transfer mechanism in CcO's D-channel.24–27 By unraveling the nature of the probe's pKa-upshift we expect to shed light on the mechanism of transient K-channel opening. Different mechanisms could contribute. The observed pKa-upshift could be due to short-range electrostatic interactions induced by deprotonation of nearby residues, thus increasing the immediate negative surface charge. However, also a direct long-range electrostatic effect could be responsible, which is due to change of charges at the cofactors (CuA, heme a, and BNC) with reduction, thereby increasing the electrostatic potential at the N-side surface.28 The most interesting scenario, however, would be a redox-induced conformational change arising within the protein and propagating to the K-channel entrance where the fluorescein label is bound. Note that even small-scale conformational changes can induce a rearrangement of H-bonds.29 For the case at hand, such rearrangements can affect the pKa of the protein-bound probe at the channel entrance.
To investigate these three possibilities, we computed the pKa-values of CcO-bound fluorescein using time frames of the MD trajectory for both redox states at position 299 (O or R, Fig. 2B, vertical axis), where the charges of the cofactors were obtained from the corresponding other redox state. These pKa-values practically did not differ from each other (Fig. 2B, horizontal axis), ruling out a direct long-range electrostatic effect. A short-range effect could exist due to protonation changes of two nearby histidines (H526 and H73B, Fig. 1A). However, in the pH range where the fluorescein probe changes its protonation state with the redox state of CcO, the histidines do not change their protonation state in the computation. Therefore, also a short-range electrostatic effect can be ruled out. However, when including the entire trajectory and thus allowing the enzyme's conformation to adjust to its redox-state, the probe's pKa-upshift becomes apparent in the computations (Fig. 2B, diagonal arrow). Thus, this result strongly supports that the protein conformation is responsible for the change in the H-bond network around the K-channel entrance, which in turn shifts the pKa of fluorescein. Remarkably, in the MD simulations we did not observe large-scale conformational changes between O and R states. Hence, the observed pKa-shift must rather be due to subtle conformational changes that involve a reordering of the H-bond pattern, all induced by the charge change at the distant cofactors. Therefore, we suggest that the conformational changes in the O → E → R transition correlate with a rearrangement of the H-bond network that is mediated though helix 6 from the cofactors towards the K-channel entrance at the N-side of the enzyme. Fluorescein at position 299, directly at the helix–water interface, senses this particular redox-coupled H-bond network.
Direct observation of redox-dependent structural changes at the K-channel entrance
To support our suggestion, we set out to directly detect the proposed subtle conformational changes by measuring the local protein dynamics at the N-side end of helix 6 in the closed and open state of the K-channel, i.e. in the O and R states of CcO, using picosecond time-resolved fluorescence depolarization experiments. The resulting anisotropy decay curves reveal the rotational dynamics of the protein-bound probe and yield information on global and local protein dynamics as well as on the protein structure and conformational changes.18,22,23,30 Since the probed rotational dynamics of the fluorophore is affected by the motion of the protein segment to which it is covalently attached, we expect to detect nanosecond dynamics changes of helix 6 itself and of the immediate environment including structural constraints imposed by the surrounding helices (i.e., helices 7 and 8, Fig. 1A).We performed data analysis of the anisotropy decay curves (Fig. 3A and S3†) as described previously.18,22 The three main decay components were assigned to the dynamics of (i) the dye itself with a correlation time ϕ1 in the 100–300 ps range, (ii) the helix segment to which the dye is bound to with ϕ2, whose amplitude β2 is related to relative helix mobility  and (iii) the rotation of the whole protein complex (correlation time ϕ3 ∼ 135 ns), whose amplitude β3 represents a measure of steric hindrance of helix 6 motion (Table S1†). The rotational correlation time ϕ2, indicating the dynamics of helix 6, decreases only slightly from 2.7 ns in the oxidized state to 2.4 ns in the reduced state for K299C-AF (Fig. 3B). One helix turns inwards at position 295 (Fig. S3†); however, helix 6 dynamics is much slower in the oxidized state (3.4 ns) but becomes faster upon enzyme reduction with a value of ϕ2 = 2.6 ns. This correlation time is similar to the values at position 299, indicating an increased helix flexibility in the K-channel open state that may extend from the end of helix 6 towards the protein interior upon enzyme reduction. The conformational space of helix 6 movement can be expressed as relative helix mobility
  (Fig. 3B). These data reveal a strong mobility increase of ∼50% at the N-side end of helix 6 upon reduction of the enzyme. Also the probes' motional freedom (amplitude
  ) increases at position 299 by about 70% upon reduction. Together, the increased helix dynamics observed at position 295 (3.4 ns → 2.6 ns) and the helix mobility changes at position 299 demonstrate an increase in flexibility at the end of helix 6 that could be due to partial unfolding of the surface exposed turn of helix 6 in the reduced state (Fig. 1 and 3B, E).
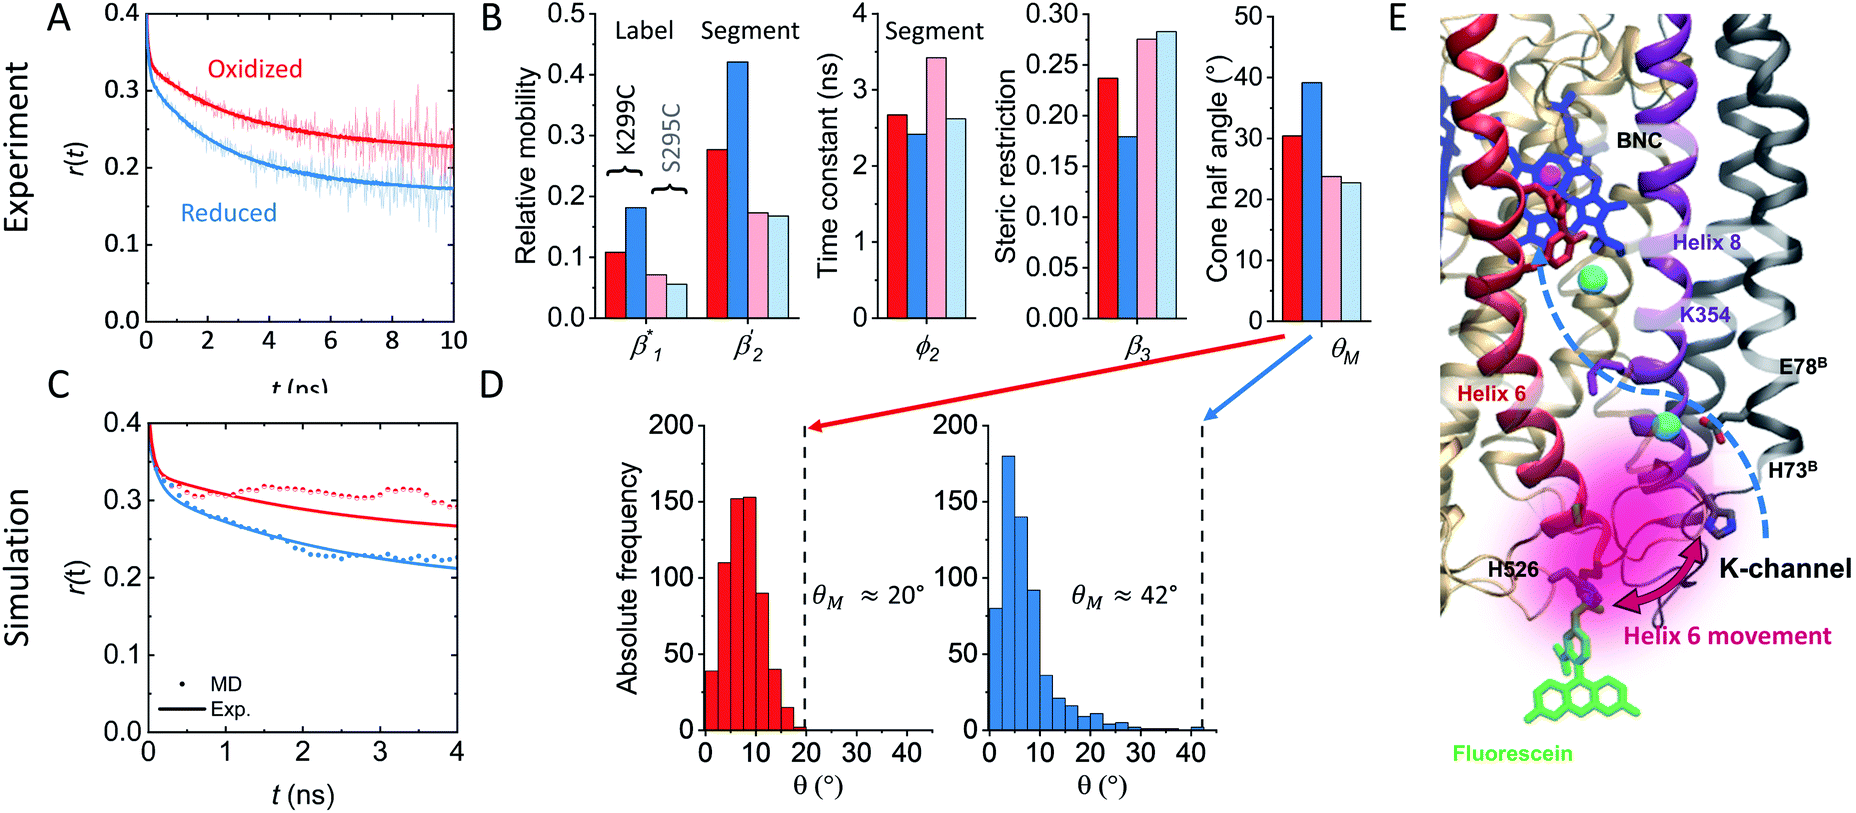 | ||
Fig. 3 (A) Time-resolved fluorescence anisotropy curves of oxidized (red) and reduced (blue) K299C-AF with fit curves. (B) Anisotropy parameters of K299C-AF (dark colors) and S295C-AF (light colors). Segmental (helix 6) relative mobility is calculated as  The fit values are given in Table S1.† (C) Reconstructed anisotropies from (A) and anisotropies from MD simulations. (D) Angular frequency distributions of fluorescein in the O (left) and R (right) state with the maximal semicone angle θM. (E) Structural image highlighting the K-channel (dashed blue line) and helix 6 (red) with indicated flexibility increase. Experimental conditions: 20 mM potassium phosphate buffer pH 8.0, 20 mM NaCl, 0.05% β-DM, 20 °C. The fit values are given in Table S1.† (C) Reconstructed anisotropies from (A) and anisotropies from MD simulations. (D) Angular frequency distributions of fluorescein in the O (left) and R (right) state with the maximal semicone angle θM. (E) Structural image highlighting the K-channel (dashed blue line) and helix 6 (red) with indicated flexibility increase. Experimental conditions: 20 mM potassium phosphate buffer pH 8.0, 20 mM NaCl, 0.05% β-DM, 20 °C. | ||
The observed flexibility changes at the surface-exposed end of helix 6 might be related to a change in the neighboring helices 7 and 8, for which MD simulations suggested an increase in conformational flexibility in the reduced CcO state.15,31 Using the cone-in-a-cone model23 we can directly quantify the conformational space of helix 6 mobility from the anisotropy curve (Fig. 3A). At position 299 we obtain half-cone angles for the motion of helix 6, which increase from 25° in the oxidized to 33° in the reduced state, clearly showing that the helix itself gains more conformational space. By comparing the experimental fluorescence anisotropy decays with the calculated anisotropy decays from the MD simulation (Fig. 3C), which agree well, we can derive the maximal value of the angular frequency distributions of the dye from the MD simulations, which corresponds to the wobbling-in-a-cone half cone angle θM, comprising both label and helix conformational space. The computational data are in very good agreement with the experimental values (Fig. 3B and D), pointing to a higher flexibility and a larger conformational space of helix 6 in the open state of the K-channel (Fig. 3E). Moreover, the data fit to the expectation of a higher flexibility of the surrounding helices upon K-channel activation.15,31
Redox-dependent water dynamics around the K-channel entrance
The hydration shell structure and water dynamics profoundly influence the enzyme function and conformation. Changes in hydration may lead to alterations in local H-bond patterns. The dynamics of water molecules within and at the surface of proteins can vary over several orders of magnitude.32 This is especially true for proton pumps, where water networks and hydrogen-bonded water molecules contribute to the interior of the proton channels to transport protons to their respective targets. These water molecules usually have longer reorientation times and slower diffusivity than bulk water.32 Indeed, a recent theoretical study suggests that water dynamics may play a decisive role in the activation of the K-channel and the proton pumping mechanism of CcO.13Here, we used the solvatochromic dye BADAN as a probe to measure the mean reorientation time of solvent molecules and the corresponding spectral shifts. BADAN undergoes intramolecular charge transfer (ICT) from the dimethylamine group to the carbonyl upon excitation (Fig. 4A). The resulting negative charge on the carbonyl can further be stabilized by a hydrogen bond.17 Different ICT species can be observed depending on the wavelength (Fig. 4A): non-hydrogen-bonded (ICT), immobile hydrogen-bonded (HICTi), and mobile hydrogen-bonded emission (HICTm). When bound to a protein, BADAN was shown to serve as a highly sensitive local probe for solvation dynamics, conformational and H-bond changes.33 Due to its thiol-reactive group, BADAN can be covalently linked to the single reactive cysteines at positions 295 and 299, respectively, in helix 6 of CcO, yielding S295C-ADAN and K299C-ADAN. As shown in Fig. 4B, the K299C-ADAN fluorescence maximum shifts from 21![[thin space (1/6-em)]](https://www.rsc.org/images/entities/char_2009.gif) 120 cm−1 to 20870 cm−1 upon reduction of the enzyme, indicating a more dynamic solvent environment. For S295C-ADAN, on the other hand, almost no shift of the fluorescence maximum was observed. The fluorescence maximum, however, indicates that position 295, although deeper into the protein, experiences a relatively polar solvent environment compared to position 299, probably due to the vicinity of a water molecule.8 Using spectral decomposition with a linear combination of log-normal functions we found mostly hydrogen-bonded emission fractions (HICT) for both label positions (Fig. 4C, right), indicating a solvent-exposed conformation of the BADAN label in agreement with the spectrum of CcO-ADAN lying between BADAN in nonpolar solvents and water (Fig. 4B, left). The spectral decomposition yields three fluorescent species for both oxidized and reduced K295C-ADAN and K299C-ADAN (Fig. 4C and S4, Table S2†). The spectrum of K299C-ADAN that changes the most upon reduction (Fig. 4C) shows a substantial decrease from 40% to 22% in the HICTi component (Fig. 4C, green) favoring the mobile HICTm species (red), thus indicating a substantial increase in water mobility at the surface-exposed end of helix 6. The increase in water dynamics around the position 299 is indicative of a conformational change rearranging the protein–solvent interface close to the entrance of the open K-channel. To further corroborate our findings, we calculated the Red–Ox difference excitation–emission spectrum, i.e., the differences between the reduced and the oxidized CcO forms (Fig. 4D). We observed the same behavior as in Fig. 4C. The disappearance of the HICTi fraction (at ∼22000 cm−1) at the expense of a higher amount of the HICTm fraction (at ∼19500 cm−1) is clearly visible through all excitation wavelengths for reduced K299C-ADAN (purple-blue colored band vs. yellow-red band). These intensity changes are completely absent in the Red–Ox spectrum of S295C-ADAN. It should be noted that the redshift of the BADAN spectrum could also be induced by label dynamics, but a steric restriction of the label at position 299 is likely not based on the anisotropy results shown in Fig. 3. To directly measure the local solvent dipole dynamics and to support the above conclusions we measured the time-resolved emission spectra (TDFS) for BADAN bound at position 299 (Fig. 4E and S5†). The larger redshift of ΔνSR = 1950 cm−1 in the R state of K299C-ADAN compared to ΔνSR = 1750 cm−1 in O occurs mostly in the sub-picosecond to picoseconds time-domain, which is dominated by solvent relaxation (Fig. 4E). Both TDFS curves are mostly parallel to each other at times longer than 200 ps, a time domain that is dominated by dye–protein interaction. Furthermore, we can rule out that the observed redshift is due to differences in aromatic quenching by nearby histidine or tryptophan residues (Fig. S5†), as excited-state quenching of BADAN would result in a shortening of the lifetime.33 Thus, it follows that the redshift in the reduced state is indeed due to an increase in water dynamics (Fig. 4F). Concomitantly, the average relaxation time decreases by 33%, indicating increased local dipole dynamics (Fig. S5†).
120 cm−1 to 20870 cm−1 upon reduction of the enzyme, indicating a more dynamic solvent environment. For S295C-ADAN, on the other hand, almost no shift of the fluorescence maximum was observed. The fluorescence maximum, however, indicates that position 295, although deeper into the protein, experiences a relatively polar solvent environment compared to position 299, probably due to the vicinity of a water molecule.8 Using spectral decomposition with a linear combination of log-normal functions we found mostly hydrogen-bonded emission fractions (HICT) for both label positions (Fig. 4C, right), indicating a solvent-exposed conformation of the BADAN label in agreement with the spectrum of CcO-ADAN lying between BADAN in nonpolar solvents and water (Fig. 4B, left). The spectral decomposition yields three fluorescent species for both oxidized and reduced K295C-ADAN and K299C-ADAN (Fig. 4C and S4, Table S2†). The spectrum of K299C-ADAN that changes the most upon reduction (Fig. 4C) shows a substantial decrease from 40% to 22% in the HICTi component (Fig. 4C, green) favoring the mobile HICTm species (red), thus indicating a substantial increase in water mobility at the surface-exposed end of helix 6. The increase in water dynamics around the position 299 is indicative of a conformational change rearranging the protein–solvent interface close to the entrance of the open K-channel. To further corroborate our findings, we calculated the Red–Ox difference excitation–emission spectrum, i.e., the differences between the reduced and the oxidized CcO forms (Fig. 4D). We observed the same behavior as in Fig. 4C. The disappearance of the HICTi fraction (at ∼22000 cm−1) at the expense of a higher amount of the HICTm fraction (at ∼19500 cm−1) is clearly visible through all excitation wavelengths for reduced K299C-ADAN (purple-blue colored band vs. yellow-red band). These intensity changes are completely absent in the Red–Ox spectrum of S295C-ADAN. It should be noted that the redshift of the BADAN spectrum could also be induced by label dynamics, but a steric restriction of the label at position 299 is likely not based on the anisotropy results shown in Fig. 3. To directly measure the local solvent dipole dynamics and to support the above conclusions we measured the time-resolved emission spectra (TDFS) for BADAN bound at position 299 (Fig. 4E and S5†). The larger redshift of ΔνSR = 1950 cm−1 in the R state of K299C-ADAN compared to ΔνSR = 1750 cm−1 in O occurs mostly in the sub-picosecond to picoseconds time-domain, which is dominated by solvent relaxation (Fig. 4E). Both TDFS curves are mostly parallel to each other at times longer than 200 ps, a time domain that is dominated by dye–protein interaction. Furthermore, we can rule out that the observed redshift is due to differences in aromatic quenching by nearby histidine or tryptophan residues (Fig. S5†), as excited-state quenching of BADAN would result in a shortening of the lifetime.33 Thus, it follows that the redshift in the reduced state is indeed due to an increase in water dynamics (Fig. 4F). Concomitantly, the average relaxation time decreases by 33%, indicating increased local dipole dynamics (Fig. S5†).
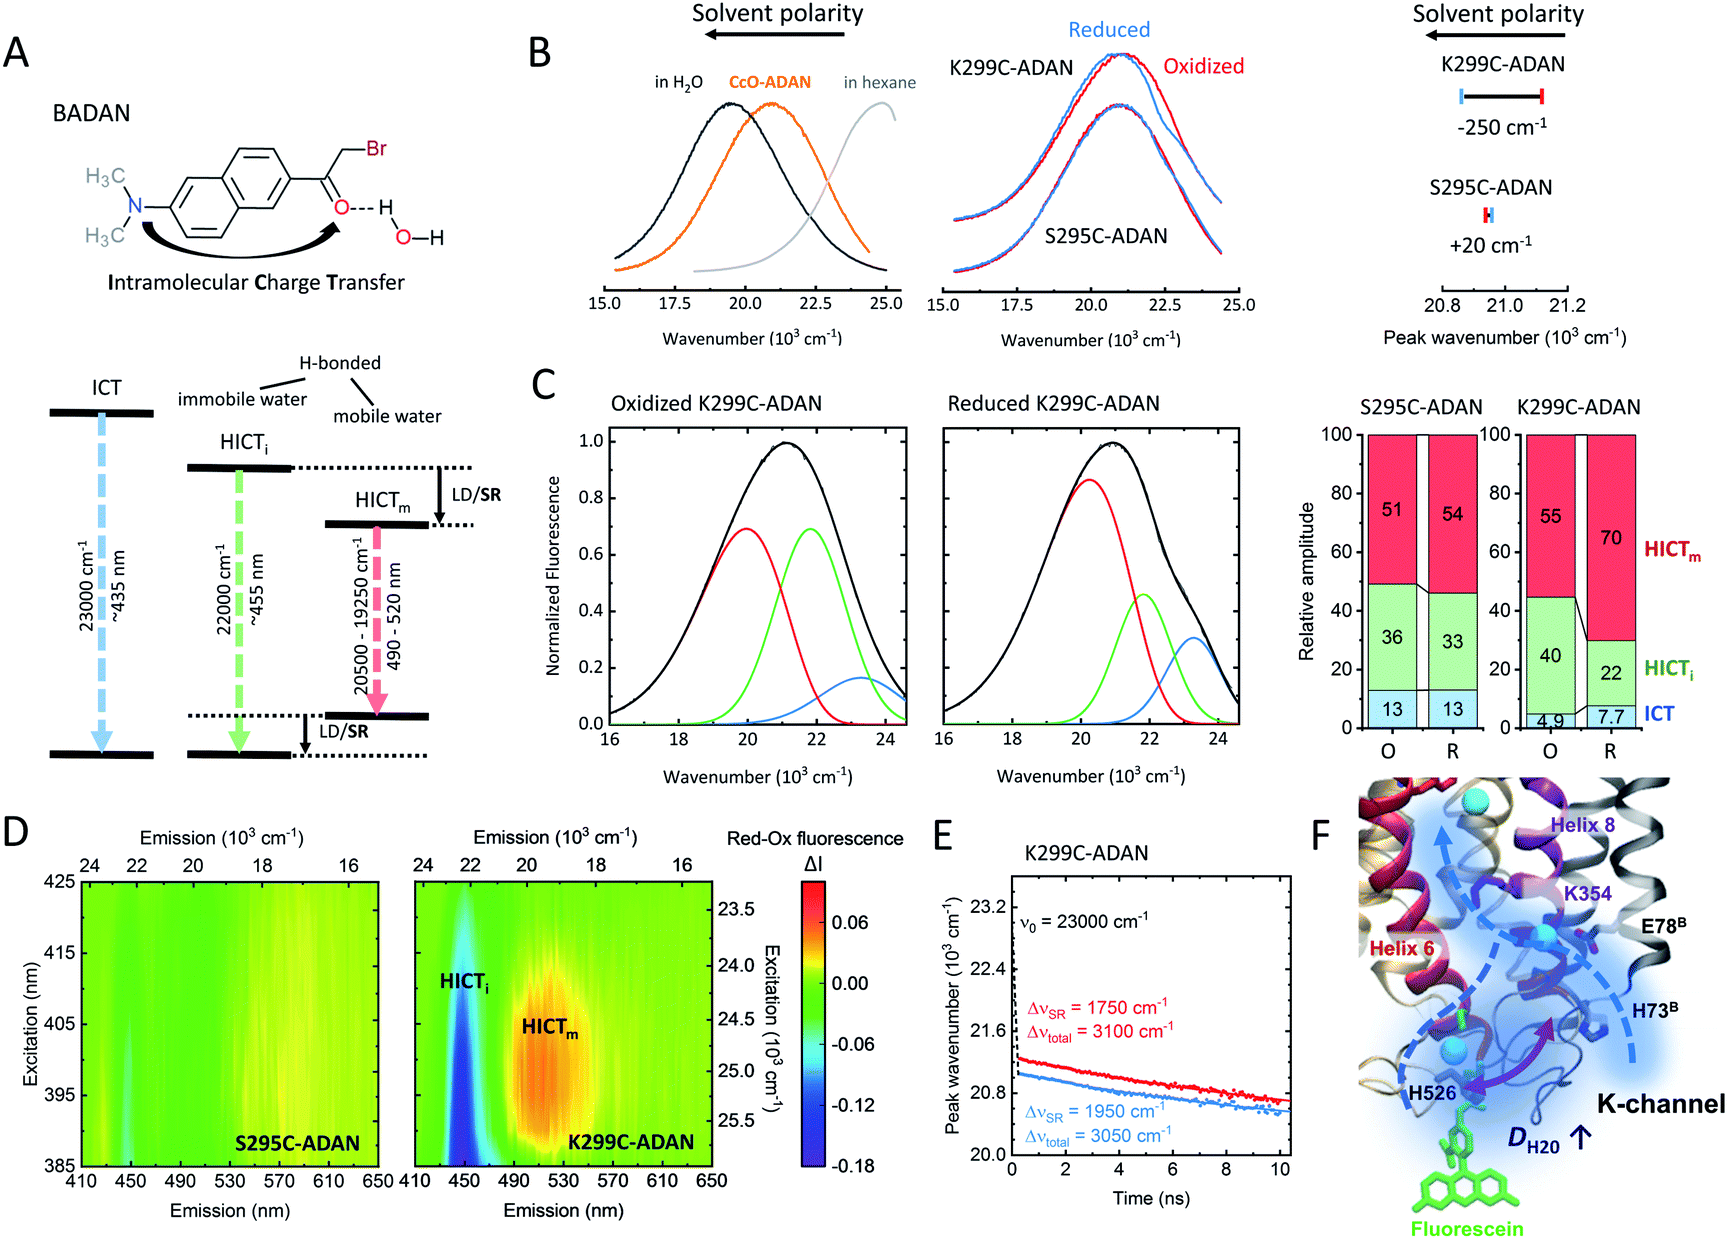 | ||
| Fig. 4 (A) Chemical structure of BADAN and Jablonski diagram for the three fluorescence species (adapted from ref. 17). ICT: intramolecular charge transfer, HICTi/m: immobile and mobile H-bonded ICT, LD: label dynamics, SR: solvent relaxation. (B) Left: Normalized fluorescence of free BADAN in polar (H2O) and nonpolar media as well as labeled to CcO. Middle: Normalized fluorescence emission spectra of oxidized (red) and reduced (blue) K299C-ADAN and S295C-ADAN. Right: Corresponding emission peak positions. Peak wavenumbers were determined through Gaussian fitting with an accuracy of 20 cm−1. (C) Spectral log-normal decomposition of oxidized and reduced K299C-ADAN. (D) Reduced–oxidized steady-state excitation–emission difference spectra of both CcO-ADAN conjugates. (E) TDFS of oxidized and reduced K299C-ADAN. (F) Scheme showing the increase in water mobility at the K-channel entrance upon CcO reduction. Experimental conditions: 20 mM potassium phosphate buffer at pH 8.0, 20 mM NaCl, 0.05% β-DM, 20 °C. Measurement accuracy: 1 nm. Experiments were performed twice. | ||
Similar to the results presented in this study, a higher protein flexibility and a partial opening for mobile water molecules were also suggested to be essential for proton uptake of the light-driven proton pump bacteriorhodopsin.34,35 In the case of the redox pump CcO, our experimental results show that the local conformational change at the end of helix 6 (Fig. 3C) is tightly correlated with a strong increase in water dynamics at the surface of CcO close to the K-channel entrance (Fig. 4F).
Conclusions
Our combined theoretical–experimental study provides answers for two important questions: (1) how protons can be taken up from the protein outside into a relatively dry proton transport channel, and (2) how this process is regulated by the activation of cofactors. The key findings from the K-channel of CcO, the terminal enzyme of the electron transport chain, are the following. Alterations of H-bond networks through conformational changes propagate from the buried cofactor to the protein surface and establish themselves as subtle changes in helix dynamics and changes of proton affinities at the protein surface. The subtle changes in helix dynamics in turn are correlated with increased water dynamics at the protein–water interface of the channel. The conformational change is triggered by the redox-state of the BNC cofactor and thereby establishes a long-range cause–effect relationship between the cofactors and the channel opening at the protein surface. Central to this conformational change is helix 6 (Fig. 1A).Located on helix 6 is the “catalytic tyrosine” Y280 facing towards heme a3 in the active site (Fig. 1A) and lending one proton and one electron to the O2 reduction process.9,36 In the crystal structure of CcO from P. denitrificans,8 the catalytic tyrosine appears to be cross-linked to H276 (Fig. 1A and 3E), presumable to lower its pKa for efficient proton donation.37,38 Y280 is thought – based on theoretical studies – to undergo a conformational change depending on its protonation state during the catalytic turnover.9 Such a conformational change in the reduced CcO might traverse along helix 6 towards the protein surface in the form of side-chain conformational fluctuations and intricate H-bond rearrangements to increase conformational dynamics at the channel entry. This increase in conformational dynamics was indeed observed in our study (Fig. 3E) and correlates with an increase in local hydration dynamics in the lower part of the K-channel. It can be reasonably assumed that this increase in hydration is connected to the widening of the K-channel and the conformational switch of the essential K354 side chain observed in theoretical studies.11,13 Thereby, the proposed switch to establish a connection from the upper part of the channel to the BNC and to switch activity between the D- and K-channels8,39 seems to be tightly coupled to the lower part of the K-channel. The observed increase in water accessibility around the channel entrance (Fig. 4F) thus provides the missing link to the suggested hydration increase in the upper part of the active channel.11,13 The lower rigidity at the channel's N-side surface in the reduced enzyme can be considered beneficial for proton uptake40 and is supported by our previous flash spectroscopy and fluorescence correlation spectroscopy experiments, showing fast transient proton uptake into the K-channel upon single electron injection.20,28,41
To summarize, we propose that the redox-center of CcO and the K-channel surface constitute a long-range interaction network enabling a steadfast proton supply upon “demand” triggered through the electronation of the BNC in the oxidized state. In essence, this cause–effect relationship enables conformational changes that propagate by restructuring of extended H-bond networks thus denoting a fundamental mechanistic principle. In a more general way, our result advances the understanding of the mechanism by which membrane proteins are able to translocate ions to an embedded cofactor and/or across the membrane.
Author contributions
U. A. and E. W. K. designed the research; J. D. performed MD simulations; A. W. performed experiments; A. W. and J. W. prepared the samples; A. W., J. D., J. S., E. W. K. and U. A. analyzed the data; A. L. W. and M. H. contributed to MD simulations; J. D., A. W., J. B., E. W. K. and U. A. wrote the paper.Conflicts of interest
There are no conflicts to declare.Acknowledgements
This work was funded by the Deutsche Forschungsgemeinschaft (DFG)/German Research Foundation via SFB1078, Projects A2 (U. Alexiev), and C2 (E. W. Knapp). J. Dragelj acknowledges funding by the DFG under Germany's Excellence Strategy – EXC 2008/1 – 390540038. We thank Prof. Hartmut Michel and Dr Hao Xie for very helpful discussions.References
- S. Arnold, Mitochondrion, 2012, 12, 46–56 CrossRef CAS PubMed.
- S. Yoshikawa and A. Shimada, Chem. Rev., 2015, 115, 1936–1989 CrossRef CAS PubMed.
- S. Iwata, C. Ostermeier, B. Ludwig and H. Michel, Nature, 1995, 376, 660–669 CrossRef CAS PubMed.
- M. K. F. Wikström, Nature, 1977, 266, 271–273 CrossRef PubMed.
- P. Brzezinski and R. B. Gennis, J. Bioenerg. Biomembr., 2008, 40, 521–531 CrossRef CAS PubMed.
- M. Rak, P. Benit, D. Chretien, J. Bouchereau, M. Schiff, R. El-Khoury, A. Tzagoloff and P. Rustin, Clin. Sci., 2016, 130, 393–407 CrossRef CAS PubMed.
- R. K. Chaturvedi and M. F. Beal, Free Radical Biol. Med., 2013, 63, 1–29 CrossRef CAS PubMed.
- J. Koepke, E. Olkhova, H. Angerer, H. Muller, G. Peng and H. Michel, Biochim. Biophys. Acta, 2009, 1787, 635–645 CrossRef CAS PubMed.
- V. Sharma and M. Wikström, Biochim. Biophys. Acta, Bioenerg., 2016, 1857, 1111–1115 CrossRef CAS PubMed.
- V. Sharma, G. Enkavi, I. Vattulainen, T. Rog and M. Wikstrom, Proc. Natl. Acad. Sci. U. S. A., 2015, 112, 2040–2045 CrossRef CAS PubMed.
- A. L. Woelke, G. Galstyan and E. W. Knapp, Biochim. Biophys. Acta, Bioenerg., 2014, 1837, 1998–2003 CrossRef CAS PubMed.
- C. Y. Son, A. Yethiraj and Q. Cui, Proc. Natl. Acad. Sci. U. S. A., 2017, 114, E8830–E8836 CrossRef CAS PubMed.
- S. Supekar and V. R. I. Kaila, Chem. Sci., 2018, 9, 6703–6710 RSC.
- J. Liu, C. Hiser and S. Ferguson-Miller, Biochem. Soc. Trans., 2017, 45, 1345 CrossRef CAS PubMed.
- L. Qin, J. Liu, D. A. Mills, D. A. Proshlyakov, C. Hiser and S. Ferguson-Miller, Biochemistry, 2009, 48, 5121–5130 CrossRef CAS PubMed.
- E. Fischermeier, P. Pospíšil, A. Sayed, M. Hof, M. Solioz and K. Fahmy, Angew. Chem., Int. Ed., 2017, 56, 1269–1272 CrossRef CAS PubMed.
- R. B. M. Koehorst, R. B. Spruijt and M. A. Hemminga, Biophys. J., 2008, 94, 3945–3955 CrossRef CAS PubMed.
- U. Alexiev, I. Rimke and T. Pohlmann, J. Mol. Biol., 2003, 328, 705–719 CrossRef CAS PubMed.
- A. Wolf, J. Wonneberg, J. Balke and U. Alexiev, FEBS J., 2019 DOI:10.1111/febs.15084.
- K. Kirchberg, H. Michel and U. Alexiev, Biochim. Biophys. Acta, Bioenerg., 2013, 1827, 276–284 CrossRef CAS PubMed.
- U. Alexiev, P. Scherrer, T. Marti, H. G. Khorana and M. P. Heyn, FEBS Lett., 1995, 373, 81–84 CrossRef CAS PubMed.
- K. Kirchberg, T. Y. Kim, M. Möller, D. Skegro, G. D. Raju, J. Granzin, G. Buldt, R. Schlesinger and U. Alexiev, Proc. Natl. Acad. Sci. U. S. A., 2011, 108, 18690–18695 CrossRef CAS PubMed.
- G. F. Schröder, U. Alexiev and H. Grubmuller, Biophys. J., 2005, 89, 3757–3770 CrossRef PubMed.
- A. V. Pisliakov, P. K. Sharma, Z. T. Chu, M. Haranczyk and A. Warshel, Proc. Natl. Acad. Sci. U. S. A., 2008, 105, 7726–7731 CrossRef CAS PubMed.
- Y. C. Kim, M. Wikstrom and G. Hummer, Proc. Natl. Acad. Sci. U. S. A., 2009, 106, 13707–13712 CrossRef CAS PubMed.
- I. Kim and A. Warshel, Proc. Natl. Acad. Sci. U. S. A., 2016, 113, 7810–7815 CrossRef CAS PubMed.
- S. Chakrabarty, I. Namslauer, P. Brzezinski and A. Warshel, Biochim. Biophys. Acta, Bioenerg., 2011, 1807, 413–426 CrossRef CAS PubMed.
- K. Kirchberg, H. Michel and U. Alexiev, J. Biol. Chem., 2012, 287, 8187–8193 CrossRef CAS PubMed.
- A. S. F. Oliveira, S. R. R. Campos, A. M. Baptista and C. M. Soares, Biochim. Biophys. Acta, Bioenerg., 2016, 1857, 759–771 CrossRef CAS PubMed.
- P. Volz, N. Krause, J. Balke, C. Schneider, M. Walter, F. Schneider, R. Schlesinger and U. Alexiev, J. Biol. Chem., 2016, 291, 17382–17393 CrossRef CAS PubMed.
- L. Buhrow, S. Ferguson-Miller and L. A. Kuhn, Biophys. J., 2012, 102, 2158–2166 CrossRef CAS PubMed.
- D. Laage, T. Elsaesser and J. T. Hynes, Chem. Rev., 2017, 117, 10694–10725 CrossRef CAS PubMed.
- P. Pospíšil, K. E. Luxem, M. Ener, J. Sýkora, J. Kocábová, H. B. Gray, A. Vlček and M. Hof, J. Phys. Chem. B, 2014, 118, 10085–10091 CrossRef PubMed.
- H. J. Sass, G. Buldt, R. Gessenich, D. Hehn, D. Neff, R. Schlesinger, J. Berendzen and P. Ormos, Nature, 2000, 406, 649–653 CrossRef CAS PubMed.
- K. Gerwert, E. Freier and S. Wolf, Biochim. Biophys. Acta, 2014, 1837, 606–613 CrossRef CAS PubMed.
- M. Wikström, Biochim. Biophys. Acta, Bioenerg., 2012, 1817, 468–475 CrossRef PubMed.
- X. H. Liu, Y. Yu, C. Hu, W. Zhang, Y. Lu and J. Y. Wang, Angew. Chem., Int. Ed., 2012, 51, 4312–4316 CrossRef CAS PubMed.
- Y. Yu, X. X. Lv, J. S. Li, Q. Zhou, C. Cui, P. Hosseinzadeh, A. Mukherjee, M. J. Nilges, J. Y. Wang and Y. Lu, J. Am. Chem. Soc., 2015, 137, 4594–4597 CrossRef CAS PubMed.
- T. Ghane, R. F. Gorriz, S. Wrzalek, S. Volkenandt, F. Dalatieh, M. Reidelbach and P. Imhof, J. Membr. Biol., 2018, 251, 299–314 CrossRef CAS PubMed.
- Y. Marantz, E. Nachliel, A. Aagaard, P. Brzezinski and M. Gutman, Proc. Natl. Acad. Sci. U. S. A., 1998, 95, 8590–8595 CrossRef CAS PubMed.
- A. Wolf, C. Schneider, T. Y. Kim, K. Kirchberg, P. Volz and U. Alexiev, Phys. Chem. Chem. Phys., 2016, 18, 12877–12885 RSC.
Footnotes |
| † Electronic supplementary information (ESI) available: Experimental and computational methods, supplementary Tables S1, S2 and supplementary Fig. S1–S5. See DOI: 10.1039/c9sc06463j |
| ‡ A. W. and J. D. contributed equally. |
| This journal is © The Royal Society of Chemistry 2020 |