 Open Access Article
Creative Commons Attribution 3.0 Unported Licence
Time-resolved luminescence detection of peroxynitrite using a reactivity-based lanthanide probe†
Colum
Breen
a,
Robert
Pal
 b,
Mark R. J.
Elsegood
 a,
Simon J.
Teat
 c,
Felipe
Iza
d,
Kristian
Wende
 e,
Benjamin R.
Buckley
 a and
Stephen J.
Butler
 *a
*a
aDepartment of Chemistry, Loughborough University, Epinal Way, Loughborough, LE11 3TU, UK. E-mail: S.J.Butler@lboro.ac.uk
bDepartment of Chemistry, Durham University, South Road, Durham, DH1 3LE, UK
cAdvanced Light Source, Berkeley Lab., 1 Cyclotron Road, Berkeley, CA 94720, USA
dCentre for Biological Engineering, Department of Mechanical, Electrical and Manufacturing Engineering, Loughborough University, LE11 3TU, UK
eLeibniz-Institute for Plasma Science and Technology, ZIK plasmatis, Felix-Hausdorff-Str.2, 17489 Greifswald, Germany
First published on 18th February 2020
Abstract
Peroxynitrite (ONOO−) is a powerful and short-lived oxidant formed in vivo, which can react with most biomolecules directly. To fully understand the roles of ONOO− in cell biology, improved methods for the selective detection and real-time analysis of ONOO− are needed. We present a water-soluble, luminescent europium(III) probe for the rapid and sensitive detection of peroxynitrite in human serum, living cells and biological matrices. We have utilised the long luminescence lifetime of the probe to measure ONOO− in a time-resolved manner, effectively avoiding the influence of autofluorescence in biological samples. To demonstrate the utility of the Eu(III) probe, we monitored the production of ONOO− in different cell lines, following treatment with a cold atmospheric plasma device commonly used in the clinic for skin wound treatment.
Introduction
Peroxynitrite (ONOO−) is a highly reactive nitrogen species generated from the spontaneous reaction between superoxide (O2−) and nitric oxide (NO). In cells, ONOO− is generated predominantly in the mitochondria and is involved in cellular signalling processes, via nitration of tyrosine residues on proteins and nitrosylation of protein thiols.1–4 In contrast, elevated levels of ONOO− can lead to significant oxidative and nitrosative damage to lipids, proteins and DNA and has been implicated in several diseases including Alzheimer's, Huntington's, and Parkinson's disease.5–7 Therefore, ONOO− has become a very important target for detection in a cellular environment.The ability to detect ONOO− selectively would facilitate a better understanding of its roles in cellular biology, disease diagnosis, and therapies based on redox signalling events (e.g. photodynamic therapy and radiotherapy).8 In recent years, cold atmospheric plasma (CAP) has emerged as a promising new biomedical technology for the treatment of chronic wounds and cancer (e.g. breast, skin, lung, and pancreatic cancer).9–11 The therapeutic effects of CAP are linked to the high concentrations of reactive oxygen and nitrogen species (RONS) generated by the plasma.12
In chronic wound treatment, plasma generated NO and ONOO− are proposed to break down bacterial biofilm by interacting with the lipid membrane, forming pores that facilitate further RONS ingress.13,14 The selective killing of cancer cells by plasma has been attributed to high levels of RONS (e.g. NO, ONOO−, H2O2), which exceeds the cancer cell's compromised oxidative defence mechanisms.9 Despite the importance of RONS in plasma-based cell therapy, very little is known about the specific interactions between plasma and biological samples. To elucidate the mechanisms that deliver plasma generated RONS to cells and tissues, improved methods for the precise measurement of specific RONS are needed.
Detecting ONOO− is particularly difficult due to its very short lifetime (10 ms) and propensity to react, forming longer-lived species (NO3−). A traditional assay for ONOO− detection involves immunostaining of 3-nitrotyrosine;15 however, this approach is not applicable for live-cell imaging studies. In recent years, fluorescent molecular probes have emerged as attractive tools for imaging ONOO− in a cellular environment. A series of reactivity-based probes have been devised that signal ONOO− by a change in fluorescence.16a–e Notwithstanding some notable exceptions,16b,e the majority of existing ONOO− probes have limitations in performance, due to their lack of solubility in 100% aqueous media, limited selectivity for ONOO− over other RONS (e.g. NO, hypochlorite, hydroxyl radicals), and relatively slow response times, which prevents real-time measurements. One major difficulty encountered with organic probes stems from their short-lived fluorescence, which can be difficult to distinguish from the background fluorescence of biomolecules, often precluding accurate measurements of ONOO−.17
Luminescent lanthanide probes offer unique photophysical advantages over classical organic fluorescent probes,18,19 including: (1) long emission lifetimes that enable time-gated and time-resolved measurements, thereby increasing precision and signal to noise;20,21 (2) well-defined emission bands that may vary in intensity in response to specific analytes, allowing quantitative analysis;22 and (3) large separations between the absorption and emission spectra, which minimises self-quenching processes. Several water-soluble lanthanide complexes have been developed into effective cellular imaging probes, which localise to specific subcellular compartments and report on target species with high spatial and temporal resolution.23,24 A few lanthanide probes have been developed to detect ONOO−;25,26 however, their sensing mechanisms rely upon quenching of an excited state complex, involving charge transfer with the electron rich ONOO−. Such probes are limited in cellular imaging applications because other electron rich species present in the cell (e.g. urate, ascorbate) are known to induce excited state quenching,27,28 and could also give rise to the observed decrease in luminescence.
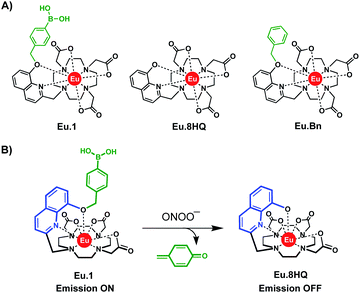
In this work, we report the design and synthesis of a water-soluble, luminescent Eu(III) complex, Eu.1 (Fig. 1A) for the time-resolved detection of ONOO− in human blood serum and living cells. The probe comprises a quinoline antenna functionalised at the 8-position with a benzyl boronic acid, which undergoes rapid oxidative cleavage in the presence of ONOO− to reveal an 8-hydroxyquinoline unit, which shuts down energy transfer to the Eu(III) ion and switches off luminescence (Fig. 1B). Eu.1 displays nanomolar sensitivity to ONOO− and provides a long-lived luminescence signal, which permits time-resolved measurements of ONOO−, completely eliminating background autofluorescence from the biological sample. To demonstrate its utility in cellular applications, the probe was used to quantify ONOO− in different cell lines, following treatment with a commercial plasma device, CAP jet kINPEN® MED, clinically used to foster chronic and acute wound healing.
Results and discussion
Probe design, synthesis and characterisation
Probe Eu.1 is based on a nonadentate macrocyclic ligand, possessing a single coordinating quinoline group that acts as an efficient sensitizer of Eu(III) emission. The quinoline unit binds to the Eu(III) ion in a bidentate manner, effectively shielding the metal centre from surrounding water molecules, thereby enhancing the emission intensity and lifetime of Eu.1. The probe is functionalised with a benzyl boronic acid group, which we envisaged would react rapidly and selectively with ONOO−, causing oxidative cleavage to reveal an 8-hydroxyquinoline unit, which prevents energy transfer to the Eu(III) ion and triggers a decrease in time-resolved luminescence (Fig. 1B). The probe exploits the considerably higher reactivity of phenyl boronic acids towards ONOO− (k ≈ 106 M−1 s−1) at physiological pH, compared with other RONS (e.g. H2O2, k ≈ 2.2 M−1 s−1).29 A control complex, Eu.Bn (Fig. 1A), lacking the boronic acid moiety, was synthesised to validate the response of Eu.1 towards ONOO−. Additionally, Eu.8HQ, the expected product of the reaction between Eu.1 and ONOO−, was synthesised to confirm its lack of luminescence in water.Full details of the synthesis of Eu.1, Eu.Bn and Eu.8HQ are provided in the ESI.† Briefly, Eu.1 was synthesised starting from 8-hydroxyquinoline-2-carboxaldehyde, which was O-alkylated with 4-iodobenzyl bromide, followed by reduction of the aldehyde to the primary alcohol. Subsequent mesylation of the methyl alcohol and alkylation onto a tert-butyl protected DO3A gave the macrocyclic ligand, which was deprotected and complexed with EuCl3. The Eu(III) complex was subjected to a Miyaura borylation to provide Eu.1 after purification by reverse-phase HPLC.
Selected photophysical data for Eu.1, Eu.Bn, and Eu.8HQ are provided in Table 1. The UV-Vis absorption spectra of Eu.1 and Eu.Bn in water are similar and feature a broad band centred at 321 nm (Fig. 2A). In contrast, Eu.8HQ displays a significantly red-shifted band centred at 384 nm (Fig. 2B), which may be associated with a charge-transfer transition, involving transfer of charge density from the quinoline oxygen atom to the quinoline unit.32 The emission properties of Eu.1 and Eu.8HQ in buffered aqueous solution (100 mM PBS, pH 7.4) were very different (Fig. 2). Eu.1 displayed significant Eu(III) centred luminescence with a quantum yield of 10% (λexc = 321 nm). The emission spectrum is characterised by three components in the ΔJ = 1 band (585–605 nm), indicating a structure of low symmetry, and a prominent ΔJ = 2 (605–630 nm) band. In contrast, Eu.8HQ was found to be very weakly emissive (ϕem < 0.5%) over the pH range 4–10 (Fig. 2B and S2†), when excited at either 321 nm or 384 nm. The weak luminescence of Eu.8HQ can be attributed to the low lying excited state of the 8-hydroxyquinolinate group (around 17![[thin space (1/6-em)]](https://www.rsc.org/images/entities/char_2009.gif) 100 cm−1),33 and its inability to effectively populate the Eu(III) excited state.34 The free ligand 8HQ is also nonfluorescent (Fig. S3†), consistent with efficient non-radiative decay of the 8-hydroxyquinoline excited state, due to intermolecular proton transfer.35,36 In support of this hypothesis, strong fluorescence was observed for the iodo-ligand precursor to Eu.1 (Fig. S3†), in which the benzyl ether prevents non-radiative energy loss via a proton transfer mechanism.
100 cm−1),33 and its inability to effectively populate the Eu(III) excited state.34 The free ligand 8HQ is also nonfluorescent (Fig. S3†), consistent with efficient non-radiative decay of the 8-hydroxyquinoline excited state, due to intermolecular proton transfer.35,36 In support of this hypothesis, strong fluorescence was observed for the iodo-ligand precursor to Eu.1 (Fig. S3†), in which the benzyl ether prevents non-radiative energy loss via a proton transfer mechanism.
| Complex | λ max/nm | ε/M−1 cm−1 | ϕ em /% | τ H2O/ms | τ D2O/ms | q |
|---|---|---|---|---|---|---|
| a Errors in quantum yields and lifetimes are ±15%. b Values of hydration state, q (±20%) were derived using literature methods.30 Values for Eu.Bn in parentheses were determined in water previously, by Williams.31 | ||||||
| Eu.1 | 321 | 2800 | 10 | 0.52 | 0.66 | 0.2 |
| Eu.8HQ | 382 | 2100 | <0.5 | 0.33 | 0.42 | 0.5 |
| Eu.Bn | 321 | 2600 (2560) | 6 (6) | 0.58 (0.37) | 0.72 (0.44) | 0.1 (0.2) |
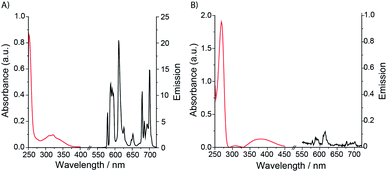 | ||
| Fig. 2 Absorption and emission spectra of (A) Eu.1 (25 μM, λexc = 321 nm, λem = 550–720 nm); (B) Eu.8HQ (25 μM, λexc = 384 nm, λem = 550–720 nm), measured in aqueous buffer (100 mM PBS, pH 7.4). | ||
Eu.1 possesses a long luminescence lifetime in water (0.52 ms), which increases slightly in D2O (0.66 ms). The hydration state (q value) of Eu.1 was calculated to be 0.2,30 indicating a lack of coordinated water in the first coordination sphere. This was supported by synchrotron X-ray analysis of the crystal structure of Eu.1 (Fig. 3; CCDC 1965719, see ESI† for further details), grown from slow evaporation of an aqueous solution. The Eu(III) ion is encapsulated by the nonadentate ligand in a twisted square antiprismatic geometry, coordinated to four nitrogen atoms from the macrocyclic ring, three oxygen atoms from the carboxylate groups, one nitrogen from the quinoline group and one axial oxygen atom from the quinoline 8-alkoxyl group, inhibiting water access. The nearest water molecules are over 6.5 Å away from the Eu(III) ion (Fig. S4†); such effective shielding from water increases the luminescence of Eu.1, by minimising deactivation of the Eu(III) excited state via energy transfer to O–H vibrations. The structurally related complex, Eu.Bn, has a hydration state close to zero, and is expected to adopt a similar coordination geometry to that of Eu.1, in which the benzyloxy group occupies the axial position, preventing water binding.31 For Eu.8HQ, a q value of 0.5 was found, indicating ‘partial hydration’ of the complex,30 in which a water molecule is bound in the second hydration sphere, possibly held by hydrogen bonds to the quinoline 8-hydroxyl group.
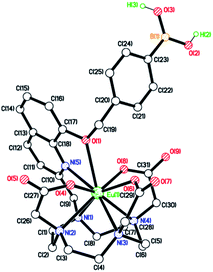 | ||
| Fig. 3 X-ray crystal structure of Eu.1, revealing a lack of water in the first coordination sphere of Eu(III). | ||
Evaluation of Eu.1 for selective detection of peroxynitrite
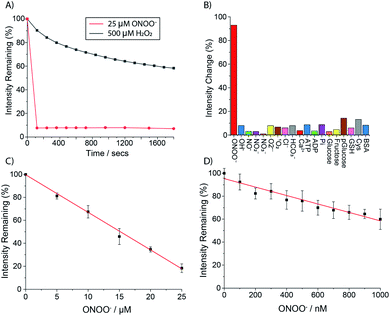
The ability of Eu.1 to detect peroxynitrite was evaluated in aqueous buffer (100 mM PBS pH 7.4). Addition of 1 equivalent of ONOO− to Eu.1 (25 μM) resulted in immediate and almost complete loss of Eu(III) luminescence (Fig. 4A), consistent with rapid oxidative cleavage of the benzyl boronic acid group and quantitative formation of the weakly emissive complex Eu.8HQ. This was confirmed by UV-Vis analysis of the reaction mixture, which showed a characteristic red-shifted band centred at 384 nm, and LC-MS revealed a single peak with m/z = 654.1 corresponding to the single charged complex [Eu.8HQ + H]+ (Fig. S5†). The fast sensing kinetics of Eu.1 is an important feature given the transient nature of ONOO− in biological systems.In contrast, treatment of Eu.1 with 1 equivalent of H2O2 (25 μM), the longest-lived reactive species in cellulo,37 caused a minor (approximately 5%) decrease in emission intensity (Fig. S6†), and a much higher concentration of H2O2 (500 μM) was required to induce a gradual 45% decrease in emission intensity after 20 minutes (Fig. 4A). Treatment of the control complex Eu.Bn with ONOO− or H2O2 under the same conditions resulted in less than 15% change in emission intensity and negligible changes in absorption spectra (Fig. S7†).
The high selectivity of Eu.1 for ONOO− was demonstrated fully by incubating the probe with a range of RONS (100 μM HO˙, NO, NO2−, NO3−, O2˙−, 1O2), as well as common biological cations (e.g. 1 mM Mg2+, Ca2+), anions (1 mM ATP, ADP bicarbonate, chloride) and biomolecules (e.g. BSA, glutathione) (Fig. 4B). The only species that induced a significant (>20%) change in luminescence of Eu.1 was hypochlorite (OCl−); addition of 50 μM OCl− caused a 50% decrease in emission intensity of Eu.1 (Fig. S9†). Considering that the concentration of OCl− in cells is estimated to be less than 1 μM,38 and that it reacts rapidly with endogenous thioethers and amines (e.g. Met = 3.8 × 10⁷, His = 1.0 × 10⁵ M−1 s−1),39,40 it can be assumed that OCl− will not compete for Eu.1 in a cellular environment.
The sensitivity of Eu.1 towards ONOO− was evaluated by incubating the probe with different concentrations of ONOO− and recording the time-resolved emission intensity using a plate reader. Pleasingly, the linear decrease in time-resolved luminescence of Eu.1 can be used to detect ONOO− in the nanomolar concentration range (1–1000 nM) (Fig. 4D). The probe is thus well suited for measuring steady state concentrations of intracellular ONOO−, estimated to be in the nanomolar range.41 Further, the dynamic range of ONOO− detection can be tuned by varying the concentration of Eu.1: incremental addition of ONOO− (1–25 μM) to Eu.1 (25 μM) provided a linear calibration plot (Fig. 4C), suitable for the measurement of micromolar levels of ONOO−. Such levels may be generated in experiments designed to administer reactive species to cells and tissues (e.g. by using ionizing plasma).42–46
Time-resolved measurement of peroxynitrite in human serum
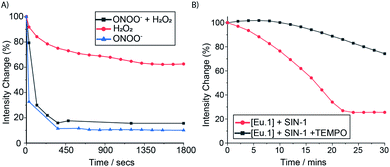
To further demonstrate the high sensitivity and selectivity of Eu.1 for ONOO−, a competition experiment was undertaken in human serum, containing excess H2O2. The time-resolved emission response of Eu.1 towards ONOO−, in the absence and presence of 500 μM H2O2, was essentially the same (Fig. 5A), revealing the ability of Eu.1 to detect ONOO− in biological media, in a background of excess H2O2. Next, the production of ONOO− in human serum was monitored in real time, by incubating Eu.1 with 3-morpholinosydnonimine (SIN-1, 250 μM), which decomposes to release equimolar amounts of NO and O2˙−, leading to spontaneous and sustained production of ONOO− (mimicking cellular ONOO− production). Incubation with SIN-1 caused a 75% reduction in time-resolved luminescence of Eu.1 after approximately 20 minutes (Fig. 5B), corresponding to the formation of approximately 40 μM ONOO−, determined from the linear calibration plot (Fig. S8†). Further, the simultaneous addition of SIN-1 and the superoxide scavenger, TEMPO (2,2,6,6-tetramethylpiperidine-N-oxyl), resulted in a significantly smaller (25%) decrease in time-resolved emission of Eu.1 over a 30 minute period (Fig. 5B), corresponding to the formation of 10 μM ONOO− under these conditions.Cellular uptake and localisation studies
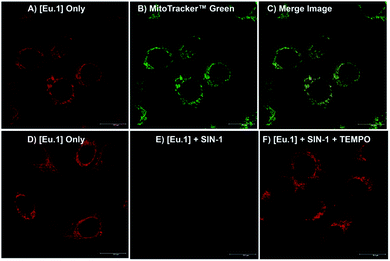
Having shown that Eu.1 can be used to measure the production of micromolar levels of ONOO− in human serum, by gating out short-lived autofluorescence from biological fluorophores, we next investigated the ability of Eu.1 to measure dynamic changes in ONOO− concentration in living cells. First, the cellular uptake behaviour of Eu.1 in HeLa cells was evaluated using fluorescence and laser scanning confocal microscopy (LSCM). Eu.1 (250 μM) was incubated in HeLa cells for 4 hours, resulting in uptake of the Eu(III) complex and predominant localisation to the mitochondria (λexc = 355 nm, λem = 605–720 nm), confirmed by colocalisation studies using MitoTracker Green (λexc = 488 nm, λem = 500–530 nm), which gave a Pearson's coefficient, P = 0.80 (Fig. 6A–C). The preferential distribution of Eu.1 in the mitochondria augured well for the detection of endogenous ONOO−, because the precursor species, NO and O2˙−, react predominately in the mitochondria, and we have previously demonstrated that these reactive species do not interfere with the emission response of Eu.1 (Fig. 4B).A time-lapsed series of images revealed maximum uptake Eu.1 in HeLa cells after 4 hours (Fig. S10A†). Imaging of Eu.1 in the mitochondria was possible over extended time periods (up to 40 hours), during which time the brightness of the observed images did not vary significantly (±15%) and the cells appeared to be healthy and growing. Analysis of ICP-MS data showed that for 4 × 10⁶ HeLa cells incubated with Eu.1 (250 μM), a given cell contained 26 μM (±10%) of Eu.1 (Fig. S10C†), hence the intracellular concentration of the Eu(III) probe reaches 10% of the loading buffer after 4 hours. Cytotoxicity studies were undertaken for Eu.1 at 24 hours using image cytometry assays (involving DAPI and acridine orange stains), which showed an IC50 value of greater than 250 μM (Fig. S10B†). Therefore, it can be assumed that the Eu(III) probe did not exhibit cytotoxicity during the timeframe of these imaging experiments.
Imaging changes in peroxynitrite levels in living cells
Next, HeLa cells stained with Eu.1 were incubated with the ONOO− donor, SIN-1, for 30 minutes. This resulted in a significant (approx. 90%) decrease in emission intensity (Fig. 6E), indicating an increase in mitochondrial ONOO− levels upon SIN-1 stimulation. It is unlikely that any ONOO− generated in the cell culture medium will cross cell membranes;3,41 however, the ability of NO to penetrate cell membranes is known. So, the observed decrease in image brightness is consistent with SIN-1 mediated delivery of NO inside the cell, which combines with superoxide in the mitochondria to form ONOO− spontaneously.2 In contrast, incubation of Eu.1-stained cells with SIN-1 and the superoxide scavenger, TEMPO, induced a significantly smaller (35%) decrease in luminescence compared with untreated cells (Fig. 6F), indicating reduced intracellular formation of ONOO− compared with the SIN-1 treatment alone.The Eu(III) probe remained predominantly in the mitochondria during the time scale of the experiments. Further, ICP-MS analysis of cells treated with SIN-1 (and SIN-1 plus TEMPO), showed less than 10% variation in the concentration of accumulated Eu(III), relative to untreated cells (Fig. S10C†). Therefore, the possibility that incubation with SIN-1 and/or TEMPO promotes efflux of Eu.1 from cells can be ruled out on the timescale of the experiment.
To confirm that the increase in intracellular ONOO− is responsible for the decrease in emission of Eu.1, a control experiment was undertaken using probe Eu.Bn, which lacks the reactive boronic acid moiety. LSCM images, following incubation of HeLa cells with Eu.Bn (250 μM), revealed a similar localisation to the mitochondria (Fig. S12A–C†), although a slightly slower rate of uptake was observed compared with Eu.1 (maximum uptake at 18 hours, Fig. S11†). Crucially, upon treatment of Eu.Bn-stained HeLa cells with SIN-1, less than a 5% decrease in Eu(III) emission intensity was observed, and the simultaneous addition of SIN-1 and TEMPO induced a negligible change in emission intensity (Fig. S12D–G†). Thus, Eu.Bn serves as an effective negative control probe, verifying that the SIN-1 induced change in luminescence of Eu.1 corresponds to an increase in mitochondrial ONOO− levels. Taken together, these live-cell imaging experiments demonstrate the powerful potential of Eu.1 for visualising changes in ONOO− concentration within the mitochondria of living cells.
Time-resolved measurement of peroxynitrite in living cells treated with cold atmospheric plasma
To further demonstrate the biological applications of Eu.1, the probe was used to monitor dynamic changes in ONOO− levels in different cell lines, following treatment with a commercially available cold atmospheric plasma device, kINPEN® MED, which is used in the clinic for skin wound treatment.10 Plasma generated NO and ONOO− are proposed to interact with bacterial cell membranes, forming pores that promote further ingress of RONS. There are multiple mechanisms proposed for the intracellular formation of ONOO−, following plasma treatment.47,48 One mechanism involves plasma generated NO penetrating cell membranes and combining with O2˙− in the mitochondria to form ONOO−. Therefore, we wished to test the ability of Eu.1 to selectively visualise intracellular ONOO−, derived from RONS generated externally by the plasma.First, the expected breakdown of Eu.1 to Eu.8HQ upon treatment with ionizing plasma was confirmed by HR-TOF measurements of buffered aqueous samples containing Eu.1 (Fig. S14†), reflecting the formation of ONOO− in the treated liquid. Next, Eu.1 (250 μM) was incubated with two different cell lines, THP and Jurkat cells, for 24 hours. The cells were centrifuged, washed with 100 mM PBS, and suspended in a glass bottom 96-well plate. Time-resolved luminescence spectra of Eu.1 within the cells were recorded using a microplate reader (Fig. S13†).
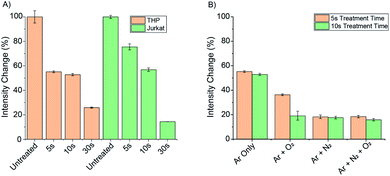
Samples of each cell line were then treated with cold atmospheric plasma using the kINPen® MED device for 5, 10 and 30 seconds (using an argon gas flow) and the change in time-resolved luminescence was recorded (Fig. 7A). For both cell lines, a 75–90% decrease in total emission intensity of Eu.1 was observed after 30 seconds, corresponding to a significant increase in intracellular ONOO−. In THP cells, the emission intensity had decreased by 45% following 5 seconds treatment, whereas Jurkat cells showed a 25% decrease in luminescence under the same conditions, indicating a lower initial level of ONOO− in Jurkat cells.
To investigate the effect of different plasma gases on the intracellular concentration of ONOO−, 0.5% oxygen and 0.5% nitrogen was added individually and in combination to the argon gas flow. THP cells incubated with Eu.1 (250 μM), were then treated with the kINPen® MED device for 5 and 10 seconds using the different gas flows (Fig. 7B). The introduction of 0.5% N2 gas induced a substantial 80% decrease in emission intensity of Eu.1 after 5 seconds, whereas only a 45% decrease in luminescence was observed when using argon gas alone. This correlates with a higher intracellular level of ONOO− when nitrogen is used in the feed gas, consistent with a higher concentration of NO generated by the plasma. This corresponds perfectly with the observed modulation of NO generation by plasmas in pure argon and argon doped with molecular gases, respectively.49,50 Thus, Eu.1 can be used to visualise elevated levels of ONOO− in different cell lines following extracellular treatment with a plasma therapy device.
Conclusions
We have developed a robust, water-soluble luminescent europium(III) probe for the rapid and sensitive detection of ONOO− in living cells. The probe displays excellent selectivity for ONOO− over other RONS, and provides a change in luminescence that is directly proportional to ONOO− concentration in the nanomolar to low micromolar range. The Eu(III) probe offers advantages over classical organic fluorescent probes, including an instantaneous and long-lived luminescence signal, which enables time-resolved measurements of ONOO− to be undertaken, avoiding the influence of autofluorescence in biological samples, thereby enhancing precision and signal-to-noise.To demonstrate the utility of our probe, a plate reader-based assay was developed for the quantification of ONOO− in human serum, with minimal interference from other reactive species, biological cations, anions and protein. The Eu(III) probe was shown to permeate a range of different cell lines and localise preferentially to the mitochondria, allowing the presence of endogenous and/or externally induced ONOO− to be monitored with sub-cellular resolution using fluorescence microscopy. Finally, the Eu(III) probe was applied for the first time in monitoring elevated levels of ONOO− in living cells, following treatment with a cold atmospheric plasma device standardised for clinical applications. The probe design features established in this work will inform the future development of emissive Eu(III)/Tb(III) probes, capable of measuring ONOO− by providing a ratiometric signal that is intrinsically normalised, and thus independent of probe concentration.
In conclusion, the Eu(III) probe can provide valuable insight into the spatial and temporal distribution of ONOO− in cells, enabling a better understanding of its roles in cell biology and the mechanisms of transport of RONS into cells. This could facilitate the development of more effective therapies and devices, tailored to delivering specific levels of ONOO− to targeted sites within cells and enabling safe doses of treatment to be determined.
Conflicts of interest
There are no conflicts to declare.Acknowledgements
This work was supported by Loughborough University's Centre for doctoral training on Gas Plasma Interactions with Organic Liquids, and a Royal Society Research Grant (SJB). RP acknowledges the Royal Society URF scheme. The German Federal Ministry of Education and Research (BMBF), grant no. 03Z22DN12 (KW) supported parts of the work. The experimental contribution of Felix Niessner and Giuliana Bruno is gratefully acknowledged (Leibniz Institute for Plasma Science and Technology). This research used resources of the Advanced Light Source, a DOE Office of Science User Facility under contract no. DE-AC02-05CH11231.Notes and references
- D. B. Graves, J. Phys. D: Appl. Phys., 2012, 45, 263001 CrossRef.
- P. Pacher, J. S. Beckman and L. Liaudet, Physiol. Rev., 2007, 87, 315–424 CrossRef CAS PubMed.
- R. Radi, J. Biol. Chem., 2013, 288, 26464–26472 CrossRef CAS PubMed.
- S. Bartesaghi and R. Radi, Redox Biol., 2018, 14, 618–625 CrossRef CAS PubMed.
- W. H. Koppenol, Quim. Nova, 1998, 21, 326–331 CrossRef CAS.
- G. Spiteller, Free Radical Biol. Med., 2006, 41, 362–387 CrossRef CAS PubMed.
- G. Ferrer-Sueta, N. Campolo, M. Trujillo, S. Bartesaghi, S. Carballal, N. Romero, B. Alvarez and R. Radi, Chem. Rev., 2018, 118, 1338–1408 CrossRef CAS PubMed.
- G. Manda, G. Isvoranu, M. V. Comanescu, A. Manea, B. Debelec Butuner and K. S. Korkmaz, Redox Biol., 2015, 5, 347–357 CrossRef CAS PubMed.
- M. Keidar, Plasma Sources Sci. Technol., 2015, 24, 033001 CrossRef.
- S. Bekeschus, A. Schmidt, K. D. Weltmann and T. von Woedtke, Clin. Plasma Med., 2016, 4, 19–28 CrossRef.
- P. J. Bruggeman, M. J. Kushner, B. R. Locke, J. G. E. Gardeniers, W. G. Graham, D. B. Graves, R. C. H. M. Hofman-Caris, D. Maric, J. P. Reid, E. Ceriani, D. Fernandez Rivas, J. E. Foster, S. C. Garrick, Y. Gorbanev, S. Hamaguchi, F. Iza, H. Jablonowski, E. Klimova, J. Kolb, F. Krcma, P. Lukes, Z. MacHala, I. Marinov, D. Mariotti, S. Mededovic Thagard, D. Minakata, E. C. Neyts, J. Pawlat, Z. L. Petrovic, R. Pflieger, S. Reuter, D. C. Schram, S. Schröter, M. Shiraiwa, B. Tarabová, P. A. Tsai, J. R. R. Verlet, T. Von Woedtke, K. R. Wilson, K. Yasui and G. Zvereva, Plasma Sources Sci. Technol., 2016, 25, 053002 CrossRef.
- G. Lloyd, G. Friedman, S. Jafri, G. Schultz, A. Fridman and K. Harding, Plasma Processes Polym., 2010, 7, 194–211 CrossRef CAS.
- A. Patange, D. Boehm, D. Ziuzina, P. J. Cullen, B. Gilmore and P. Bourke, Int. J. Food Microbiol., 2019, 293, 137–145 CrossRef CAS PubMed.
- C. Hoffmann, C. Berganza and J. Zhang, Med. Gas Res., 2013, 3, 21 CrossRef PubMed.
- R. Radi, Proc. Natl. Acad. Sci. U. S. A., 2004, 101, 4003–4008 CrossRef CAS PubMed.
- (a) X. Sun, Q. Xu, G. Kim, S. E. Flower, J. P. Lowe, J. Yoon, J. S. Fossey, X. Qian, S. D. Bull and T. D. James, Chem. Sci., 2014, 5, 3368–3373 RSC; (b) A. C. Sedgwick, W. T. Dou, J. B. Jiao, L. Wu, G. T. Williams, A. T. A. Jenkins, S. D. Bull, J. L. Sessler, X. P. He and T. D. James, J. Am. Chem. Soc., 2018, 140, 14267–14271 CrossRef CAS PubMed; (c) C. Szíjjártõ, E. Pershagen, N. O. Ilchenko and K. E. Borbas, Chem.–Eur. J., 2013, 19, 3100–3109 CrossRef PubMed; (d) H. Li, X. Li, X. Wu, W. Shi and H. Ma, Anal. Chem., 2017, 89, 5519–5525 CrossRef CAS PubMed; (e) Q. Zhang, Z. Zhu, Y. Zheng, J. Cheng, N. Zhang, Y. T. Long, J. Zheng, X. Qian and Y. Yang, J. Am. Chem. Soc., 2012, 134, 18479–18482 CrossRef CAS PubMed.
- M. C. Y. Chang, A. Pralle, E. Y. Isacoff and C. J. Chang, J. Am. Chem. Soc., 2004, 126, 15392–15393 CrossRef CAS PubMed.
- J. C. G. Bünzli, J. Coord. Chem., 2014, 67, 3706–3733 CrossRef.
- M. C. Heffern, L. M. Matosziuk and T. J. Meade, Chem. Rev., 2014, 114, 4496–4539 CrossRef CAS PubMed.
- C. Szíjjártõ, E. Pershagen, N. O. Ilchenko and K. E. Borbas, Chem.–Eur. J., 2013, 19, 3100–3109 CrossRef PubMed.
- (a) S. H. Hewitt, R. Ali, R. Mailhot, C. R. Antonen, C. A. Dodson and S. J. Butler, Chem. Sci., 2019, 10, 5373–5381 RSC; (b) S. H. Hewitt, J. Parris, R. Mailhot and S. J. Butler, Chem. Commun., 2017, 53, 12626–12629 RSC.
- (a) M. Tropiano and S. Faulkner, Chem. Commun., 2014, 50, 4696–4698 RSC; (b) S. Shuvaev, M. Starck and D. Parker, Chem.–Eur. J., 2017, 23, 9974–9989 Search PubMed; (c) A. B. Aletti, D. M. Gillen and T. Gunnlaugsson, Coord. Chem. Rev., 2018, 354, 98–120 CrossRef CAS.
- (a) S. J. Butler and D. Parker, Chem. Soc. Rev., 2013, 42, 1652–1666 RSC; (b) R. Mailhot, T. Traviss-Pollard, R. Pal and S. J. Butler, Chem.–Eur. J., 2018, 24, 10745–10755 CrossRef CAS PubMed.
- E. Mathieu, A. Sipos, E. Demeyere, D. Phipps, D. Sakaveli and K. E. Borbas, Chem. Commun., 2018, 54, 10021–10035 RSC.
- J. Wu, H. Liu, Y. Yang, H. Wang and M. Yang, Opt. Mater., 2018, 77, 170–177 CrossRef CAS.
- C. Song, Z. Ye, G. Wang, J. Yuan and Y. Guan, Chem.–Eur. J., 2010, 16, 6464–6472 CrossRef CAS PubMed.
- R. A. Poole, F. Kielar, S. L. Richardson, P. A. Stenson and D. Parker, Chem. Commun., 2006, 221, 4084–4086 RSC.
- G. L. Law, D. Parker, S. L. Richardson and K. L. Wong, Dalton Trans., 2009, 8481–8484 RSC.
- A. Sikora, J. Zielonka, M. Lopez, J. Joseph and B. Kalyanaraman, Free Radical Biol. Med., 2009, 47, 1401–1407 CrossRef CAS PubMed.
- A. Beeby, I. M. Clarkson, R. S. Dickins, S. Faulkner, D. Parker, L. Royle, A. S. de Sousa, J. A. G. Williams and M. Woods, J. Chem. Soc., Perkin Trans. 2, 1999, 493–504 RSC.
- D. Maffeo and J. A. G. Williams, Inorg. Chim. Acta, 2003, 355, 127–136 CrossRef CAS.
- G. Farruggia, S. Iotti, L. Prodi, M. Montalti, N. Zaccheroni, P. B. Savage, V. Trapani, P. Sale and F. I. Wolf, J. Am. Chem. Soc., 2006, 128, 344–350 CrossRef CAS PubMed.
- G. Bozoklu, C. Marchal, J. Pécaut, D. Imbert and M. Mazzanti, Dalton Trans., 2010, 39, 9112–9122 RSC.
- J.-C. G. Bunzli and P. Claude, Chem. Soc. Rev., 2005, 34, 1048–1077 RSC.
- S.-Y. Park, P. Ghosh, S. O. Park, Y. M. Lee, S. K. Kwak and O.-H. Kwon, RSC Adv., 2016, 6, 9812–9821 RSC.
- M. Cölle, R. E. Dinnebier and W. Brütting, Chem. Commun., 2002, 49, 2908–2909 RSC.
- G. Bauer, Redox Biol., 2019, 26, 101291 CrossRef CAS PubMed.
- D. Cheng, Y. Pan, L. Wang, Z. Zeng, L. Yuan, X. Zhang and Y.-T. Chang, J. Am. Chem. Soc., 2017, 139, 285–292 CrossRef CAS PubMed.
- D. I. Pattison and M. J. Davies, Chem. Res. Toxicol., 2001, 14, 1453–1464 Search PubMed.
- J. Zielonka, A. Sikora, M. Hardy, J. Joseph, B. P. Dranka and B. Kalyanaraman, Chem. Res. Toxicol., 2012, 25, 1793–1799 Search PubMed.
- G. Ferrer-Sueta and R. Radi, ACS Chem. Biol., 2009, 4, 161–177 CrossRef CAS PubMed.
- B. M. Matata and M. Galiñanes, J. Biol. Chem., 2002, 277, 2330–2335 CrossRef CAS PubMed.
- A. Lin, Y. Gorbanev, J. De Backer, J. Van Loenhout, W. Van Boxem, F. Lemière, P. Cos, S. Dewilde, E. Smits and A. Bogaerts, Adv. Sci., 2019, 6, 1802062 CrossRef PubMed.
- F. Girard, V. Badets, S. Blanc, K. Gazeli, L. Marlin, L. Authier, P. Svarnas, N. Sojic, F. Clément and S. Arbault, RSC Adv., 2016, 6, 78457–78467 RSC.
- F. Girard, M. Peret, N. Dumont, V. Badets, S. Blanc, K. Gazeli, C. Noël, T. Belmonte, L. Marlin, J. P. Cambus, G. Simon, N. Sojic, B. Held, S. Arbault and F. Clément, Phys. Chem. Chem. Phys., 2018, 20, 9198–9210 RSC.
- G. Bauer, Redox Biol., 2019, 26, 101291 CrossRef CAS PubMed.
- B. Tarabová, P. Lukeš, M. U. Hammer, H. Jablonowski, T. von Woedtke, S. Reuter and Z. Machala, Phys. Chem. Chem. Phys., 2019, 21, 8883–8896 RSC.
- P. Lukes, E. Dolezalova, I. Sisrova and M. Clupek, Plasma Sources Sci. Technol., 2014, 23, 015019 CrossRef.
- A. Schmidt-Bleker, R. Bansemer, S. Reuter and K.-D. Weltmann, Plasma Processes Polym., 2016, 13, 1120–1127 CrossRef.
- H. Jablonowski, A. Schmidt-Bleker, K.-D. Weltmann, T. von Woedtke and K. Wende, Phys. Chem. Chem. Phys., 2018, 20, 25387–25398 RSC.
Footnote |
| † Electronic supplementary information (ESI) available. CCDC 1965719. For ESI and crystallographic data in CIF or other electronic format see DOI: 10.1039/c9sc06053g |
| This journal is © The Royal Society of Chemistry 2020 |

