 Open Access Article
Accurate cancer cell identification and microRNA silencing induced therapy using tailored DNA tetrahedron nanostructures†
Juan
Su
a,
Fubing
Wu
b,
Hongping
Xia
*b,
Yafeng
Wu
 *a and
Songqin
Liu
 *a
*a
aJiangsu Engineering Laboratory of Smart Carbon-Rich Materials and Device, School of Chemistry and Chemical Engineering, Southeast University, Nanjing 211189, China
bDepartment of Pathology, School of Basic Medical Sciences, Department of Oncology, The Affiliated Sir Run Run Hospital, State Key Laboratory of Reproductive Medicine, Key Laboratory of Antibody Technique of National Health Commission, Nanjing Medical University, Nanjing 211166, China
First published on 5th November 2019
Abstract
Accurate cancer cell identification and efficient therapy are extremely desirable and challenging in clinics. Here, we reported the first example of DNA tetrahedron nanostructures (DTNSs) to real-time monitor and image three intracellular miRNAs based on the fluorescence “OFF” to “ON” mode, as well as to realize cancer therapy induced by miRNA silencing. DTNSs were self-assembled by seven customized single-stranded nucleic acid chains containing three recognition sequences for target miRNAs. In the three vertexes of DTNSs, fluorophores and quenchers were brought into close proximity, inducing fluorescence quenching. In the presence of target miRNAs, fluorophores and quenchers would be separated, resulting in fluorescence recovery. Owing to the unique tetrahedron-like spatial structure, DTNSs displayed improved resistance to enzymatic digestion and high cellular uptake efficiency, and exhibited the ability to simultaneously monitor three intracellular miRNAs. DTNSs not only effectively distinguished tumor cells from normal cells, but also identified cancer cell subtypes, which avoided false-positive signals and significantly improved the accuracy of cancer diagnosis. Moreover, the DTNSs could also act as an anti-cancer drug; antagomir-21 (one recognition sequence) was detached from DTNSs to silence endogenous miRNA-21 inside cells, which would suppress cancer cell migration and invasion, and finally induce cancer cell apoptosis; the result was demonstrated by experiments in vitro and in vivo. It is anticipated that the development of smart nanoplatforms will open a door for cancer diagnosis and treatment in clinical systems.
Introduction
Accurate identification of cancer at an early stage plays an important role in cancer diagnosis and treatment. MicroRNAs (miRNAs) are a kind of cancer biomarker; their aberrant expression levels are closely related to the initiation and progression of cancers,1–4 and therefore, sensitive detection of tumor related miRNAs holds great promise for cancer diagnostics and prognostics.5–8 Furthermore, simultaneous detection of multiple tumor related miRNAs can avoid false-positive signals and enhance the accuracy of cancer diagnosis. With the development of nanomaterials, a variety of nanoprobes have been reported for the detection of multiple miRNAs.9–12 For example, the Tang group developed multicolor fluorescent nanoprobes based on gold nanoparticles (GNPs) for evaluating cellular migration and invasion by simultaneously imaging miRNA-221, PTEN mRNA and MMP9 in living cells.13 The Zhu group assembled multicomponent nucleic acid enzymes onto the surface of mesoporous silica-coated gold nanorods as multifunctional nanodevices for intracellular miRNA-21 and miRNA-145 in situ imaging.14 However, the preparation processes of these nanoprobes are often complicated and time-consuming, and their stability, biocompatibility and cell permeation ability are also not satisfactory for in vivo diagnosis, which has driven researchers to find other substitutes. DNA tetrahedron nanostructures have attracted enormous interest owing to their unique advantages, such as ease of self-assembly, excellent biocompatibility, high nuclease stability, remarkable transmembrane capability through a caveolin-dependent pathway and availability for multiple modifications.15–18To significantly improve the survival rate of cancer patients, besides accurate cancer identification, an efficient treatment strategy is another crucial step. Gene silencing as a kind of gene therapy has now been considered as one of the most promising options to overcome the limitations of traditional cancer therapy.19–21 It can induce sequence-specific inhibition of oncogene expression or translation through the delivery of antagomirs to cancer cells, which makes it possess advantages of high specificity, improved safety, high efficacy and unrestricted choice of targets.22,23 For example, leucine-rich repeat-containing G protein-coupled receptor 5 (Lgr5) is a novel gastric cancer marker, and silencing its expression with antagomirs could efficiently inhibit cancer angiogenesis.24 miR-10b was overexpressed in metastatic breast tumor patients, and silencing of miR-10b with antagomirs could significantly decrease miR-10b levels and suppress breast cancer metastasis.25 miRNA-21 as a key oncogenic miRNA was widely overexpressed in various tumors and participated in tumor occurrence and development. Inhibition of endogenous miRNA-21 with antagomirs could suppress cancer cell proliferation, migration and invasion, and tumor growth.26,27
In biomedical science, developing nanomaterials that integrating both ultrasensitive diagnosis and highly efficient therapy functions remains attractive and challenging.28,29 In this work, we reported the first example of vertebral-shaped DNA tetrahedron nanostructures (DTNSs) for accurate cancer identification and miRNA silencing induced therapy. Based on the fluorescence “OFF” to “ON” mode, three intracellular miRNAs (miRNA-21, miRNA-122 and miRNA-194) were simultaneously monitored and imaged, which not only effectively distinguished tumor cells from normal cells, but also identified cancer cell subtypes, and thus the accuracy of cancer diagnosis was significantly improved. In miRNA-21 overexpressed cancer cells, antagomir-21 (one recognition sequence) was detached from DTNSs to silence endogenous miRNA-21 inside cells, which would suppress cancer cell migration and invasion, and finally induce cancer cell apoptosis. The prepared DTNSs displayed improved resistance to enzymatic digestion and high cellular uptake efficiency, and exhibited accurate cancer identification and efficient cancer therapy ability.
Results and discussion
Preparation and characterization of DNA tetrahedron nanostructures (DTNSs)
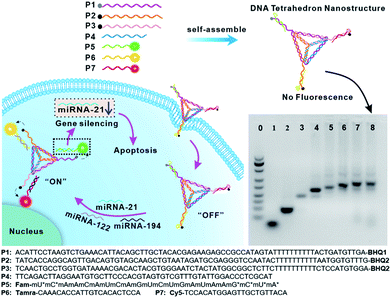
The DTNSs were prepared with seven customized single-stranded nucleic acid chains (P1–P7) through a simple thermal annealing method (Fig. 1). Four chains (P1–P4), partially complementing each other, would spontaneously and respectively fold into triangles and then assemble into a rigid tetrahedron (named TDN). Three sequences linked with quenchers (BHQ1 for FAM, BHQ2 for TAMRA and Cy5) were distributed in the vertexes of the tetrahedron, respectively, and were complementary to the recognition sequence in P5–P7 chains. Fluorescein FAM labeled P5, TAMRA labeled P6 and Cy5 labeled P7 were introduced into the above tetrahedron based on the principles of Watson–Crick base pairing to form DTNSs. The formation of DTNSs was identified by agarose gel electrophoresis analysis (inset in Fig. 1). For lanes 1 and 2, only a single band was observed, indicating that fluorescence or quenching group modified nucleic acid chains maintained good purity. With the step-by-step addition of chains from lane 3 to lane 8, there clearly appeared a gradual reduction of electrophoretic mobility, which could be ascribed to the increasing molecular mass and more complicated spatial construction of assemblies. The AFM image further verified the successful formation of the DTNSs, as shown in Fig. S1,† and the prepared DTNSs were vertebral-shaped nanoparticles with a diameter of ∼3 nm.Fluorescence quenching and recovery capability of the prepared DTNSs
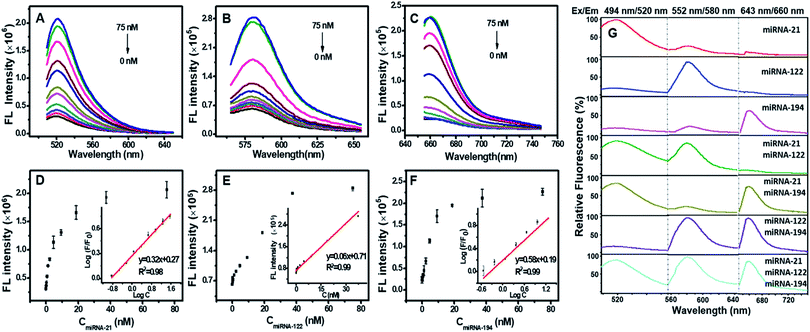
The fluorophores in the vertexes of DTNSs were quenched by the adjacent quenchers, and the fluorescence quenching capability depended on the ratio of TDN to nucleic acid chains (P5/P6/P7) during DTNSs preparation, which was determined by ((Fcontrol − FDTNSs)/Fcontrol) × 100%, where FDTNSs was the fluorescence of DTNSs and Fcontrol was the fluorescence of P5/P6/P7 chains. The fluorescence of FAM/TAMRA/Cy5 was gradually quenched by increasing the ratio of TDN to P5/P6/P7 and reached a constant value at ratios of 1.5, 1.25 and 1.25, respectively, and the quenching efficiency was up to 90% (Fig. S2 and Table S1†). In the presence of target miRNAs (miRNA-21, miRNA-122 and miRNA-194), P5, P6 and P7 would release from DTNSs, and then hybridize with the targets to form much more stable double strands. In consequence, the corresponding fluorescence signals (Ftarget) were recovered. The degree of fluorescence recovery (Ftarget/FDTNSs) was gradually enhanced with the increased ratio of tetrahedron to P5/P6/P7 and reached a platform at ratios of 1.5, 1.5 and 1.5, respectively (Fig. S3†). Combining the quenching and recovery efficiency, a ratio of 1.5 was selected for TDN to P5/P6/P7. Under the optimized conditions, the fluorescence intensities of FAM, TAMRA, and Cy5 increased by about 6.7-fold, 5.4-fold and 11.0-fold in the presence of the three miRNA targets, respectively.Ability of DTNSs to detect miRNAs in a homogeneous solution
Fig. 2A–C show that the fluorescence intensities of FAM, TAMRA and Cy5 all increased linearly with the concentration of miRNA targets from 0.15–37.5 nM. The detection limit was calculated to be 0.13 nM for miRNA-21, 0.64 nM for miRNA-122, and 0.68 nM for miRNA-194 (Fig. 2D–F), which were significantly lower than the previous reports (Table S2†).15,30–33 We next assessed the sequence specificity and the multiple detection ability for the three miRNA targets. DTNSs were transferred into 21 wells (3 × 7) and different mixed solutions composed of various combinations of the three target miRNAs were respectively added. The fluorescence emission spectra of FAM, TAMRA or Cy5 were obtained only in response to miRNA-21, miRNA-122 or miRNA-194 targets and had no notable cross-reactivity with each other (Fig. 2G). And when the three targets co-existed, the fluorescence signals of FAM, TAMRA or Cy5 all continuously increased with the corresponding target addition (Fig. S4†). In contrast, treatment of DTNSs with miRNAs with a scrambled sequence (shown in Table S3†) showed no significant changes in fluorescence intensity (Fig. S5†). The above results indicated that the prepared DTNSs allowed high-throughput monitoring of the three miRNA targets with high sensitivity, no notable cross-reactivity and good specificity.To verify the nuclease resistance of the DTNSs, 10% fetal calf serum (FBS, v/v) was used for the preparation of DTNSs solution to closely mimic physiological conditions. As shown in Fig. S6A–C,† no detectable fluorescence changes were observed with time for DTNSs in both FBS and PBS. The fluorescence recovery had no significant difference after the addition of target miRNAs for the two groups. Moreover, the bands of DTNSs treated with PBS or FBS solution for 1–4 h in agarose gel electrophoresis still maintained the same position, demonstrating that DTNSs were undecomposed when treated with FBS for 4 h (Fig. S4D†). All the above results confirmed that the DTNSs had good nuclease stability due to their tetrahedron-like spatial structure and were suitable for in vitro and in vivo studies.
Cytotoxicity was another vital factor for living cell studies. The cytotoxicity of DTNSs was tested by the MTT assay in normal cells (HEK293). After incubation with DTNSs at a high concentration of 100 nM for 48 h, the HEK293 cells still maintained more than 90% of the viability, revealing the low cytotoxicity of the DTNSs to normal cells (Fig. S7†).
Detection and imaging of intracellular miRNAs with DTNSs
For this study, the cell permeability of DTNSs was investigated by using non-rigid DNA tetrahedron-based nanoprobes (n-DTNSs) and DNA line nanostructures (DLNSs) as controls. After 4 h incubation, the fluorescence in HepG2 cells incubated with DTNSs was obviously higher than that of HepG2 cells incubated with n-DTNSs or DLNSs (Fig. S8†), indicating that the rigid DTNSs undoubtedly improved self-delivery capability without the help of transfection agents owing to their rapid internalization through a caveolin-dependent pathway,34,35 while n-DTNSs and DLNSs had poor permeability and low biostability.The time-dependent response of DTNSs incubated with cells was then studied by monitoring the fluorescence changes with different incubation periods. Huh7 cells with high expression levels of the three target miRNAs were chosen as the model.36 The fluorescence intensities of green, orange and red all increased before 2 h (Fig. S9†), and then stayed at the same level for another 2 h due to the complete entry of DTNSs, and thus, 2 h was used for the incubation of cells and DTNSs in the following experiments.
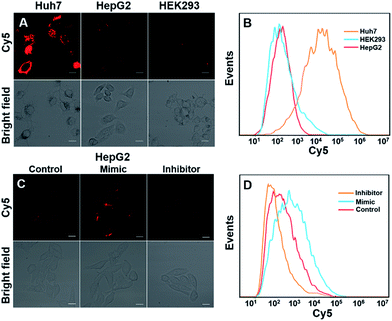
We next investigated whether DTNSs could monitor miRNAs in living cells. Three different cell lines, Huh7, HepG2 and HEK293 (human normal cells) were chosen, miRNA-194 was used as a model target. Both confocal images (Fig. 3A) and flow cytometric analysis (Fig. 3B) showed that the fluorescence intensities of Cy5 were obviously different in each cell line, indicating different miRNA-194 expression levels in the three cell lines. In agreement with previous reports,36–38 Huh7 had a higher miRNA-194 expression level than HepG2, while HEK293 exhibited a quite low expression level, and quantitative reverse transcription PCR (qRT-PCR) was further used to confirm the relative miRNA-194 expression levels (Fig. S10†). The expression levels of miRNAs in cancer cells indicated the stage of tumorigenesis, the effect of therapy and prognosis, and dynamic monitoring of miRNA expression levels inside cells was significant. To this end, HepG2 cells were treated with a miRNA194 mimic and inhibitor, and non-treated HepG2 cells were used as a control. An miRNA-194 inhibitor with 2′-O-methyl modification was chosen to transfect HepG2 cells to downregulate the expression level of miRNA-194,39 while the miRNA-194 mimic was selected to upregulate it.40 As shown in Fig. 3C, compared with the control group, a higher Cy5 fluorescence signal was observed in the mimic treated group while a lower one was displayed in the inhibitor treated group. Additionally, the flow cytometry assay further confirmed the results of confocal images (Fig. 3D). These results demonstrated that DTNSs had the capability of real-time monitoring miRNAs inside cells.
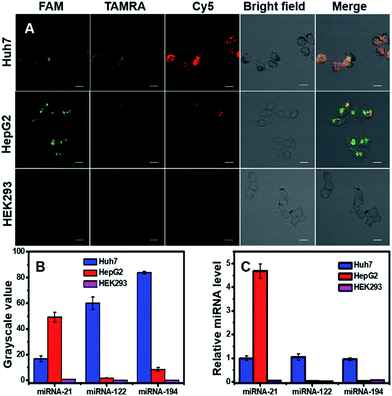
Detection of one kind of miRNA to identify cancers will produce high false positive signals, and thus simultaneous detection of multiple miRNAs inside cells would benefit the diagnostic precision of related cancers. Here we simultaneously detected three miRNAs (miRNA-21, miRNA-122 and miRNA-194) in three cell lines (two cancer cells: Huh7 and HepG2, one normal cell line: HEK293). Confocal images (Fig. 4A) and corresponding grayscale values (Fig. 4B) exhibited three fluorescent signals inside cells with different intensities and spatial distributions. For Huh7 cells, the three target miRNAs were all overexpressed; for HepG2 cells, miRNA-21 was high, and miRNA-122 and miRNA-194 were low; for HEK293, the three target miRNAs were quite low, and the expression levels were in agreement with literature reports.36,38,41–43 qRT-PCR was used to quantitatively measure relative miRNA expression levels in the three cell lines (Fig. 4C), and the results were consistent with confocal images and flow cytometry. The findings suggested that DTNSs could be used not only to effectively distinguish cancer cells from normal cells, but also to identify cancer cell subtypes.
In vitro cancer therapy induced by miRNA-21 silencing with DTNSs
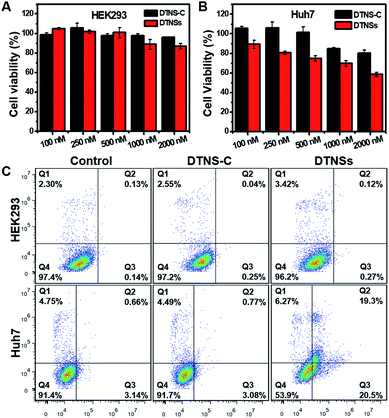
Previous reports have demonstrated that silencing intracellular miRNA-21 with antagomir-21 could efficiently suppress cancer cell migration and invasion, and finally induce cancer apoptosis.26,44 In this system, DTNSs were used as a smart carrier to deliver antagomir-21 into cells through a caveolin-dependent pathway. After cell uptake, endogenous miRNA-21 inside cancer cells served as an initiator to cause the release of antagomir-21 from DTNSs, and then suppress cancer cell migration and invasion, and trigger cell apoptosis. The wound-healing assay was employed to assess the inhibition of cancer cell migration and invasion. As shown in Fig. S11,† after Huh7 cells being treated with DTNSs (500 nM) for a period, the cell migration and invasion were obviously inhibited, while for HEK293 normal cells, the cell migration and invasion were almost unaffected, which was ascribed to the endogenous miRNA-21 silencing effect of DTNSs.To investigate the therapeutic effect of DTNSs in vitro, cytotoxicity assessment was accomplished by the MTT assay (Fig. 5A and B); even at an antagomir-21 dose of 2 μM in DTNSs, the HEK293 cell viability still remained over 90%. However, the cell viability of Huh7 cells was down to 58% after treatment with 2 μM DTNSs, which was obviously lower than that of the DTNS-C treated group (∼90%). Here, DTNS-C was prepared by replacing antagomir-21 (P5) with normal strand P8, which didn't have a gene silencing function. Therefore, our prepared DTNSs could efficiently induce cancer cell apoptosis and had no side effects to normal cells. And the apoptosis was further confirmed by flow cytometry analysis with the dual fluorescence of Annexin V-FITC/PI (Fig. 5C). To avoid the fluorescence interference of FAM/Cy5 in DTNS-C or DTNSs, DTNS-C or DTNSs without fluorophore modification was synthesized for flow cytometry analysis. The Huh7 and HEK293 cells were respectively treated with DTNS-C and DTNSs without fluorophore modification (2 μM) for 48 h; the Huh7 cells underwent nearly 50% apoptosis after treatment with DTNSs but no obvious apoptosis was observed in the DTNS-C group. In contrast, no prominent apoptosis was observed in both DTNS-C and DTNSs treated HEK293 cells, and the result was in accordance with the MTT assay.
In vivo cancer imaging and therapy with DTNSs
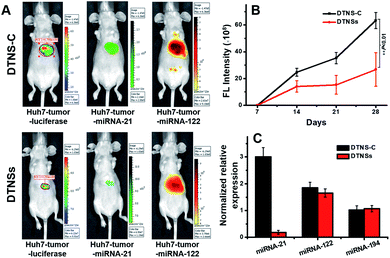
Before the in vivo study of DTNSs for the liver cancer therapeutic effect, the clinical significance of the selected miRNA-21, miRNA-122 and miRNA-194 biomarkers was firstly investigated in clinical patients (Fig. S12†). It was shown that the expression of miRNA-21 in clinical patients' liver cancer tumors (T) was significantly higher than that in non-tumor liver tissues (NT); miRNA-122 showed decreased expression in T compared with that in NT, but there was no distinct difference for the expression of miRNA-194-1/2 in T and NT, which indicated that miRNA-21 and miRNA-122 targets were valuable biomarkers for liver cancer diagnosis while miRNA-194 mainly played a role in the discrimination of hepatocellular carcinoma cell subtypes. The normalized relative expression of miRNA-21, miRNA-122 and miRNA-194 in Huh7 cells compared with that in different tissues of mice was also studied. Fig. S13† shows that miRNA-21 was overexpressed in Huh7 cells compared with that in other tissues; miRNA-122 was only expressed in Huh7 and mice liver tissues, while miRNA-194 existed not only in Huh7, but also in mice liver and other tissues like colon, stomach, etc. To obtain specific imaging in liver tissue, miRNA-21 and miRNA-122 were finally chosen for the following in vivo research. The in vivo performance of DTNSs was investigated in a Huh7 liver tumor orthotopic xenograft model by injecting DTNSs through the tail vein to silence the expression of miRNA-21. As shown in Fig. 6A, the tumor region and size in mice were reflected by a luminescence signal, which originated from the D-luciferin catalyzed by luciferase.45,46 After two weeks, mice injected with DTNS-C showed strong FAM (Green) and TAMRA (Orange) signals in the liver tumor and liver tissues, suggesting the high expression of miRNA-21 and miRNA-122 in the liver tumor and liver tissues. However, a significantly weaker FAM (Green) signal and obvious smaller tumor size were observed in the DTNSs injected group. From the result of quantitative analysis of bioluminescence signals, we could see that the tumor growth rate of the DTNSs treatment group was obviously lower than that of the DTNS-C group (Fig. 6B). In addition, the qRT-PCR analysis result of mice liver cancer tumor models also showed that only miRNA-21 was down-regulated in the DTNSs treated group (Fig. 6C), demonstrating that antagomir-21 loaded in DTNSs silenced the expression of miRNA-21 in liver tumors and suppressed the tumor growth. All the above results indicated that the prepared DTNSs could serve as a diagnostic probe and anticancer drug to treat cancers.Conclusions
In summary, we have successfully developed a smart nanosystem, DNA tetrahedron nanostructures (DTNSs), which can realize simultaneous monitoring of three intracellular miRNAs accompanied by efficient cancer therapy for the first time. DTNSs exhibited high biostability and cellular uptake efficiency owing to their unique tetrahedron-like spatial structure. Based on the fluorescence “OFF” to “ON” mode, three intracellular miRNA (miRNA-21, miRNA-122 and miRNA-194) expression levels could be quantitatively detected with high sensitivity, specificity and no notable cross-reactivity, and their dynamic changes could be real-time monitored. This system not only effectively distinguished tumor cells from normal cells, but also identified cancer cell subtypes, which avoided false-positive signals and significantly enhanced the accuracy of cancer diagnosis. Moreover, DTNSs could also act as a kind of cancer drug to treat cancer efficiently through endogenous miRNA-21 silencing, which was demonstrated by experiments in vitro and in vivo. Therefore, we anticipate that our strategy will have potential application in clinical diagnosis and treatment of cancer in future.Ethical statement
All procedures involving animals were conducted in accordance with the guidelines for Care and Use of Laboratory Animals of Nanjing Medical University and experiments were approved by the Animal Ethics Committee of Nanjing Medical University.Conflicts of interest
There are no conflicts to declare.Acknowledgements
This work was supported by the National Natural Science Foundation of China (No. 21635004, 21627806, and 21705018), the Fundamental Research Funds for the Central Universities (2242017K3DN11), the State Key Laboratory of Analytical Chemistry for Life Science (SKLACLS1913), the National Young 1000 Talents Program of China, the Jiangsu Province Education Department, the Jiangsu Province “Innovative and Entrepreneurial Team” and “Innovative and Entrepreneurial Talent” and the Southeast University-Nanjing Medical University Cooperative Research Project.Notes and references
- J. Wang, J. Chen and S. Sen, J. Cell. Physiol., 2016, 231, 25–30 CrossRef CAS PubMed.
- M. V. Iorio and C. M. Croce, EMBO Mol. Med., 2012, 4, 143–159 CrossRef CAS PubMed.
- X. Qiu, J. Xu, J. Guo, A. Yahia-Ammar, N. I. Kapetanakis, I. Duroux-Richard, J. J. Unterluggauer, N. Golob-Schwarzl, C. Regeard, C. Uzan, S. Gouy, M. DuBow, J. Haybaeck, F. Apparailly, P. Busson and N. Hildebrandt, Chem. Sci., 2018, 9, 8046–8055 RSC.
- F. Yang, Y. Cheng, Y. Cao, H. Dong, H. Lu, K. Zhang, X. Meng, C. Liu and X. Zhang, Chem. Sci., 2019, 10, 1709–1715 RSC.
- M. D. Jansson and A. H. Lund, Mol. Oncol., 2012, 6, 590–610 CrossRef CAS PubMed.
- Y.-H. Feng and C.-J. Tsao, Biomed. Rep., 2016, 5, 395–402 CrossRef CAS PubMed.
- Q. Xu, M. Zhang, J. Tu, L. Pang, W. Cai and X. Liu, Oncol. Rep., 2015, 34, 2054–2064 CrossRef CAS PubMed.
- R. Ali, S. El Tabbakh, W. El Delgawy, A. Kotb and M. N. Desouky, Afr. J. Urol., 2018, 24, 347–352 CrossRef.
- S. Ye, X. Li, M. Wang and B. Tang, Anal. Chem., 2017, 89, 5124–5130 CrossRef CAS PubMed.
- X. Meng, W. Dai, K. Zhang, H. Dong and X. Zhang, Chem. Sci., 2018, 9, 1184–1190 RSC.
- J. Hu, M. H. Liu and C. Y. Zhang, Chem. Sci., 2018, 9, 4258–4267 RSC.
- X. Meng, K. Zhang, W. Dai, Y. Cao, F. Yang, H. Dong and X. Zhang, Chem. Sci., 2018, 9, 7419–7425 RSC.
- M. Luan, N. Li, W. Pan, L. Yang, Z. Yu and B. Tang, Chem. Commun., 2016, 53, 356–359 RSC.
- P. Zhang, Z. He, C. Wang, J. Chen, J. Zhao, X. Zhu, C.-Z. Li, Q. Min and J.-J. Zhu, ACS Nano, 2015, 9, 789–798 CrossRef CAS.
- L. He, D. Q. Lu, H. Liang, S. Xie, C. Luo, M. Hu, L. Xu, X. Zhang and W. Tan, ACS Nano, 2017, 11, 4060–4066 CrossRef CAS.
- L. He, D. Lu, H. Liang, S. Xie, X. Zhang, Q. Liu, Q. Yuan and W. Tan, J. Am. Chem. Soc., 2018, 140, 258–263 CrossRef CAS PubMed.
- J. Li, C. Fan, H. Pei, J. Shi and Q. Huang, Adv. Mater., 2013, 25, 4386–4396 CrossRef CAS.
- Y. Zhang, Y. Deng, C. Wang, L. Li, L. Xu, Y. Yu and X. Su, Chem. Sci., 2019, 10, 5959–5966 RSC.
- J. Krutzfeldt, N. Rajewsky, R. Braich, K. G. Rajeev, T. Tuschl, M. Manoharan and M. Stoffel, Nature, 2005, 438, 685–689 CrossRef.
- Y. Li, K. Zhang, P. Liu, M. Chen, Y. Zhong, Q. Ye, M. Q. Wei, H. Zhao and Z. Tang, Adv. Mater., 2019, 31, e1901570 CrossRef.
- N. Li, H. Yang, Z. Yu, Y. Li, W. Pan, H. Wang and B. Tang, Chem. Sci., 2017, 8, 2816–2822 RSC.
- X. Chen, L. S. Mangala, C. Rodriguez-Aguayo, X. Kong, G. Lopez-Berestein and A. K. Sood, Cancer Metastasis Rev., 2018, 37, 107–124 CrossRef CAS PubMed.
- Q. Liu, D. Wang, M. Yuan, B. F. He, J. Li, C. Mao, G. S. Wang and H. Qian, Chem. Sci., 2018, 9, 7562–7568 RSC.
- H.-Q. Xi, K.-C. Zhang, B. Wei, D. Huang, J.-Y. Li and L. Chen, Oncotarget, 2017, 8, 31581–31591 Search PubMed.
- L. Ma, F. Reinhardt, E. Pan, J. Soutschek, B. Bhat, E. G. Marcusson, J. Teruya-Feldstein, G. W. Bell and R. A. Weinberg, Nat. Biotechnol., 2010, 28, 341–347 CrossRef CAS PubMed.
- S. Zhu, H. Wu, F. Wu, D. Nie, S. Sheng and Y. Y. Mo, Cell Res., 2008, 18, 350–359 CrossRef CAS PubMed.
- T. R. Wagenaar, S. Zabludoff, S. M. Ahn, C. Allerson, H. Arlt, R. Baffa, H. Cao, S. Davis, C. Garcia-Echeverria, R. Gaur, S. M. Huang, L. Jiang, D. Kim, C. Metz-Weidmann, A. Pavlicek, J. Pollard, J. Reeves, J. L. Rocnik, S. Scheidler, C. Shi, F. Sun, T. Tolstykh, W. Weber, C. Winter, E. Yu, Q. Yu, G. Zheng and D. Wiederschain, Mol. Cancer Res., 2015, 13, 1009–1021 CrossRef CAS.
- Y. Li, J. Tang, L. He, Y. Liu, Y. Liu, C. Chen and Z. Tang, Adv. Mater., 2015, 27, 4075–4080 CrossRef CAS PubMed.
- X. Shen, Y. Zhang, J. Sun, H. Lu, J. Ouyang and N. Na, Chem. Sci., 2019, 10, 6113–6119 RSC.
- S. Wang, M. Xia, J. Liu, S. Zhang and X. Zhang, ACS Sens., 2017, 2, 735–739 CrossRef CAS.
- L. Zhong, S. Cai, Y. Huang, L. Yin, Y. Yang, C. Lu and H. Yang, Anal. Chem., 2018, 90, 12059–12066 CrossRef CAS PubMed.
- J. Dong, H. Dong, W. Dai, X. Meng, K. Zhang, Y. Cao, F. Yang and X. Zhang, Anal. Chim. Acta, 2019, 1078, 176–181 CrossRef CAS.
- N. Xie, J. Huang, X. Yang, Y. Yang, K. Quan, M. Ou, H. Fang and K. Wang, ACS Sens., 2016, 1, 1445–1452 CrossRef CAS.
- A. S. Walsh, H. Yin, C. M. Erben, M. J. A. Wood and A. J. Turberfield, ACS Nano, 2011, 5, 5427–5432 CrossRef CAS.
- L. Liang, J. Li, Q. Li, Q. Huang, J. Shi, H. Yan and C. Fan, Angew. Chem., Int. Ed. Engl., 2014, 53, 7745–7750 CrossRef CAS.
- W. Tian, X. Dong, X. Liu, G. Wang, Z. Dong, W. Shen, G. Zheng, J. Lu, J. Chen, Y. Wang, Z. Wu and X. Wu, PLoS One, 2012, 7, e29551 CrossRef CAS.
- S. Xu, B. Zhang, Y. Zhu, H. Huang, W. Yang, H. Huang, H. L. Zheng and X. Liu, Cell Biol. Int., 2017, 41, 249–257 CrossRef CAS.
- H. Ishida, T. Tatsumi, A. Hosui, T. Nawa, T. Kodama, S. Shimizu, H. Hikita, N. Hiramatsu, T. Kanto, N. Hayashi and T. Takehara, Biochem. Biophys. Res. Commun., 2011, 412, 92–97 CrossRef CAS.
- C. C. Esau, Methods, 2008, 44, 55–60 CrossRef CAS.
- R. Das, P. A. Gregory, R. C. Fernandes, I. Denis, Q. Wang, S. L. Townley, S. G. Zhao, A. R. Hanson, M. A. Pickering, H. K. Armstrong, N. A. Lokman, E. Ebrahimie, E. Davicioni, R. B. Jenkins, R. J. Karnes, A. E. Ross, R. B. Den, E. A. Klein, K. N. Chi, H. S. Ramshaw, E. D. Williams, A. Zoubeidi, G. J. Goodall, F. Y. Feng, L. M. Butler, W. D. Tilley and L. A. Selth, Cancer Res., 2017, 77, 1021–1034 CrossRef CAS.
- M. Girard, E. Jacquemin, A. Munnich, S. Lyonnet and A. Henrion-Caude, J. Hepatol., 2008, 48, 648–656 CrossRef CAS PubMed.
- A. M. Harrandah, R. A. Mora and E. K. L. Chan, Cancer Lett., 2018, 438, 126–132 CrossRef CAS.
- S. Yin, Y. Fan, H. Zhang, Z. Zhao, Y. Hao, J. Li, C. Sun, J. Yang, Z. Yang, X. Yang, J. Lu and J. J. Xi, Nat. Commun., 2016, 7, 11012 CrossRef CAS PubMed.
- J. A. Chan, A. M. Krichevsky and K. S. Kosik, Cancer Res., 2005, 65, 6029–6033 CrossRef CAS.
- C. Zhang, Z. Yan, M. E. Arango, C. L. Painter and K. Anderes, Clin. Cancer Res., 2009, 15, 238–246 CrossRef CAS.
- D. E. Jenkins, Y. Oei, Y. S. Hornig, Y. Shang-Fan, J. Dusich, T. Purchio and P. R. Contag, Clin. Exp. Metastasis, 2003, 20, 733–744 CrossRef CAS.
Footnote |
| † Electronic supplementary information (ESI) available. See DOI: 10.1039/c9sc04823e |
| This journal is © The Royal Society of Chemistry 2020 |

