 Open Access Article
Spatially confined electrochemical conversion of metal–organic frameworks into metal-sulfides and their in situ electrocatalytic investigation via scanning electrochemical microscopy†
Itamar
Liberman
,
Wenhui
He
,
Ran
Shimoni
,
Raya
Ifraemov
and
Idan
Hod
 *
*
Department of Chemistry, Ilse Katz Institute for Nanoscale Science and Technology, Ben-Gurion University of the Negev, Beer-Sheva, 8410501, Israel. E-mail: hodi@bgu.ac.il
First published on 6th November 2019
Abstract
There is an on-going search for new earth-abundant electrocatalytic materials, suitable for replacing noble-metals as efficient accelerators of energy–conversion reactions. In this regard, over the last few years, metal–organic framework (MOF)-converted materials have demonstrated promising electrocatalytic properties. Nevertheless, the discovery of new catalytic materials requires development of methods combining high-throughput synthesis and electrochemical-activity screening. To do so, here we couple the synthetical and the analytical virtues of scanning electrochemical microscopy (SECM). Namely, we first utilized an SECM tip electrode to induce spatially confined (μm-scale) electrochemical conversion of cobalt-based ZIF-67 MOFs into patterns of cobalt sulfide with a tuned chemical composition. In turn, the same SECM setup was used to map the H2 evolution activity of the as-formed cobalt sulfide. Hence, the presented method should have great implications for future screening of new electrocatalytic materials for a variety of energy-related applications.
Introduction
The rapid increase in global energy consumption has stimulated the search for alternative energy sources that are more environmentally friendly, economically feasible and renewable. Electrocatalysis constitutes a key component in a wide range of alternative energy applications, including the hydrogen evolution reaction (HER),1,2 the oxygen evolution reaction (OER)3,4 and CO2 reduction,5,6 which are all important for solar fuel production. To date, the best electrocatalysts for these reactions are still mainly composed of noble metals. Nonetheless, significant improvements were obtained in the design of active non-precious metal-based catalysts due to considerable research efforts aimed at finding efficient, earth-abundant electrocatalysts for these reactions. However, further improvements in electrocatalytic performance rely on gaining additional insights correlating the materials structure and composition, and their catalytic activity. To do so, there is a need to develop new methods for efficient electrocatalytic-activity screening of materials with varying chemical properties.Metal–organic frameworks (MOFs) are a class of porous hybrid solids consisting of metal-containing nodes coordinated with multi-topic organic linkers.7–9 Owing to their immense chemical diversity,10,11 exceptional porosities,12,13 and well-defined crystalline structure, MOFs are considered promising materials for a wide range of applications such as gas storage14 and separation,15,16 sensing,17 and chemical catalysis.18,19 Moreover, in recent years MOFs have been utilized in (photo)-electrochemical systems as well,20–28 mainly due to the fact that they can serve as excellent precursors for the synthesis of a large variety of electrocatalytically active porous compounds, e.g. metal sulfides, metal oxides, and their corresponding carbon composites.29–34 These MOF-converted high surface-area electrocatalysts exhibit high conductivity and outstanding electrocatalytic activity in several energy conversion and storage applications. Recently, we have developed a means to electrochemically convert MOFs (termed EC-MOFs) into highly active electrocatalysts.35,36 We showed that by controlling the electrochemical parameters of conversion (e.g. scan rate, potential range, and number of potential scans) one can precisely manipulate the extent of conversion as well as the chemical composition of the resulting MOF-converted electrocatalysts, and thus subsequently fine-tune their electrochemical hydrogen evolution performance. As a result, we are interested in designing a method that will allow us to effectively screen the electrocatalytic activity of different MOF-converted catalysts having variable chemical compositions.
Being a scanning probe technique designed for the examination of electrochemical processes at high spatial-resolution, scanning electrochemical microscopy (SECM) has proven to be a powerful tool for the rapid evaluation of electrocatalytic activity as a function of a material's composition.37–40 A basic SECM setup is composed of a 4-electrode electrochemical cell: two working electrodes, the first is an SECM ultramicroelectrode (UME) tip, and the second is the catalytic material of interest (substrate electrode), alongside a counter and a reference electrode. Typically, the tip-to-substrate distance (dT–S) can easily be determined and controlled using the SECM approach curve technique, by fitting the tip's mass-transport limited current while moving it toward the substrate.41 Thus, during electrochemical measurements, the tip can be brought into very close proximity to the substrate (dT–S of a few μm). In order to evaluate the electrocatalytic performance of a given substrate, one should use the substrate-generation tip-collection (SG-TC) mode, which allows the detection and quantification of catalytic reaction products (generated at the substrate) at the tip's surface. Yet, efficient collection of all the substrate's reaction products also requires that the geometric surface area of both the tip and substrate will be similar.42 Hence, the preparation of a micron-sized substrate electrode usually involves either expensive, high spatial-resolution printing/lithography techniques43 or the deposition of a catalytically active material on an UME-based substrate44 (aligned directly below a similar sized UME tip); both significantly add to the complexity and reduce the flexibility of such SECM-based experiments.
As a result, we set out to find a facile and simple method for performing a μm-scale patterned conversion of MOFs into electrocatalytic materials. It has been previously shown that SECM could be utilized for micro-patterning by localized electrodeposition of metals, semiconductors, organic thin layers and polymers on a variety of conductive substrates.45–47 Due to the confinement of the electrochemical reaction strictly to the tip-substrate gap, SECM-based micro-patterning does not require the masking of the substrate with a resist layer (as opposed to conventional lithography).48 As a consequence, we have postulated that a modified approach to the EC-MOF process could be presented, to induce MOF conversion in a localized fashion using an SECM UME tip, and have produced a spatially confined pattern of electrocatalytic materials on the surface of the conductive substrate. These as-formed patterned electrocatalysts could be further electrochemically examined with SECM, to assess their catalytic activity.
In this work, as a proof of concept for this notion, we used an SECM tip to spatially confine the EC-MOF of a thin film of the ZIF-67 (ref. 49) MOF into a hydrogen evolution electrocatalyst, CoSx.50,51 The diameter of the patterned CoSx is similar to that of the EC-MOF inducing tip, thus in principle allowing for high collection efficiencies in the SG-TC SECM measurement mode (without the need for an UME-based substrate). In addition, we also demonstrate that the electrocatalytic activity of the as-formed CoSx pattern could be in situ examined by SECM-based electrochemical mapping, thus asserting the feasibility of our method.
Results and discussion
Thin films of ZIF-67 were directly grown on conductive glass (FTO) slides using a previously reported method35 (see the ESI† for experimental details). Briefly, FTO slides were first modified with a monolayer of 1,3,5-benzenetricarboxylic acid (H3BTC) to allow robust contact between the substrate and the grown MOFs. Next, the films were immersed in a methanol solution containing 10 mM Co(NO3)2·6xH2O and 20 mM 2-methylimidazole for 8 h at room temperature. Thereafter, the procedure was repeated 8 times, replacing the deposition solution with a fresh one each time, resulting in a homogeneous coverage of purple-coloured ZIF-67 films over the FTO slides (termed FTO-ZIF-67). The successful formation of ZIF-67 over the FTO slides was confirmed by X-ray diffraction (XRD) and scanning electron microscopy (SEM) (ESI Fig. S1†).For performing the localized EC-MOF of ZIF-67 into patterned CoSx, FTO-ZIF-67 electrodes were placed in a homemade electrochemical cell adjusted to work with a Bio-Logic SECM-150 instrument (see Fig. S2† for images of the electrochemical setup). An electrolyte solution containing 800 μL of N,N-dimethylformamide (DMF) with 0.2 M LiClO4 and 5 mM ferrocene was introduced into the cell. Generally, in order to accurately determine dT–S, an approach curve experiment was performed by holding the Pt tip (Pt disc diameter = 10 μm, glass coating diameter of 100 μm (RG value = 10)) at a constant potential of 0.7 V vs. Pt wire, in order to oxidize the ferrocene redox probe at a mass-transport limited rate (Fig. S3a†). Then, the tip was moved toward the substrate while recording the change in the measured tip current. The resulting current versus tip position curve was fitted and further used to fix dT–S at a constant value of 11.5 ± 0.5 μm (Fig. S3b†). At this point, 1 mL of 1 M thiourea (sulfur source for EC-MOF) in DMF and 200 μL of H2O (proton source for EC-MOF) were added to the electrolyte solution. As illustrated in Scheme 1, during EC-MOF operation, the SECM tip potential was scanned cathodically from −0.1 V to −1.5 V vs. Pt wire, at a scan rate of 0.5 V s−1 100 times (termed 1 EC-MOF cycle), in order to reduce H2O at the Pt-based tip electrode and locally generate the basic equivalent, OH− (process 1). The formed OH− than rapidly diffuses through the micrometric gap between the tip and FTO-ZIF-67 surface while hydrolysing thiourea to form reactive thiols (S2−) in the vicinity of the MOF surface (process 2). In turn, the thiols further react with the ZIF-67 MOF, replacing the imidazole ligands and directly forming a spatially confined spot of cobalt sulfide on the FTO substrate (ZIF-67 serves merely as a porous cobalt source during conversion) (process 3).
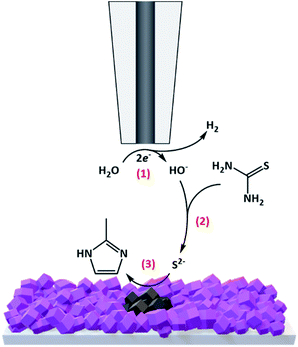 | ||
| Scheme 1 Schematic illustration of the operational mechanism of spatially confined electrochemical conversion of ZIF-67 MOF films to CoSx patterns. | ||
In order to demonstrate the ability to modulate the chemical composition of the resulting CoSx, we produced 3 types of CoSx, by varying the number of EC-MOF cycles. The conversion process was repeated for 30 cycles (30×), 60 cycles (60×), and 90 cycles (90×) to produce localized CoSx patterns, as can be seen in Fig. 1 and S4–S6.† Interestingly, despite the fact that we used a disc-shaped tip electrode to induce MOF conversion, for all samples we observed the formation of a ring-shaped CoSx pattern with a diameter of approximately 100 μm (matching the outer diameter of the glass-coated tip). A similar type of ring-shaped pattern was previously observed by E. Malel et al., upon SECM-based localized electrodeposition of metal nanoparticles.45 They attributed this phenomenon to a slow diffusion of solution-based reactants (metal-ion reducing mediators) from the bulk electrolyte toward the tip-substrate gap. As a result, metal deposition only occurred at the outer boundaries of the tip-substrate gap where high mediator concentrations were present. An analogous explanation could be applied to our EC-MOF process. Tip-generated OH− quickly reacts with thiourea at the tip-substrate gap to initiate EC-MOF, thus depleting its availability in the vicinity of the MOF. In other words, the kinetics of EC-MOF is limited by the diffusional flux of thiourea from the bulk solution toward the tip-substrate gap and hence a ring-shaped conversion pattern forms at its boundaries (which explains why the ring's diameter matches the outer diameter of the tip instead of the Pt-disc inner diameter).
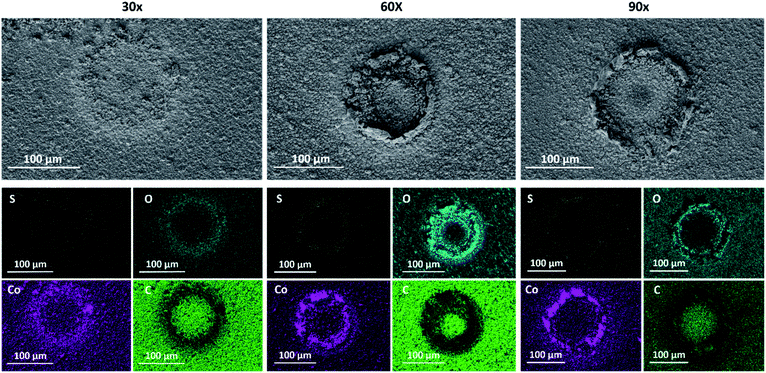 | ||
| Fig. 1 SEM images and EDS elemental maps of sulfur (yellow), oxygen (turquoise), cobalt (purple), and carbon (green) measured for 30×, 60× and 90× localized electrochemical MOF conversion patterns. | ||
Additionally, as can be clearly seen in the SEM images in Fig. 1, the extent of MOF conversion to CoSx could be tuned by varying the number of EC-MOF cycles. After 30 conversion cycles, one can notice the initial CoSx ring formation, while after longer EC-MOF durations a clear ring pattern is seen. Yet for all samples, going outward from the center of the ring, one can notice a gradual increase in the degree of MOF conversion (see the SEM images in Fig. S4–S6†). In addition, SEM images obtained for regions outside the conversion ring clearly show the preservation of the ZIF-67 structure (Fig. S7†). Elemental analysis of the samples was performed by energy-dispersive X-ray spectroscopy (EDS). First, EDS mapping of all MOF-converted samples (shown in Fig. 1) indicates the existence of sulfur and absence of carbon in the converted ring region, thus confirming the complete conversion of ZIF-67 to CoSx. It is important to note that due to unavoidable oxidation of air-exposed CoSx, oxygen is detected in the converted region as well. Thereafter, quantitative selective-area EDS analysis of all samples revealed an obvious correlation between the EC-MOF conditions and the obtained CoSx elemental composition (Fig. S8†). This clearly shows that a longer EC-MOF process results in higher sulfur content in the resulting CoSx (larger S![[thin space (1/6-em)]](https://www.rsc.org/images/entities/char_2009.gif) :
:![[thin space (1/6-em)]](https://www.rsc.org/images/entities/char_2009.gif) Co ratio) in the converted ring region (EDS selective-area 2) (elemental ratios of 1
Co ratio) in the converted ring region (EDS selective-area 2) (elemental ratios of 1![[thin space (1/6-em)]](https://www.rsc.org/images/entities/char_2009.gif) :
:![[thin space (1/6-em)]](https://www.rsc.org/images/entities/char_2009.gif) 5.8, 1
5.8, 1![[thin space (1/6-em)]](https://www.rsc.org/images/entities/char_2009.gif) :
:![[thin space (1/6-em)]](https://www.rsc.org/images/entities/char_2009.gif) 4.2, and 1
4.2, and 1![[thin space (1/6-em)]](https://www.rsc.org/images/entities/char_2009.gif) :
:![[thin space (1/6-em)]](https://www.rsc.org/images/entities/char_2009.gif) 3.7 for 30, 60, and 90 EC-MOF cycles respectively).
3.7 for 30, 60, and 90 EC-MOF cycles respectively).
As mentioned earlier, the presented method could in principle be used for creating patterned arrays of catalytic materials on a single substrate. In order to demonstrate the ability to produce such arrays, we prepared a pattern composed of 3 successive CoSx rings. This was done simply by running 3 different sets of 30 EC-MOF cycles, with a 100 μm step in the x-axis separating each set (termed 3×30×). As can be seen in Fig. 2 and S9,† the SEM images and EDS analysis results show similar trends, namely, a low conversion rate at the center of each conversion ring and a gradual increase in the conversion rate going outward closer to the ring (in terms of the sulfur to cobalt ratio as well as film morphology).
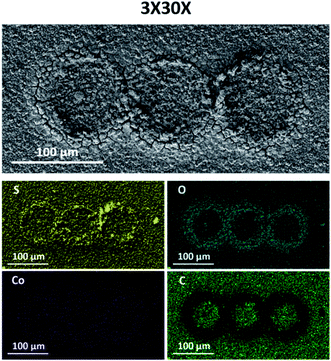 | ||
| Fig. 2 SEM images and EDS elemental maps of sulfur (yellow), oxygen (turquoise), cobalt (purple), and carbon (green) measured for 3×30× localized electrochemical MOF conversion patterns. | ||
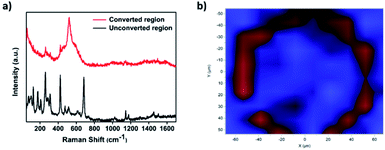
Further confirmation of the successful conversion of ZIF-67 to CoSx was obtained through micro-Raman mapping characterization. To do so, first a Raman spectrum of the unconverted ZIF-67 region was measured, clearly showing a couple of signature ZIF-67 peaks located at 1150 cm−1 and 1180 cm−1.35 In comparison, a Raman spectrum measured in the converted ring region showed a clear peak located at 520 cm−1, attributed to a CoSx species,52 while the corresponding ZIF-67 peaks disappeared, thus indicating that a ZIF-67 was completely converted in the ring-shaped region (Fig. 3a). In addition, μm-scale Raman mapping analysis was performed by scanning the converted area and its surroundings and comparing the detected spectra at each spot to the 2 spectra in Fig. 3a. Indeed, as can be seen in Fig. 3, the converted ring region showed a signal corresponding to CoSx (red) while the unconverted surroundings exhibited a ZIF-67 signal (blue), thus giving rise to a similar ring-shaped pattern to the one observed in the EDS maps and SEM images.
Additional characterization of the ZIF-67 converted CoSx patterns was performed through X-ray photoelectron spectroscopy (XPS) measurement. Localized XPS measurements (beam size of 80 μm) were carried out over the 60× conversion patterns (see the experimental conditions in the ESI†). As can be seen in Fig. S10a,† the Co 2p3/2 XPS spectrum indicates the presence of Co2+-based CoSx and oxidized CoSx species, CoSx–Ox/(OH)x, with peaks at 781.2 eV and 782.7 eV, respectively.35 Additionally, the S 2p spectrum shows a peak at 163.2 eV, correlated with S22− species, which is a well-known catalytically active site for the HER in various metal sulphide electrocatalysts (Fig. S10b†).35,53 Thus, these results indicate that the as-formed CoSx pattern should act as an active HER electrocatalyst. It is important to note that the X-ray beam also penetrates into non-converted ZIF-67 portions outside the conversion ring, and thus N 1s peaks were also detected, indicating the presence of unreacted 2-methyl-imidazole ligands (Fig. S10c and d†).
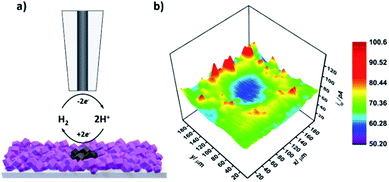
Next, upon achieving successful localized MOF conversion into an electrocatalytically active material, we set out to demonstrate its subsequent in situ electrochemical evaluation through SECM. CoSx is a well-known, highly active catalyst for the hydrogen evolution reaction (HER).50,51 Consequently, we have chosen to utilize SECM in order to map the HER activity of the converted CoSx ring and its surroundings. To do so, first a CoSx pattern was produced on an FTO-ZIF-67 film via 60 cycles of the localized EC-MOF process, as described above. Then, the electrolyte solution was replaced with a fresh 2 mL H2O/DMF (20/80% v/v) solution, containing 0.1 M LiClO4, while keeping the position of the SECM tip fixed at a dT–S of 11.5 ± 0.5 μm. As illustrated in Fig. 4a, HER mapping was conducted using the SG-TC mode. The substrate electrode is maintained at constant potential of −1 V vs. NHE suitable for electrocatalytic H2 generation. At the same time, a constant potential of 1 V vs. NHE was applied to the tip electrode in order to rapidly oxidize substrate-evolved H2 to H2O at a mass-transport limiting rate. That is, higher rates of the HER at the substrate will result in increased H2 oxidation currents at the tip. For SECM-based HER mapping, the tip electrode was subjected to 20 line-scans on the x-axis (200 μm at a speed of 30 μm s−1). Between each line-scan, a 10 μm step on the y-axis was made, thus producing the electrochemical HER activity map seen in Fig. 4b. A sample line-scan (current vs. tip position) plot is shown in Fig. S11.† It clearly shows a pair of signal-peaks located at the tip positions of 40 μm and 160 μm. This increase in the tip current (and hence higher substrate HER activity) occurs when the tip is hovering above the MOF-converted CoSx ring. Assembling all line scans together produces a clear ring-shaped pattern of higher HER activity compared to its surroundings (both outside and inside the converted region). In other words, SECM-based HER mapping demonstrates that we could in situ characterize the electrocatalytic activity of our spatially confined MOF-converted catalysts. As such, by combining the virtues of EC-MOF (fine-tuning of a catalyst's chemical composition) with those of SECM (localized conversion coupled with high spatial-resolution electrochemical analysis) one should be able to provide high-throughput screening of materials to discover new, efficient electrocatalysts.
Finally, in order to demonstrate the generality of the localized EC-MOF method, we conducted localized EC-MOF conversion of a bi-metallic MOF, (Fe,Ni)-MIL-53, into a patterned FeNiSx oxygen evolution reaction (OER) electrocatalyst (see the ESI† for experimental details). (Fe,Ni)-MIL-53 was synthesized using a previously reported procedure.33,36 The MOF's crystal structure and morphology were confirmed by PXRD and SEM (Fig. S12†). Then, (Fe,Ni)-MIL-53 was deposited on FTO conductive electrodes by electrophoretic deposition (EPD) (termed FTO-(Fe,Ni)-MIL-53) (see the ESI,† Experimental section). The spatially localized EC-MOF (60X) conversion process was utilized to form an FeNiSx pattern. Similarly to the CoSx conversion, a ring-shaped pattern was obtained, as can be seen in the SEM images in Fig. S13.† Moreover, the EDS and EDS mapping characterization results show the successful conversion of the MOF into FeNiSx (Table S1 and Fig. S14†). Due to the fact that FeNiSx based materials are known as excellent water oxidation electrocatalysts,33,36 we chose to investigate the OER activity of the converted area using the SECM-based substrate-generation tip-collection (SG-TS) mode. Upon completion of an EC-MOF 60X conversion process, the electrolyte was replaced with a fresh 0.1 M LiClO4 in H2O/DMF (20/80% v/v) solution. For OER analysis, the tip electrode was placed directly above the converted area (at dT–S = 12 ± 0.5 μm). Then, the substrate potential was scanned linearly from 1 V to 2 V (vs. NHE) (at a scan rate of 0.01 V s−1) in order to oxidize H2O, while the tip potential was maintained at −0.9 V (vs. NHE) to efficiently collect the OER products (i.e. O2 reduction). Indeed, as can be seen in Fig. S15,† the substrate's anodic catalytic current is followed by cathodic catalytic current at the tip, thus indicating the occurrence of the OER at the MOF-converted FeNiSx ring.
Conclusions
In summary, spatially confined electrochemical conversion of MOFs was demonstrated using an SECM tip-induced method. FTO-ZIF-67 electrodes were used to produce patterns of CoSx HER catalysts. Detailed materials characterization of the resulting CoSx was conducted with SEM, EDS, and Raman spectroscopy. Samples with varying CoSx chemical compositions were obtained by tuning the parameters of the electrochemical conversion process. Furthermore, SECM was also utilized for in situ HER activity mapping of the as-formed CoSx catalyst. Moreover, the generality of the presented method was demonstrated by localized conversion of a bi-metallic (Fe,Ni)-MIL-53 MOF into patterned FeNiSx, followed by its in situ OER analysis. We believe that the ability to combine localized catalyst fabrication and its subsequent electrochemical investigation will pave the way for future high-throughput screening of new catalytic materials for a wide variety of electrocatalytic reactions. Moreover, our method will also serve as a new tool to design MOF-based patterned arrays for chemical and optoelectronic applications such as sensing-chips and transistors.Conflicts of interest
There are no conflicts to declare.Acknowledgements
We thank the Ilse Katz Institute for Nanoscale Science and Technology for the technical support in materials characterization. This research was supported by the Israel Science Foundation (ISF) (grant No. 306/18). W. He acknowledges the Planning and Budgeting Committee’s (PBC) fellowship for the financial support.Notes and references
- Y. Zheng, Y. Jiao, A. Vasileff and S. Z. Qiao, Angew. Chem., Int. Ed., 2018, 57, 7568–7579 CrossRef CAS PubMed.
- N. Mahmood, Y. D. Yao, J. W. Zhang, L. Pan, X. W. Zhang and J. J. Zou, Adv. Sci., 2018, 5, 1700464 CrossRef.
- F. Song, L. C. Bai, A. Moysiadou, S. Lee, C. Hu, L. Liardet and X. L. Hu, J. Am. Chem. Soc., 2018, 140, 7748–7759 CrossRef CAS.
- J. S. Kim, B. Kim, H. Kim and K. Kang, Adv. Energy Mater., 2018, 8, 1702774 CrossRef.
- Y. Zheng, A. Vasileff, X. L. Zhou, Y. Jiao, M. Jaroniec and S. Z. Qiao, J. Am. Chem. Soc., 2019, 141, 7646–7659 CrossRef CAS.
- C. Long, X. Li, J. Guo, Y. N. Shi, S. Q. Liu and Z. Y. Tang, Small Methods, 2019, 3, 1800369 Search PubMed.
- H. Furukawa, K. E. Cordova, M. O'Keeffe and O. M. Yaghi, Science, 2013, 341, 1230444 CrossRef.
- H. Furukawa, U. Muller and O. M. Yaghi, Angew. Chem., Int. Ed., 2015, 54, 3417–3430 CrossRef CAS.
- S. T. Meek, J. A. Greathouse and M. D. Allendorf, Adv. Mater., 2011, 23, 249–267 CrossRef CAS.
- P. Deria, W. Bury, J. T. Hupp and O. K. Farha, Chem. Commun., 2014, 50, 1965–1968 RSC.
- O. Karagiaridi, W. Bury, J. E. Mondloch, J. T. Hupp and O. K. Farha, Angew. Chem., Int. Ed., 2014, 53, 4530–4540 CrossRef CAS PubMed.
- H. Furukawa, N. Ko, Y. B. Go, N. Aratani, S. B. Choi, E. Choi, A. O. Yazaydin, R. Q. Snurr, M. O'Keeffe, J. Kim and O. M. Yaghi, Science, 2010, 329, 424–428 CrossRef CAS PubMed.
- O. K. Farha, I. Eryazici, N. C. Jeong, B. G. Hauser, C. E. Wilmer, A. A. Sarjeant, R. Q. Snurr, S. T. Nguyen, A. O. Yazaydin and J. T. Hupp, J. Am. Chem. Soc., 2012, 134, 15016–15021 CrossRef CAS.
- A. Phan, C. J. Doonan, F. J. Uribe-Romo, C. B. Knobler, M. O'Keeffe and O. M. Yaghi, Acc. Chem. Res., 2010, 43, 58–67 CrossRef CAS.
- J. R. Li, J. Sculley and H. C. Zhou, Chem. Rev., 2012, 112, 869–932 CrossRef CAS PubMed.
- D. T. McGrath, M. D. Ryan, J. J. MacInnis, T. C. VandenBoer, C. J. Young and M. J. Katz, Chem. Sci., 2019, 10, 5576–5581 RSC.
- L. E. Kreno, K. Leong, O. K. Farha, M. Allendorf, R. P. Van Duyne and J. T. Hupp, Chem. Rev., 2012, 112, 1105–1125 CrossRef CAS.
- P. Deria, D. A. Gomez-Gualdron, I. Hod, R. Q. Snurr, J. T. Hupp and O. K. Farha, J. Am. Chem. Soc., 2016, 138, 14449–14457 CrossRef CAS.
- F. Vermoortele, B. Bueken, G. Le Bars, B. Van de Voorde, M. Vandichel, K. Houthoofd, A. Vimont, M. Daturi, M. Waroquier, V. Van Speybroeck, C. Kirschhock and D. E. De Vos, J. Am. Chem. Soc., 2013, 135, 11465–11468 CrossRef CAS.
- R. Ifraemov, R. Shimoni, W. He, G. Peng and I. Hod, J. Mater. Chem. A, 2019, 7, 3046–3053 RSC.
- E. M. Miner, L. Wang and M. Dinca, Chem. Sci., 2018, 9, 6286–6291 RSC.
- I. Hod, M. D. Sampson, P. Deria, C. P. Kubiak, O. K. Farha and J. T. Hupp, ACS Catal., 2015, 5, 6302–6309 CrossRef CAS.
- P. M. Usov, S. R. Ahrenholtz, W. A. Maza, B. Stratakes, C. C. Epley, M. C. Kessinger, J. Zhu and A. J. Morris, J. Mater. Chem. A, 2016, 4, 16818–16823 RSC.
- R. Shimoni, W. H. He, I. Liberman and I. Hod, J. Phys. Chem. C, 2019, 123, 5531–5539 CrossRef CAS.
- E. M. Miner, T. Fukushima, D. Sheberla, L. Sun, Y. Surendranath and M. Dincă, Nat. Commun., 2016, 7, 10942 CrossRef CAS.
- S. Goswami, L. Ma, A. B. F. Martinson, M. R. Wasielewski, O. K. Farha and J. T. Hupp, ACS Appl. Mater. Interfaces, 2016, 8, 30863–30870 CrossRef CAS.
- S. R. Ahrenholtz, C. C. Epley and A. J. Morris, J. Am. Chem. Soc., 2014, 136, 2464–2472 CrossRef CAS PubMed.
- J. Yu, X. Li and P. Deria, ACS Sustainable Chem. Eng., 2019, 7, 1841–1854 CrossRef CAS.
- X. Cao, C. Tan, M. Sindoro and H. Zhang, Chem. Soc. Rev., 2017, 46, 2660–2677 RSC.
- S. Dang, Q.-L. Zhu and Q. Xu, Nat. Rev. Mater., 2017, 3, 17075 CrossRef.
- T. Y. Ma, S. Dai, M. Jaroniec and S. Z. Qiao, J. Am. Chem. Soc., 2014, 136, 13925–13931 CrossRef CAS.
- L. Oar-Arteta, T. Wezendonk, X. H. Sun, F. Kapteijn and J. Gascon, Mater. Chem. Front., 2017, 1, 1709–1745 RSC.
- C. Singh, I. Liberman, R. Shimoni, R. Ifraemov and I. Hod, J. Phys. Chem. Lett., 2019, 10, 3630–3636 CrossRef CAS.
- D. Cardenas-Morcoso, R. Ifraemov, M. García-Tecedor, I. Liberman, S. Gimenez and I. Hod, J. Mater. Chem. A, 2019, 7, 11143–11149 RSC.
- W. He, R. Ifraemov, A. Raslin and I. Hod, Adv. Funct. Mater., 2018, 28, 1707244 CrossRef.
- W. H. He, H. M. Gao, R. Shimoni, Z. Y. Lu and I. Hod, ACS Appl. Energy Mater., 2019, 2, 2138–2148 CrossRef CAS.
- J. L. Fernández, D. A. Walsh and A. J. Bard, J. Am. Chem. Soc., 2005, 127, 357–365 CrossRef PubMed.
- D. Polcari, P. Dauphin-Ducharme and J. Mauzeroll, Chem. Rev., 2016, 116, 13234–13278 CrossRef CAS PubMed.
- C. Bhattacharya, H. C. Lee and A. J. Bard, J. Phys. Chem. C, 2013, 117, 9633–9640 CrossRef CAS.
- A. Minguzzi, M. A. Alpuche-Aviles, J. R. Lopez, S. Rondinini and A. J. Bard, Anal. Chem., 2008, 80, 4055–4064 CrossRef CAS.
- J. L. Amphlett and G. Denuault, J. Phys. Chem. B, 1998, 102, 9946–9951 CrossRef CAS.
- H. S. Ahn and A. J. Bard, J. Am. Chem. Soc., 2015, 137, 612–615 CrossRef CAS PubMed.
- S. P. Berglund, H. C. Lee, P. D. Nunez, A. J. Bard and C. B. Mullins, Phys. Chem. Chem. Phys., 2013, 15, 4554–4565 RSC.
- H. Li, M. Du, M. J. Mleczko, A. L. Koh, Y. Nishi, E. Pop, A. J. Bard and X. L. Zheng, J. Am. Chem. Soc., 2016, 138, 5123–5129 CrossRef CAS PubMed.
- E. Malel and D. Mandler, J. Electrochem. Soc., 2008, 155, D459–D467 CrossRef CAS.
- D. Zhan, D. Yang, Y. Zhu, X. Wu and Z.-Q. Tian, Chem. Commun., 2012, 48, 11449–11451 RSC.
- T. Matrab, C. Combellas and F. Kanoufi, Electrochem. Commun., 2008, 10, 1230–1234 CrossRef CAS.
- A. Jo, Y. Lee and C. Lee, Electroanalysis, 2018, 30, 2689–2695 CrossRef CAS.
- G. H. Zhong, D. X. Liu and J. Y. Zhang, J. Mater. Chem. A, 2018, 6, 1887–1899 RSC.
- Y. J. Sun, C. Liu, D. C. Grauer, J. K. Yano, J. R. Long, P. D. Yang and C. J. Chang, J. Am. Chem. Soc., 2013, 135, 17699–17702 CrossRef CAS.
- N. Kornienko, J. Resasco, N. Becknell, C. M. Jian, Y. S. Liu, K. Q. Nie, X. H. Sun, J. H. Guo, S. R. Leone and P. D. Yang, J. Am. Chem. Soc., 2015, 137, 7448–7455 CrossRef CAS.
- A. W. Peters, Z. Y. Li, O. K. Farha and J. T. Hupp, ACS Nano, 2015, 9, 8484–8490 CrossRef CAS.
- L. R. L. Ting, Y. L. Deng, L. Ma, Y. J. Zhang, A. A. Peterson and B. S. Yeo, ACS Catal., 2016, 6, 861–867 CrossRef CAS.
Footnote |
| † Electronic supplementary information (ESI) available: Experimental section, electrochemical methods and materials characterization. See DOI: 10.1039/c9sc04141a |
| This journal is © The Royal Society of Chemistry 2020 |

