An automated flow platform for accurate determination of gas–liquid–solid reaction kinetics†
Received
14th May 2020
, Accepted 22nd July 2020
First published on 22nd July 2020
Abstract
An automated flow platform based on a tube-in-tube contactor and micro-packed bed reactor is developed to measure the kinetics of gas–liquid–solid hydrogenation reactions. The liquid flowing in the inner tube of the tube-in-tube contactor is rapidly saturated to ensure a constant H2 concentration before entering the micro-packed bed, which transforms the gas–liquid–solid system into a liquid–solid system. A ramping strategy is adopted in which the continuously varied residence time and the corresponding conversion data are obtained in a single experiment. Two reactions including hydrogenation of α-methylstyrene and nitrobenzene are chosen to demonstrate the accuracy and efficiency of this automated platform. Varying the flow rate ramping shows that accurate kinetic determination requires a specific range of flow rate ramps. A kinetic curve of conversion versus residence time (more than ten thousand data points) can be obtained in a single experiment within 50 min. The kinetic parameters obtained with this strategy agree well with literature values. The automated flow platform with flow rate ramping enables accurate determination of gas–liquid–solid reaction kinetics with higher efficiency and lower reagent cost compared with other methods.
Introduction
Gas–liquid–solid reactions, such as hydrogenation, oxidation and carbonylation, are widely used in the petroleum,1,2 fine chemical,3–9 agrochemical,7,10 and pharmaceutical industries.3,5,9,11 Accurate determination of gas–liquid–solid reaction kinetics is required for reactor design and process optimization,12 and has the benefit of significantly increasing the selectivity to the product and improving process safety. Traditional methods for the determination of gas–liquid–solid reaction kinetics can be categorized as either sampling under steady-state conditions in flow or generating time-series data in batch.13 Continuous flow experiments, especially in microreactors, have advantages of faster mixing time, lower catalyst cost, and intensification of heat and mass transfer.12,14–18 However, the sampling is performed only when the flow system reaches a steady state (at least three times the reaction time). As a result, the kinetics determination in continuous flow experiments can be slow and labor-intensive. Batch experiments are beneficial to generate kinetic data since many data points can be obtained in a single experiment and the shape of the conversion versus time curve often provides insight into the kinetic mechanism.19–21 However, kinetic experiments in batch can be limited by mass and heat transfer leading to falsification of kinetics.12 As a result, both of these techniques have limitations: continuous flow experiments are hindered by the need to take steady state measurements,22–25 and batch experiments face potential heat and mass transfer limitations obstructing precise determination of kinetic parameters.12 As a result, it is desired to develop an efficient approach for accurate determination of kinetic parameters for gas–liquid–solid reactions.
In a previous study, Moore13 proposed a ramping method that allowed more experimental data to be obtained in less time than traditional steady state measurements by ramping the flow rate. The approach has been applied to several studies of homogeneous reactions.26–31 Herein we considered its extension to a gas–liquid–solid system with the complex hydrodynamics and transport of multiphase flows.11,32–35 Whenever the gas and liquid flow rates are changed, the hydrodynamics especially for the liquid holdup36 and mass transfer37 change accordingly, which is often difficult to describe with an accurate mathematical model. Thus, there are challenges in applying ramping of the liquid flow rate to determine the kinetics of gas–liquid–solid systems.
Tube-in-tube contactors that promote rapid interphase mixing and improve mass transfer with small channel diameters have attracted attention.38–43 They are typically composed of an inner membrane tube (Teflon AF-2400) and an outer impermeable PTFE or steel tube. Teflon AF-2400 tubing is highly permeable to gas but non-permeable to liquid. In previous studies, tube-in-tube contactors combined with bubble-counting,44 inline flow FTIR,45,46 inline colorimetric titrations46,47 and a mass flow meter36,48 have been developed to determine gas solubility/dissolution in a gas–liquid system. Compared with conventional methods that take 4–5 h to obtain single gas solubility data, the strategy using a tube-in-tube contactor enables single gas solubility data point measurement within 2–5 min due to the rapid gas–liquid mass transfer. As mentioned in the literature,36,44 with the utilization of a tube-in-tube contactor, the solvent could be saturated with hydrogen in less than 20 s. With the liquid flow pressure larger than the gas flow pressure, there is no gas phase in the saturated liquid. The gas–liquid–solid reaction can be simplified to a liquid–solid reaction when the hydrogen saturated reactants enter a micro-packed bed reactor. The latter effect reduces the complexity of experiments notably and enables the application of the ramping method in gas–liquid–solid reactions. In addition, the liquid flow in the micro-packed bed reactor could be treated as plug flow since the ratio of reactor length to catalyst diameter (210) is larger than 200,49 leading to negligible residence time dispersion which is essential for the application of the ramping method.13 Conducting kinetic studies in micro-packed bed reactors with the simplified liquid–solid reaction system offers several advantages such as small amounts of catalysts, uniform temperature distribution, intensified mass transfer, and accurate estimation of kinetic parameters.50,51
The aim of this work is to develop an automated flow platform for implementing the flow ramping method for gas–liquid–solid hydrogenation reactions in micro-packed bed reactors. Hydrogenations of α-methylstyrene (AMS) and nitrobenzene (NB) were employed as model reactions and reaction equations are shown in Scheme 1. These reactions were chosen due to their wide applications in the chemical industry.52,53 The effect of flow rate ramping on the kinetic results was investigated and a kinetic curve with the conversion versus residence time was successfully obtained. Then the kinetic parameters for hydrogenation of AMS and NB were extracted to demonstrate the efficiency and accuracy of the method.
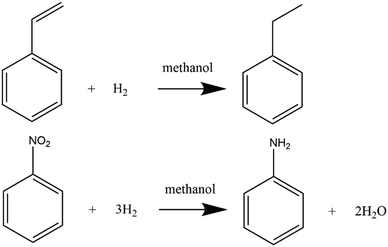 |
| | Scheme 1 Hydrogenation of α-methylstyrene (AMS) and nitrobenzene (NB) in methanol. | |
Materials and methods
Chemicals
The reactants of AMS (C9H10, 99.9%) and NB (C6H5NO2, 99.9%) were purchased from Aladdin-Holdings Group without any purification. The solvent methanol (CH3OH, 99.9%) was also obtained from Aladdin-Holdings Group. Hydrogen (H2, 99.9%) was supplied by Beijing Beiwen Gas Manufacturing Plant and the palladium/alumina particle catalyst (Pd/Al2O3, 5 wt%) with an average size of 480 μm was acquired from Dalian Institute of Chemical Physics.
Experimental setup
The experimental setup (Fig. 1) is composed of a thermal mass flow controller (Beijing Sevenstar Electronics Co. Ltd.), a high pressure constant flow pump (Beijing Ou Shi Sheng Technology Co. Ltd.), a micro-packed bed reactor, a tube-in-tube contactor, a backpressure regulator (Beijing Xiongchuan Technology Co. Ltd.) and an online ultraviolet spectrometer (UV-vis JP43826913, Agilent 1100). The reaction mechanisms of hydrogenation of AMS and NB are simple52,54 and there are almost no side products, which have also been verified by GC in our experiments. The characteristic wavelengths for AMS and NB are 291 and 390 nm, respectively, based on the UV-vis spectra (Fig. S2†), since the hydrogenation products have no absorbance at these two wavelengths. However, other online analytical instruments such as online IR and Raman spectrometers could also be utilized based on the actual need of experiments. The micro-packed bed reactor was 10 cm long with an inner diameter of 3 mm. The fixed catalytic bed was packed with Al2O3 spheres, resulting in a void fraction of 37%. The tube-in-tube contactor had a length of 2 m with an inner Teflon AF-2400 tube (inner diameter is 0.610 mm and outer diameter is 0.813 mm) and an outer PTFE tube (inner diameter is 1.570 mm and outer diameter is 3.175 mm).
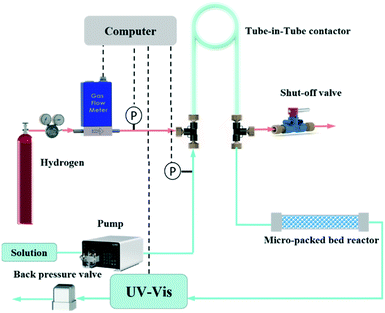 |
| | Fig. 1 Schematic of the automated flow system based on the tube-in-tube contactor and micro-packed bed reactor for the accurate determination of gas–liquid–solid hydrogenation kinetics. | |
During the experiments, the solution was pumped into the inner Teflon AF-2400 tube and hydrogen from the regulated cylinder was fed into the outer PTFE tube through a thermal mass flow controller, which could be used as a flow meter when it was completely open. The saturated liquid obtained in the tube-in-tube contactor flowed into a stainless loop immersed in a water bath to achieve the required temperature before entering the micro-packed reactor. The outlet of liquid from the packed bed reactor was connected to an online UV-vis spectrometer for monitoring the product concentration and a back-pressure regulator to control the liquid pressure. The pressure of gas flow in the tube-in-tube contactor was determined by the reducing valve of the hydrogen cylinder. Two inline pressure transducers (CYT11, Beijing Tianyuhengchuang Technology Co. Ltd) were placed in the gas and liquid inlets of the tube-in-tube contactor to measure the pressure. Note that the liquid pressure was controlled at 0.1 MPa higher than the gas pressure to avoid out-gassing of the dissolved H2 in the flow stream, which would bring large absorbance fluctuations in online UV-vis results. Besides, the pressure difference between the inner tube and outer tube should be less than 0.8 MPa to avoid the fracture of the Teflon-AF2400 membrane. The entire tube-in-tube contactor and micro-packed bed reactor were immersed in the water bath to control the system temperature.
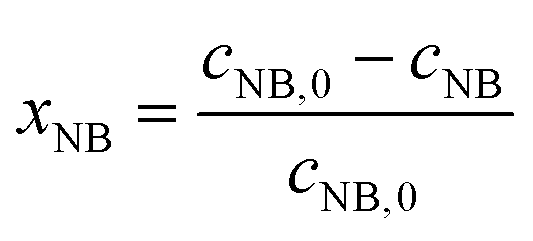
The concentrations of AMS and NB were determined by online UV-vis spectroscopy at wavelengths of 291 nm and 390 nm, respectively. The standard curves for the two reactants are given in the ESI (Fig. S1†). The conversions were obtained using the following equations:
| | 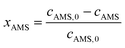 | (1) |
| |  | (2) |
Methodology
Calculation of residence time under flow rate ramping.
Methods for generating a continuous residence time profile can be categorized as residence time ramping and flow rate ramping.12,26,27,55,56 For residence time ramping, the residence time is gradually increased at a constant rate by the adjustment of the flow rate, whereas flow rate ramping means that the flow rate is changed at a certain rate to acquire the corresponding residence time. Here, flow rate ramping was utilized in the experiments.
Hone26 presented a method to calculate the residence time under flow rate ramping, but ignored the time of fluid flowing through the volume between the reactor exit and HPLC detector, leading to deviations from the actual residence time. To improve the accuracy of residence time calculation, all the dead volumes in the system have to be considered. Details about calculation of residence time τ in the system and pictorial representation of the ramping method are given in the ESI† (section 4).
Results and discussion
Typical kinetics results with this strategy
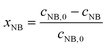
To show the process of obtaining kinetic parameters under flow rate ramping from raw experimental data, the hydrogenation kinetics of AMS at 31 °C was first measured as shown in Fig. 2. Fig. 2a shows that the liquid flow rate decreases continuously at a certain rate from 1.2 mL min−1 to 0.37 mL min−1, indicating that the residence time in the packed bed is changed from 12 s to 42 s. As shown in Fig. 2b, the absorbances of AMS from online UV-vis spectroscopy decrease continuously with the decrease of the liquid flow rate. With the obtained relationship between absorbance and reactant concentration, the AMS concentration versus measurement time can be easily obtained. Calculating the corresponding residence times according to the last section, the conversion of AMS at different residence times can be determined, as shown in Fig. 2c.
 |
| | Fig. 2 Data processing for hydrogenation of AMS under flow rate ramping. (a) Flow rate ramping from 1.2 mL min−1 to 0.37 mL min−1; (b) absorbance of AMS at various measurement times; (c) conversion of AMS at various residence times. Reaction conditions: temperature: 31 °C, gas pressure: 1.0 MPa, concentration: 0.06 mol L−1, catalyst loading: 5 wt%, and ramping rate: 0.02 mL min−1 min−1. | |
The effect of the ramping rate on conversion
For the application of the ramping method, it is assumed that the system is always at a pseudo-steady state. However, a fast ramping rate may have adverse effects on the steady state assumption that would affect the accuracy of experiments. Hence, it is necessary to determine the suitable ramping rate to eliminate its influence on the results.
In the experiments, several ramping rates (0.01 mL min−1 min−1, 0.015 mL min−1 min−1, 0.02 mL min−1 min−1, 0.03 mL min−1 min−1, 0.05 mL min−1 min−1, and 0.1 mL min−1 min−1) were adopted to investigate the effect of the ramping rate on the conversion at the same temperature and pressure.
As presented in Fig. 3, the measured curves of conversion versus residence time agree well when flow rate ramping is lower than 0.03 mL min−1 min−1. For flow rate ramping higher than 0.03 mL min−1 min−1, obvious deviations appear owing to the system no longer being at a pseudo-steady state. The results suggest that ramping rates lower than 0.03 mL min−1 min−1 should be adopted for studies of kinetics.
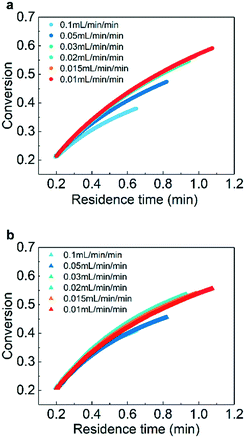 |
| | Fig. 3 Conversion of (a) AMS and (b) NB at different residence times and flow rate rampings. Reaction conditions: (a) temperature: 26 °C, gas pressure: 1.0 MPa, and AMS concentration: 0.06 mol L−1; (b) temperature: 36 °C, gas pressure: 1.3 MPa, NB concentration: 0.02 mol L−1, and catalyst loading: 5 wt%. | |
Kinetics of hydrogenation
In the three-phase catalytic reaction system, potential limitations in gas–liquid mass transfer, liquid–solid mass transfer and internal diffusion could falsify kinetics and thus, need to be eliminated for the precise determination of intrinsic kinetics. For this system, any limitations in liquid–solid mass transfer and internal diffusion in the micro-packed beds need to be evaluated and gas–liquid mass transfer resistance must be analysed for the tube-in-tube contactor.
The analysis of gas–liquid mass transfer in the tube-in-tube contactor
In the tube-in-tube contactor, hydrogen transfers from the shell of the reactor into the liquid in the inner tubing. In our previous study, we have demonstrated that the liquids in the inner tubing can be fully saturated within 12 seconds at 23 °C with the assumption that diffusion resistance is in the gas phase rather than in the membrane.36 The residence time of the liquid in the inner tubing is calculated as follows:| |  | (3) |
When the residence time is 12 s, the corresponding liquid flow rate is 1.68 mL min−1, which indicates that the liquid is fully saturated when the liquid flow rate is lower than 1.68 mL min−1 at 23 °C. The maximum liquid flow rate to achieve saturated liquid will increase with temperature as the gas diffusivity in liquids increases with temperature.
The elimination of liquid–solid mass transfer limitations
For the judgement of liquid–solid mass transfer limitations, four μPBRs with the same volume (3 mL) and various internal diameters were utilized in the experiments. These reactors were filled with the same amounts of catalysts and used at the same liquid flow rate. Different liquid superficial velocities with the same residence time were achieved with this method. Table 1 shows the details of the micro-packed bed reactors utilized in the experiments.
Table 1 Details of micro-packed bed reactors
| Micro-packed bed reactors |
Length/cm |
Inner diameter/mm |
| 1 |
25.27 |
3.87 |
| 2 |
20.00 |
4.35 |
| 3 |
18.12 |
4.57 |
| 4 |
13.22 |
5.35 |
Fig. 4 shows the effect of liquid superficial velocity on the average reaction rate. When the liquid superficial velocities exceed 5 cm min−1 for the hydrogenation of both AMS and NB, the average reaction rate no longer increases significantly as the liquid superficial velocity increases. This result indicates that the reaction kinetics is independent of liquid–solid mass transfer when the liquid superficial velocity is greater than 5 cm min−1.
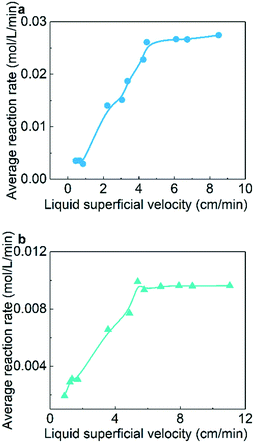 |
| | Fig. 4 Effect of liquid superficial velocity on the average hydrogenation reaction rate: (a) AMS and (b) NB. Reaction conditions: (a) AMS concentration: 0.06 mol L−1, temperature: 26 °C, and reaction pressure: 1.0 MPa; (b) NB concentration: 0.02 mol L−1, temperature: 31 °C, reaction pressure: 1.3 MPa and catalyst loading: 5 wt%. | |
The analysis of the internal diffusion effect
Internal diffusion within the porous media was evaluated by calculating the Thiele modulus and efficiency factor, which reflects the diffusion effectiveness of reactants within catalysts. The Thiele modulus and efficiency factors of the substrates and hydrogen were calculated as shown in the ESI† (section 3). The values of efficiency factors for hydrogen and AMS were determined to be 0.994 and 0.978, and the values for hydrogen and NB were both 0.999, indicating that the effect of internal diffusion could be ignored.
The reaction kinetics at various temperatures
Experiments at various temperatures were conducted for the determination of intrinsic kinetics. With the ramping method, about ten thousand data points for each temperature were collected in approximately 45 minutes. In contrast, traditional steady-state reactions required several minutes for one data point because a steady-state was usually obtained after three times the residence time.57Fig. 5 shows the measured curve of conversion versus residence time for the hydrogenation of AMS and NB. The results show the typical kinetics curves where the conversions of AMS and NB gradually increase with the increase of temperature and residence time. The original data of conversion versus measurement time is shown in the ESI† (section 5).
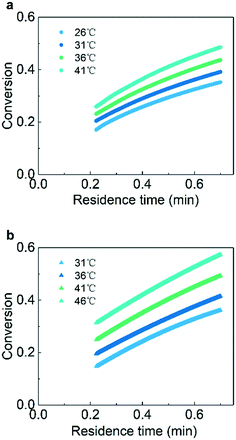 |
| | Fig. 5 The plot of conversion versus residence time at different temperatures: (a) AMS and (b) NB. Reaction conditions: (a) gas pressure: 1.0 MPa and AMS concentration: 0.06 mol L−1; (b) gas pressure: 1.3 MPa, NB concentration: 0.02 mol L−1, ramping rate: 0.02 mL min−1 min−1, and catalyst loading: 5 wt%. | |
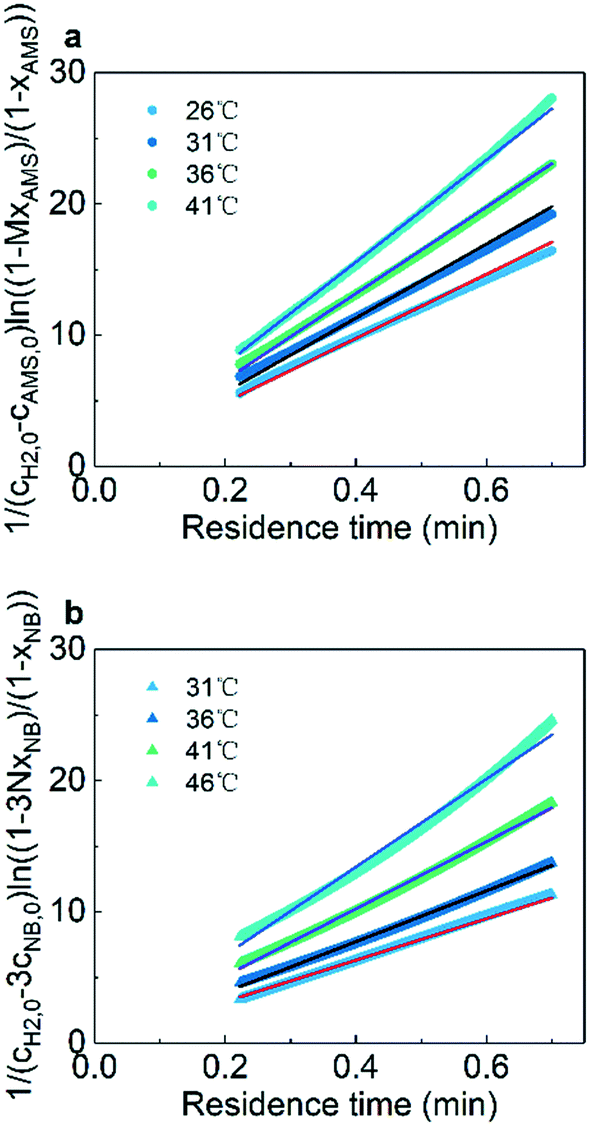
The calculation of kinetic parameters
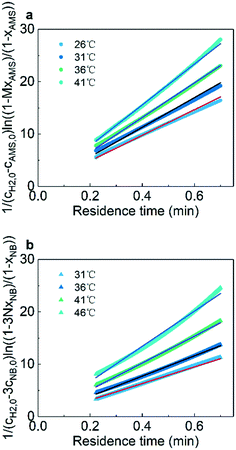
The activation energy related to the temperature and catalyst is critical to studying the kinetics for gas–liquid–solid reactions in micro-packed bed reactors. To determine the activation energies of AMS and NB, the experiments were conducted in the flow rate range of 0.37–1.2 mL min−1 with a flow ramping rate of 0.02 mL min−1 min−1. The initial concentrations of AMS and NB were 0.06 mol L−1 and 0.02 mol L−1, respectively. The concentrations of H2 at different temperatures were acquired using Henry's constants of H2 in methanol reported in our previous study.36 The catalyst loading amount in the experiments was both 86 mg. The temperatures for AMS hydrogenation were 26 °C, 31 °C, 36 °C, and 41 °C, and the temperatures for NB were 31 °C, 36 °C, 41 °C, and 46 °C. For the hydrogenation of AMS, the reaction order of hydrogen is 1 and the reaction order of AMS is 1 for a mass fraction below 5.26%.58 For hydrogenation of NB, the reaction order of hydrogen is 1 and the reaction order of NB is 1 at 0.02 mol L−1.54 Reaction rate equations for AMS and NB hydrogenation can be expressed as:| | 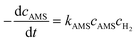 | (4) |
| |  | (5) |
Through integration of the two equations, the equations were transformed into:| |  | (6) |
| |  | (7) |
where xAMS and xNB are the conversions of AMS and NB, M = cAMS,0/cH2,0, N = cNB,0/cH2,0.
Fig. 6 shows the linear fitting results according to eqn (6) and (7) to obtain the reaction rate constants at different temperatures. The experimental data points agree well (R2 > 0.99) with the linear fitting results, indicating the effectiveness and accuracy of this strategy for the kinetics study of heterogeneous hydrogenation. Details of the calculations are given in the ESI† (section 6).
 |
| | Fig. 6 Curve fitting of reaction rate constants for (a) AMS and (b) NB at different temperatures. | |
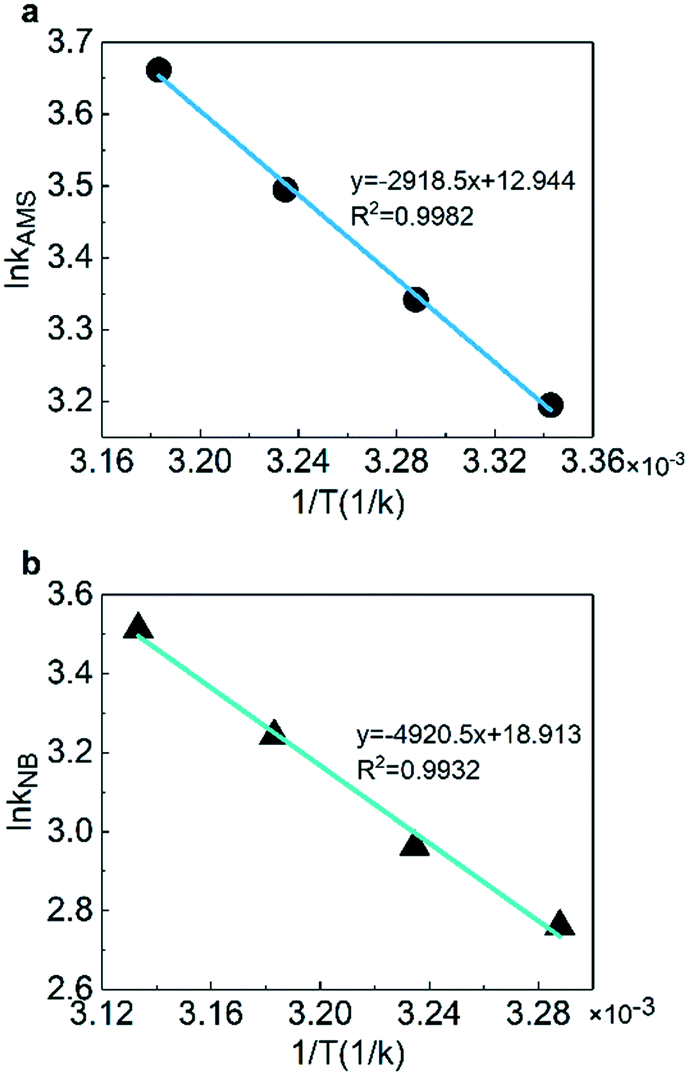
The activation energy and pre-exponential factor could be obtained with the fitting of reaction rate constants at different temperatures according to the Arrhenius equation. Fig. 7 shows the linear fitting results of ln![[thin space (1/6-em)]](https://www.rsc.org/images/entities/char_2009.gif) k versus 1/T to obtain the activation energy. The results illustrate that the pre-exponential factors are 4.183 × 10⁵ L mol−1 min−1 for AMS and 1.636 × 10⁸ L mol−1 min−1 for NB. The activation energies are 23.4 kJ mol−1 for AMS and 40.9 kJ mol−1 for NB which are consistent with the studies for AMS (20.9–31.8 kJ mol−1)59,60 and for NB (35.1–47.7 kJ mol−1),61–63 respectively, as shown in Table 2.
k versus 1/T to obtain the activation energy. The results illustrate that the pre-exponential factors are 4.183 × 10⁵ L mol−1 min−1 for AMS and 1.636 × 10⁸ L mol−1 min−1 for NB. The activation energies are 23.4 kJ mol−1 for AMS and 40.9 kJ mol−1 for NB which are consistent with the studies for AMS (20.9–31.8 kJ mol−1)59,60 and for NB (35.1–47.7 kJ mol−1),61–63 respectively, as shown in Table 2.
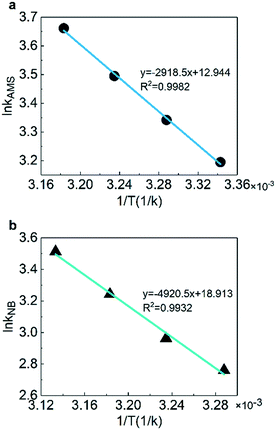 |
| | Fig. 7 Arrhenius plotting of the rate constants for (a) AMS and (b) NB. | |
Table 2 The measured kinetic parameters compared with literature values
| Reagent |
Temperature (°C) |
Pressure (bar) |
Operation mode |
Catalyst |
Catalyst loading (g) |
Activation energy (kJ mol−1) |
| AMS |
26–41 |
10 |
Continuous |
5 wt% Pd/Al2O3 |
0.043 |
23.4This study |
| AMS |
32–50 |
1 |
Continuous |
0.5 wt% Pd/Al2O3 |
2 |
20.9 (ref. 59) |
| AMS |
70–100 |
1 |
Batch |
0.5 wt% Pd/Al2O3 |
2 |
31.8 (ref. 60) |
| NB |
31–46 |
13 |
Continuous |
5 wt% Pd/Al2O3 |
0.043 |
40.9This study |
| NB |
50–250 |
5–50 |
Batch |
Ni/SiO2 |
6.7 |
35.1 (ref. 61) |
| NB |
30–70 |
20–40 |
Batch |
3 wt% Pd/C |
2.2 |
35 (ref. 62) |
| NB |
26–44 |
1 |
Batch |
1.38 wt% Pd/HEMA |
0.01 |
47.7 (ref. 63) |
The efficiency of this new method was demonstrated by the hydrogenation of AMS and NB. Ten thousand data points were obtained in less than one hour and the ramping method was extended to gas–liquid–solid reactions. With this method, the precision and accuracy of kinetics parameters could be improved remarkably. However, considering that the glass transition temperature of Teflon AF2400 is 240 °C (ref. 64) and its tensile strength is 24.5 MPa at 22 °C which decreases at higher temperature, it's better to operate below 10 MPa and 240 °C to avoid the fracture of the membrane. In this experiment, the solution concentration is as low as 0.06 mol L−1 for AMS and 0.02 mol L−1 for NB due to the low saturation concentration of H2 in solvents. This issue can be partly solved by increasing the system pressure. With the pressure limitation of the tube-in-tube contactor, this strategy is not suitable for high concentration solutions (>1 mol L−1).
Conclusions
We have developed an automated flow system for the determination of gas–liquid–solid reaction kinetics by taking advantage of flow rate ramping and a tube-in-tube contactor. The use of the latter simplifies the gas–liquid–solid reaction to a liquid–solid reaction, enabling the application of the flow ramping method. Liquid–solid mass transfer was eliminated by changing the liquid superficial velocity while keeping the same catalyst volume and residence time. It was observed that using the ramping method, the flow rate ramping is required to be lower than 0.03 mL min−1 min−1 to ensure the accuracy of results. This strategy allows collection of ten thousand data points within one hour compared with less than one hundred data points by conventional methods. The high accuracy of this approach is validated by the hydrogenation of AMS and NB as examples of typical gas–liquid–solid systems.
Nomenclature
|
t
m
| Measurement time (min) |
|
t
f
| Time for approaching the outlet of the reactor (min) |
|
t
i
| Time for approaching the inlet of the reactor (min) |
|
F
| Flow rate (mL min−1) |
|
ε
| Bed porosity |
|
V
r
| Reactor volume (cm3) |
|
V
d
| Tube volume from the reactor to UV spectrometer (cm3) |
|
Q
0
| Initial flow rate (mL min−1) |
|
a
| Flow rate ramping (mL min−1 min−1) |
|
τ
| Residence time (min) |
|
F
max
| Maximum flow rate to obtain saturated liquid (mL min−1) |
|
V
tube
| Volume of the inner tube in the tube-in-tube contactor (cm3) |
|
t
min
| Minimum residence time to obtain saturated liquid (min) |
|
c
AMS,0
| Initial concentration of AMS (mol L−1) |
|
c
AMS
| Concentration of AMS (mol L−1) |
|
c
NB,0
| Initial concentration of NB (mol L−1) |
|
c
NB
| Concentration of NB (mol L−1) |
|
c
H2,0
| Initial concentration of hydrogen (mol L−1) |
|
c
H2
| Concentration of hydrogen (mol L−1) |
|
k
AMS
| Reaction constant of AMS (min−1) |
|
k
NB
| Reaction constant of NB (L mol−1 min−1) |
|
t
AMS
| Residence time of AMS (min) |
|
t
NB
| Residence time of NB (min) |
|
x
AMS
| Conversion of AMS |
|
x
NB
| Conversion of NB |
|
T
| Temperature (K) |
Conflicts of interest
There are no conflicts to declare.
Acknowledgements
We gratefully acknowledge the support of the Novartis-MIT Center for Continuous Manufacturing, the National Natural Science Foundation of China (21978146 and 21991103) and the Tsinghua University Initiative Scientific Research Program (2019Z08QCX02) for this work.
Notes and references
- F. Pinto, S. Martins, M. Gonçalves, P. Costa, I. Gulyurtlu, A. Alves and B. Mendes, Appl. Energy, 2013, 102, 272–282 CrossRef.
- X.-B. Gong, Int. Biodeterior. Biodegrad., 2012, 70, 89–95 CrossRef.
- S. Tadepalli, R. Halder and A. Lawal, Chem. Eng. Sci., 2007, 62, 2663–2678 CrossRef.
- S. K. Tanielyan, S. R. More, R. L. Augustine and S. R. Schmidt, Org. Process Res. Dev., 2017, 21, 327–335 CrossRef.
- Y. Hao, G.-P. Hao, D.-C. Guo, C.-Z. Guo, W.-C. Li, M.-R. Li and A.-H. Lu, ChemCatChem, 2012, 4, 1595–1602 CrossRef CAS.
- S. E. Davis, M. S. Ide and R. J. Davis, Green Chem., 2013, 15, 17–45 RSC.
- A. Brennfuhrer, H. Neumann and M. Beller, Angew. Chem., Int. Ed., 2009, 48, 4114–4133 CrossRef PubMed.
- X. F. Wu, H. Neumann and M. Beller, ChemSusChem, 2013, 6, 229–241 CrossRef CAS.
- J. S. Quesnel and B. A. Arndtsen, J. Am. Chem. Soc., 2013, 135, 16841–16844 CrossRef CAS PubMed.
- Z. X. Liang, T. S. Zhao, J. B. Xu and L. D. Zhu, Electrochim. Acta, 2009, 54, 2203–2208 CrossRef CAS.
- A. Faridkhou, J.-N. Tourvieille and F. Larachi, Chem. Eng. Process.: Process Intesif., 2016, 110, 80–96 CrossRef CAS.
- C. A. Waldron, A. Pankajakshan, M. Quaglio, E. Cao, F. Galvanin and A. Gavriilidis, React. Chem. Eng., 2019, 4(9), 1623–1636 RSC.
- J. S. Moore and K. F. Jensen, Angew. Chem., Int. Ed., 2014, 53, 470–473 CrossRef CAS PubMed.
- T. Salmi, J. Hernández Carucci, M. Roche, K. Eränen, J. Wärnå and D. Murzin, Chem. Eng. Sci., 2013, 87, 306–314 CrossRef CAS.
- V. Burkle-Vitzthum, F. Moulis, J. Zhang, J.-M. Commenge, E. Schaer and P.-M. Marquaire, Chem. Eng. Res. Des., 2015, 94, 611–623 CrossRef CAS.
- K. F. Jensen, AIChE J., 2017, 63, 858–869 CrossRef CAS.
- T. D. White, K. D. Berglund, J. M. Groh, M. D. Johnson, R. D. Miller and M. H. Yates, Org. Process Res. Dev., 2012, 16, 939–957 CrossRef CAS.
- P. Poechlauer, J. Colberg, E. Fisher, M. Jansen, M. D. Johnson, S. G. Koenig, M. Lawler, T. Laporte, J. Manley, B. Martin and A. O'Kearney-McMullan, Org. Process Res. Dev., 2013, 17, 1472–1478 CrossRef CAS.
- F. E. Valera, M. Quaranta, A. Moran, J. Blacker, A. Armstrong, J. T. Cabral and D. G. Blackmond, Angew. Chem., Int. Ed., 2010, 49, 2478–2485 CrossRef CAS PubMed.
- A. Mulchandani, J. H. T. Luong and A. Leduy, Biotechnol. Bioeng., 1988, 32, 639–646 CrossRef CAS PubMed.
- D. C. W. Tsang and I. M. C. Lo, Environ. Sci. Technol., 2006, 40, 6655–6661 CrossRef CAS PubMed.
- H. Song, J. D. Tice and R. F. Ismagilov, Angew. Chem., Int. Ed., 2003, 42, 768–772 CrossRef CAS PubMed.
- P.
J. Nieuwland, R. Segers, K. Koch, J. C. M. van Hest and F. P. J. T. Rutjes, Org. Process Res. Dev., 2011, 15, 783–787 CrossRef CAS.
- J. P. McMullen and K. F. Jensen, Org. Process Res. Dev., 2011, 15, 398–407 CrossRef CAS.
- B. J. Reizman and K. F. Jensen, Org. Process Res. Dev., 2012, 16, 1770–1782 CrossRef CAS.
- C. A. Hone, N. Holmes, G. R. Akien, R. A. Bourne and F. L. Muller, React. Chem. Eng., 2017, 2, 103–108 RSC.
- K. C. Aroh and K. F. Jensen, React. Chem. Eng., 2018, 3, 94–101 RSC.
- C. P. Haas and U. Tallarek, ChemistryOpen, 2019, 8, 606–614 CrossRef CAS PubMed.
- P. Sagmeister, J. Poms, J. D. Williams and C. O. Kappe, React. Chem. Eng., 2020, 5, 677–684 RSC.
- N. Cherkasov, Y. Bai, A. J. Expósito and E. V. Rebrov, React. Chem. Eng., 2018, 3, 769–780 RSC.
- C. A. Hone, N. Holmes, G. R. Akien, R. A. Bourne and F. L. Muller, React. Chem. Eng., 2017, 2, 103–108 RSC.
- N. Al-Rifai, F. Galvanin, M. Morad, E. Cao, S. Cattaneo, M. Sankar, V. Dua, G. Hutchings and A. Gavriilidis, Chem. Eng. Sci., 2016, 149, 129–142 CrossRef CAS.
- A. Faridkhou and F. Larachi, Ind. Eng. Chem. Res., 2012, 51, 16495–16504 CrossRef CAS.
- A. Faridkhou, M. Hamidipour and F. Larachi, Chem. Eng. J., 2013, 223, 425–435 CrossRef CAS.
- S. Haase, M. Weiss, R. Langsch, T. Bauer and R. Lange, Chem. Eng. Sci., 2013, 94, 224–236 CrossRef CAS.
- J. Zhang, A. R. Teixeira, H. Zhang and K. F. Jensen, Anal. Chem., 2017, 89, 8524–8530 CrossRef CAS PubMed.
- J. Zhang, A. R. Teixeira and K. F. Jensen, AIChE J., 2018, 64, 564–570 CrossRef CAS.
- S. Ley, D. Browne, M. O'Brien, P. Koos, P. Cranwell and A. Polyzos, Synlett, 2012, 23, 1402–1406 CrossRef.
- M. Brzozowski, M. O'Brien, S. V. Ley and A. Polyzos, Acc. Chem. Res., 2015, 48, 349–362 CrossRef CAS.
- L. Yang and K. F. Jensen, Org. Process Res. Dev., 2013, 17, 927–933 CrossRef CAS.
- S. Newton, S. V. Ley, E. C. Arcé and D. M. Grainger, Adv. Synth. Catal., 2012, 354, 1805–1812 CrossRef CAS.
- M. W. Losey, M. A. Schmidt and K. F. Jensen, Ind. Eng. Chem. Res., 2001, 40, 2555–2562 CrossRef CAS.
- M. O'Brien, I. R. Baxendale and S. V. Ley, Org. Lett., 2010, 12, 1596–1598 CrossRef.
- M. O'Brien, N. Taylor, A. Polyzos, I. R. Baxendale and S. V. Ley, Chem. Sci., 2011, 2, 1250–1257 RSC.
- P. Koos, U. Gross, A. Polyzos, M. O'Brien, I. Baxendale and S. V. Ley, Org. Biomol. Chem., 2011, 9, 6903–6908 RSC.
- J. C. Pastre, D. L. Browne, M. O'Brien and S. V. Ley, Org. Process Res. Dev., 2013, 17, 1183–1191 CrossRef CAS.
- P. B. Cranwell, M. O'Brien, D. L. Browne, P. Koos, A. Polyzos, M. Pena-Lopez and S. V. Ley, Org. Biomol. Chem., 2012, 10, 5774–5779 RSC.
- M. Lan, Z. Zhao, Q. Zeng, C. Zhou and J. Zhang, Ind. Eng. Chem. Res., 2019, 58, 6696–6703 CrossRef CAS.
-
L. D. Schmidt, The engineering of chemical reactions, Oxford University Press, USA, 1998 Search PubMed.
- C. Yang, A. R. Teixeira, Y. Shi, S. C. Born, H. Lin, Y. L. Song, B. Martin, B. Schenkel, M. P. Lachegurabi and K. F. Jensen, Green Chem., 2018, 20, 886–893 RSC.
- L. Sang, J. Tu, H. Cheng, G. Luo and J. Zhang, AIChE J., 2020, 66(2), e16803 CrossRef CAS.
- V. Meille, C. de Bellefon and D. Schweich, Ind. Eng. Chem. Res., 2002, 41, 1711–1715 CrossRef CAS.
- J. Wang, Z. Yuan, R. Nie, Z. Hou and X. Zheng, Ind. Eng. Chem. Res., 2010, 49, 4664–4669 CrossRef CAS.
- A. L. M. Angeles, B. B. Victoriano, J. S. I. I. Cesar, M. R. J. María and R. L. Francisco, Bull. Chem. Soc. Jpn., 1987, 60, 3415–3419 CrossRef.
- S. Schwolow, F. Braun, M. Rädle, N. Kockmann and T. Röder, Org. Process Res. Dev., 2015, 19, 1286–1292 CrossRef CAS.
- T. Durand, C. Henry, D. Bolien, D. C. Harrowven, S. Bloodworth, X. Franck and R. J. Whitby, React. Chem. Eng., 2016, 1, 82–89 RSC.
- J. Tu, L. Sang, H. Cheng, N. Ai and J. Zhang, Org. Process Res. Dev., 2019, 24(1), 59–66 CrossRef.
- P. Cini and M. P. Harold, AIChE J., 1991, 37, 997–1008 CrossRef CAS.
- S. Morita and J. M. Smith, Ind. Eng. Chem. Fundam., 1978, 17, 113–120 CrossRef CAS.
- C. N. Satterfield, Y. H. Ma and T. K. Sherwood, Inst. Chem. Eng. Symp. Ser., 1968, 28, 22 Search PubMed.
- J. Relvas, R. Andrade, F. G. Freire, F. Lemos, P. Araújo, M. J. Pinho, C. P. Nunes and F. R. Ribeiro, Catal. Today, 2008, 133–135, 828–835 CrossRef CAS.
- M. Turáková, T. Salmi, K. Eränen, J. Wärnå, D. Y. Murzin and M. Králik, Appl. Catal., A, 2015, 499, 66–76 CrossRef.
- S. Tong, K. O'Driscoll and G. Rempel, Can. J. Chem. Eng., 1978, 56, 340–345 CrossRef CAS.
- I. Pinnau and L. G. Toy, J. Membr. Sci., 1996, 109, 125–134 CrossRef CAS.
Footnote |
| † Electronic supplementary information (ESI) available. See DOI: 10.1039/d0re00191k |
|
| This journal is © The Royal Society of Chemistry 2020 |
Click here to see how this site uses Cookies. View our privacy policy here. 
 Open Access Article
 This Open Access Article is licensed under a
  c,
Le
Sang
a,
Klavs F.
Jensen
c,
Le
Sang
a,
Klavs F.
Jensen