 Open Access Article
A modular 3D printed isothermal heat flow calorimeter for reaction calorimetry in continuous flow†
Manuel C.
Maier
 ab,
Michael
Leitner
ab,
C. Oliver
Kappe
ab,
Michael
Leitner
ab,
C. Oliver
Kappe
 bc and
Heidrun
Gruber-Woelfler
 *ab
*ab
aInstitute of Process and Particle Engineering, Graz University of Technology, Graz, Austria. E-mail: woelfler@tugraz.at
bCenter for Continuous Flow Synthesis and Processing (CC FLOW), Research Center Pharmaceutical Engineering GmbH (RCPE), Graz, Austria
cInstitute of Chemistry, University of Graz, Graz, Austria
First published on 27th May 2020
Abstract
Utilization of highly reactive compounds in novel flow syntheses requires new tools for process development. This work presents such a tool in the form of a modular calorimeter designed for direct heat flux measurements in continuous flow applications. The calorimeter consists mainly of 3D printed parts, which can be adapted and reassembled easily to meet user-defined applications. By utilizing selective laser melting (SLM) of stainless steel and digital light processing (DLP) of a UV curable resin, a device is produced to meet the requirements of handling highly reactive organic compounds. Calorimeter segments are temperature-regulated independently of each other by a microcontroller, allowing isothermal operation conditions. Direct heat flux measurements are possible in the device through Seebeck elements which are calibrated internally at prevailing process conditions with the aid of heating foils. Functionality of the designed calorimeter is shown by good agreement of conducted heat flux measurements with literature.
Introduction
New synthetic pathways are enabled in flow chemistry by utilizing highly reactive compounds in milli and micro fluidic devices.1,2 During development of these syntheses, thermodynamic, fluid dynamic, and kinetic investigations are rarely included, but are obligatory for a safe and efficient industrial application. Development is mainly carried out in milli and micro fluidic devices, whereby isothermal conditions are often assumed due to high surface-to-volume ratios and the resulting high heat transfer rates.3 Based on this assumption, possible hot spot formation is not checked and misinterpretation of reaction data can occur.4 By trying to achieve higher productivities of the used milli and micro devices by scale-out, underestimation of the length scale change can affect reactor performance and therefore the reaction outcome.5 In this context, scale-out is defined as a slight change of a length scale to increase productivity, while preserving characteristics of the reactor, such as flow regime or surface phenomena. In addition, reaction and mixture data for these new syntheses are most of the time not easily available since a variety of different substances can be formed at slightly different reaction conditions. However, these data are required for safety evaluations as well as for an efficient process.6Reaction calorimetrical investigations with their different modes of operation7 play a crucial role to provide fundamental data like enthalpy of reaction, activation energy, heat capacity of a reaction mixture as well as reaction rate. A key parameter for reactor design and safety evaluation is the reaction enthalpy. Standard equipment for reaction enthalpy measurements like batch calorimeters, e.g. the RC1 from Mettler Toledo,8 can only be used to a certain extent for novel reactions under extreme reaction conditions as seen today in flow chemistry. While there exist batch calorimeters with relatively small volumes,9–11 their mode of operation is different compared to flow chemical setups, i.e. they cannot provide the conditions required to gather meaningful thermodynamic and kinetic data for continuous flow applications in harsh reaction environments.
Modifying batch calorimeters to meet flow applications is possible through standard HPLC equipment,12 nevertheless, this approach has some drawbacks. It does not provide optimal connectivity of parts to the calorimeter, leads very often to poor mixing performance caused by standard laboratory tubing and connectors, and requires existing software to be adaptable. Another possibility to use existing technology for heat flux measurements is infrared thermography.13 Disadvantages of this method are a required optical access to the ongoing reaction as well as an expensive camera providing necessary resolution of the small channels.
Flow calorimeters recently developed use thermoelectric principles to directly detect heat fluxes through the Seebeck effect.14–19 Their general setup consists of a chip-like reactor separated from a heat sink by Seebeck elements which generate voltage signals proportional to the transferred heat flux. These elements can be manufactured directly on the reactor chip14,15 or bigger and cheaper commercially available Seebeck elements can be used.18 By miniaturization of Seebeck elements, spatially resolved measurements are shown and additional information about reaction time scales are obtained by some designs.17,18 Calibration of the Seebeck elements can be done externally or internally by integrated heating in the assembled device, which accounts for heat losses of the system.17,19
All of the mentioned designs lack the possibility to react locally to changing temperature caused by a reaction in the corresponding section of the reactor. Heat fluxes from each section are transferred through a Seebeck element uniformly to one heat sink, with its temperature being regulated by a thermostat set to the desired reaction temperature. Sufficient heat transfer from heat sink to reactor cannot always be ensured in such a setup due to the poor heat transfer characteristics of the utilized Seebeck elements. As a result, isothermal conditions cannot be achieved if highly reactive compounds are used and formation of local hot spots within the reactor is likely. To overcome the poor thermal conductivity of Seebeck elements, it is desired to control locally the temperature within a reactor by specifically applying increased heat fluxes.
The designed calorimeter described within this work is guided by the abovementioned devices but utilizing the advantages of 3D printing as well as already existing knowledge of reactor design20,21 and microcontroller-based regulation. We present here a novel isothermal heat flow calorimeter which can withstand harsh reaction conditions commonly found in flow chemistry by a combination of two different additive manufacturing techniques and cheap, commercially-available electronics. In addition to its modular and extendable design, the calorimeter's segments are regulated independently from each other and allow to react locally to ongoing reactions. Applicability of the flow calorimeter is shown by studying thermodynamic properties such as reaction enthalpy, heat capacity and molar excess enthalpy, and thus providing necessary data for reactor scale-out as well as safety aspects.
Experimental
Design of the flow calorimeter
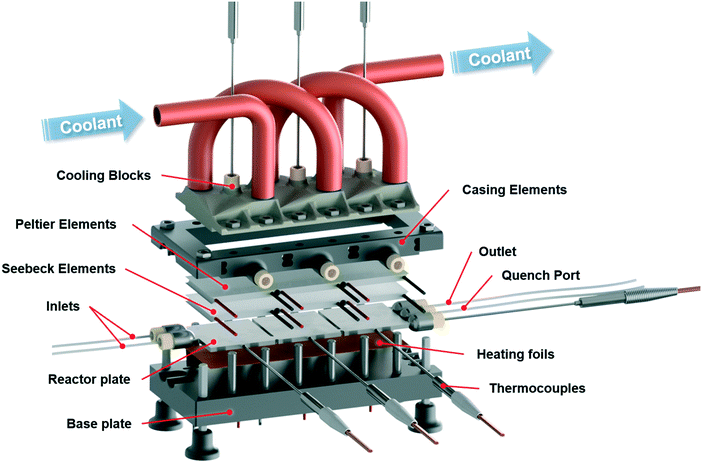
The presented calorimeter features modular and extendable segments with exchangeable elements, as shown in Fig. 1 and S3 in the ESI.† Its elements were designed to utilize advantages of additive manufacturing by accommodating readily available commercial laboratory and electrical components while focusing on reducing standard manufacturing processes. This design for additive manufacturing enables the production of highly complex geometries in a short time with minimal waste.Two additive manufacturing techniques were used to manufacture the device, selective laser melting (SLM) and digital light processing (DLP). Reactor plate and cooling blocks were manufactured by SLM of stainless steel to provide high chemical and mechanical stability as well as excellent heat transfer rates, allowing the usage of highly reactive compounds and organic solvents at elevated pressures. The casing of the calorimeter was manufactured by DLP of a cheap UV-curable resin. This material in combination with an internal support structure showed good thermal insulation against the environment while providing necessary strength to fixate the whole device. Both manufacturing techniques allow reactor elements to be produced, which can be easily modified to meet a desired configuration of the device in terms of number of reaction segments with different size and mixing geometries.
The calorimeter measures direct heat fluxes using the thermoelectric Seebeck effect with the aid of Seebeck elements contacting the reactor plate. A Seebeck element consists of a series of thermocouples, which themselves are consisting of two dissimilar electrical conductors connected at one end. By applying different temperatures at each end of a thermocouple, it generates an electrical voltage proportional to the temperature difference. By arranging thermocouples in series across two surface areas as within Seebeck elements, it is possible to measure the transferred heat by means of an electrical voltage. Conversely, when a voltage is applied to such a device, a hot and cold side is formed, which allows it to transfer heat. This configuration is described by the Peltier effect and the same electronic components are referred to as Peltier elements within this work.
The generated voltages from the Seebeck elements are measured by a self-made electrical circuit utilizing a microcontroller which is programmed with the Arduino integrated development environment (IDE). To obtain the actual heat flux, a calibration with integrated heating foils has to be made. With these heaters, an exothermic reaction can be simulated and by applying a defined power input, a calibration at prevailing process conditions can be obtained. This calibration already accounts for heat losses of the device operated at a defined temperature. Influences of the heating foils during an actual calorimetric measurement were not investigated and neglected as they are assumed to be very small. Furthermore, ideal heat input of the heating foils was assumed within this work.
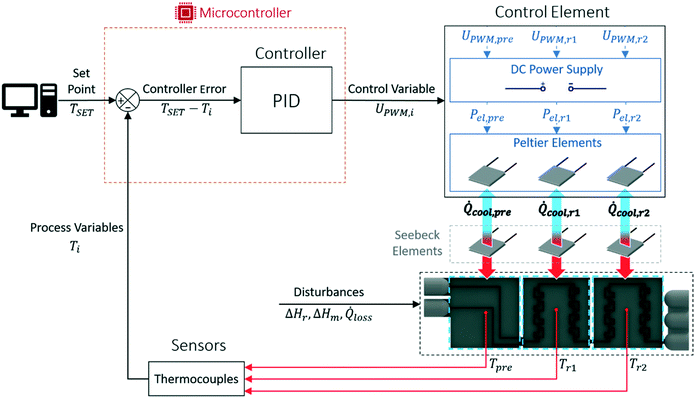
In contrast to other designs,17,18 this device features a microcontroller-based temperature control of each calorimeter segment. This allows to ensure an operation of each segment independently as close as possible to the desired isothermal set point. The reactor segment's temperature is measured and transmitted to a microcontroller which adjusts the heat flux of a Peltier element through a PID based control strategy, see Fig. 2.
Reactor control strategy
Isothermal temperatures are ensured in the designed calorimeter through a PID control of each reactor segment separately. Here the advantages of additive manufacturing allow accommodation of standard commercial electronic parts, which are used in this temperature regulation. The standard regulation circuit to achieve this constant temperature is shown in Fig. 2. This circuit is continuously repeated and started by measuring the temperature of each reactor segment via thermocouples (TJ36-CPSS-116G-4, omega.de) attached in the middle of each reactor segment. The small voltage signal produced by a thermocouple is recognized by an amplifier (MAX31856, adafruit.com) which directly converts this voltage to a readable temperature within the same chip and transfers it to the microcontroller (Arduino Mega 2560). The continuously looping control strategy of the microcontroller is implemented through the Arduino IDE and compares the desired temperature set point for each reactor segment to the measured values. The calculated controller errors are passed through a standard PID control procedure and lead to specific set values of the current time step. These set values are correlated to electrical voltages between 0 to 5 V through an on board pulse width modulation (PWM) of the microcontroller which gradually opens the gates of metal oxide semiconductor field-effect transistors (MOSFET; IRFZ 44N, reichelt.at) to supply a defined amount of current to each cooling Peltier element (QC-127-1.4-6.0MS, quick-cool-shop.de). This defined electrical current to the Peltier element generates a heat sink depending on the operation of each reactor segment. To ensure a steady cooling performance, the hot sides of the Peltier elements are cooled by the custom-designed and SLM printed cooling blocks. The cold side of the Peltier elements contacts Seebeck elements of identical construction, which recognise the heat fluxes from the respective reactor segments. Before repeating the control circuit, the measured data is written to a COM port of the microcontroller and is directly processed via an attached PC. Evaluation of the steady state data can be carried out by calculating mean values over a user-defined interval via spreadsheet calculations.The control strategy presented above only allows the investigation of exothermic measurements. Endothermic measurements can be recognized by the Seebeck elements, since the thermoelectric voltage can change signs. However, the electrical contacts of the Peltier elements would have to be switched to enable a temperature control. This would result in switched cold and hot sides to provide the necessary heating of endothermic events. In addition, no internal calibration for endothermic events is possible with the implemented heating foils.
PID characteristics
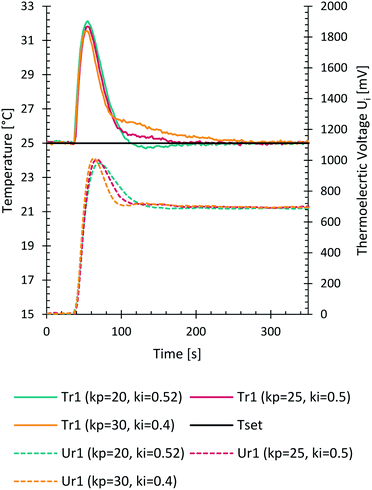
PID parameters influence the time needed to reach a certain set point and account for varying heat fluxes in the system. First estimation of PID parameters was done by experimental step response evaluations, based on a known and sudden electrical heat flux applied to the reactor segments through the integrated heating foils, Fig. 3. A later fine tuning of parameters led to PID values of P = 20, I = 0.52 and D = 0 for cooling at 25 °C. The differential parameter was set to zero since it was not necessary to account its depressing effect for sudden high valued changes in the recorded signals. The parameters depend also on the time needed for each control loop performed on the microcontroller. With these parameters a steady state was reached after approximately 2.5 minutes starting from the sudden change.Manufacturing – 3D printing
Elements of the calorimeter that require high thermal conductivity, good chemical stability, and mechanical strength were manufactured by SLM of stainless steel. One of these elements was the reactor plate with the integrated reaction channel and connector ports. The other parts printed with SLM were the cooling blocks. These elements were 3D printed according to modified CAD models with software-generated support structures to provide the necessary stability and layer-wise connection during the printing procedure. Especially the thin connection points between reactor segments had to be modified to withstand deformation caused by thermal stresses during the manufacturing. Additional material was added to account for such deformations as well as to provide sufficient space for surface modification to allow later an exact contact between the printed parts and electronic components.The reactor plate was designed with a precooling section and two reaction sections utilizing a split and recombine structure, Fig. 2. The internal diameter was set to 0.8 mm, which gives a combined reaction volume of 220 μL for both reaction segments. Due to the modular design, these reaction sections can be duplicated and changed depending on the desired task to reach a defined residence time as well as mixing properties. Reactor sections were separated from each other to reduce heat conduction between them. The additional material mentioned above was removed by laser cutting to separate the sections. Connections of the reactor plate to peripheral tubing can be made with standard flat bottom HPLC fittings. Maximum operation pressure of the reactor is therefore limited only by the specifications of the used fittings, in this case 100 bar.
The designed cooling block for heat removal of the Peltier elements needed an internal support structure before printing (see ESI† Fig. S1). Besides being necessary for fabrication, this structure increases the internal contact area for the heat transfer of the coolant to the metal. If needed, a connector port for temperature measurements close to the Peltier contact area can be implemented as well. This temperature measurement is indicated in Fig. 1, but was not used within this work.
Additive manufacturing was then carried out by an SLM system from EOS which utilizes an ytterbium fibre laser with 400 Watt maximum power input, scanning through each of the 40 μm high sliced layers. A 316L stainless steel powder bed with a mean particle size of 35.9 μm was used for the calorimeter elements. Post-processing of the stainless steel parts included several cleaning procedures with compressed air, treatments within an ultrasonic bath to free entrapped particles, sandblasting of the outer surfaces, CNC milling and laser cutting to achieve the planned geometries. Accurate contact of the reactor plate and cooling block to the Seebeck and Peltier elements was ensured by the CNC milled surfaces, which have the same roughness properties as standard milled stainless steel parts. Besides removing of excess particles, no further surface treatment of the internal channels was carried out.
Casing elements of the calorimeter were designed to be easily 3D printable without any additional support structure, see Fig. S2 in ESI.† All elements feature prism like internal structures, which connect each layer, give the parts necessary mechanical strength, reduce the amount of material needed during production and provide necessary thermal insulation against the environment. All casing elements were designed to be printed by DLP of a UV curable resin. The elements were produced with the Photon from Anycubic and a standard black resin from the same manufacturer. Based on preliminary knowledge of the printer, a layer height of 50 μm with a normal exposure time of 14 seconds was chosen to produce the casing elements. Due to the small printing area of the device, several printing jobs had to be carried out but the whole production time did not exceed two days. By using this approach of 3D printed casing, future adaption and extension of the calorimeter can be easily carried out. Post-processing of these parts included only the removal of the parts from the build platform and cleaning with ethanol. The parts could be used directly after printing but a final curing in sunlight until the next day was envisioned.
Reactor setup and external equipment
The experimental setup shown in Fig. 4 was used within this work. For continuous measurements, the designed calorimeter needed additional equipment to solve the overall heat balance. To close the heat balance, it was necessary to add additional temperature sensors in both inlet streams. Here, standard T-junctions (PEEK, bore 0.020 in, thread 10–32) were modified by drilling a 1.6 mm hole in the middle connector to bring the sensor tips within the flowing liquid stream. Due to fluctuations of room temperature, a heat exchanger was added to bring both inlets to a steady temperature. For this heat exchanger, stainless steel coils (1/16′′ OD, 0.03′′ ID, 1 m) were used and heated within a water bath on top of the heating plate of a laboratory magnetic stirrer (IKA® RCT standard). Fluids were pumped into the reactor with HPLC pumps (Knauer Azura P4.1S) utilizing back pressure regulator (BPR) to achieve a smoother operation of these pumps and a certain backpressure over the reactor. For the mixing characterization, the HPLC pumps were exchanged with syringe pumps (Lambda VIT-FIT) due to the pulsing nature of the HPLC pumps used, which influences the mixing performance. Within these experiments, no BPRs were used. A constant operation of the calorimeter segments was envisioned by a continuous coolant supply from a thermostat (Lauda Alpha Ra12) to the cooling blocks.Heat balance of the system
A heat balance of the reactor plate is needed in addition to the direct heat flux measurements for the calculation of the produced reaction heat. A general heat balance is depicted in eqn (1). | (1) |
![[Q with combining dot above]](https://www.rsc.org/images/entities/i_char_0051_0307.gif) rx shown in eqn (2) is depending on the total volumetric flow rate
rx shown in eqn (2) is depending on the total volumetric flow rate ![[V with combining dot above]](https://www.rsc.org/images/entities/i_char_0056_0307.gif) , initial and limiting concentration co, molar reaction enthalpy ΔhR and chemical conversion X regarding the rate limiting substance.
, initial and limiting concentration co, molar reaction enthalpy ΔhR and chemical conversion X regarding the rate limiting substance.![[Q with combining dot above]](https://www.rsc.org/images/entities/i_char_0051_0307.gif) rx = rx = ![[V with combining dot above]](https://www.rsc.org/images/entities/i_char_0056_0307.gif) coΔhRX coΔhRX | (2) |
![[Q with combining dot above]](https://www.rsc.org/images/entities/i_char_0051_0307.gif) conv of inlet and outlet streams are shown in eqn (3)–(5) with temperature Ti, density ρi, molecular mass MMi, and molar specific heat capacity cP,i of a respective substance or mixture at fluid port A, B or out. In these equations, Tset was used as reference temperature and a sign convention was used throughout this work which depicts heat carried out of the system with negative values.
conv of inlet and outlet streams are shown in eqn (3)–(5) with temperature Ti, density ρi, molecular mass MMi, and molar specific heat capacity cP,i of a respective substance or mixture at fluid port A, B or out. In these equations, Tset was used as reference temperature and a sign convention was used throughout this work which depicts heat carried out of the system with negative values. | (3) |
 | (4) |
 | (5) |
![[Q with combining dot above]](https://www.rsc.org/images/entities/i_char_0051_0307.gif) tr as shown in eqn (6).
tr as shown in eqn (6).![[Q with combining dot above]](https://www.rsc.org/images/entities/i_char_0051_0307.gif) tr = tr = ![[Q with combining dot above]](https://www.rsc.org/images/entities/i_char_0051_0307.gif) tr,pre + tr,pre + ![[Q with combining dot above]](https://www.rsc.org/images/entities/i_char_0051_0307.gif) tr,r1 + tr,r1 + ![[Q with combining dot above]](https://www.rsc.org/images/entities/i_char_0051_0307.gif) tr,r2 tr,r2 | (6) |
![[Q with combining dot above]](https://www.rsc.org/images/entities/i_char_0051_0307.gif) tr,i = fcalibr (USE,i) tr,i = fcalibr (USE,i) | (7) |
In a steady state operation, the temporal change of energy equals zero in eqn (1) and the reaction enthalpy can be calculated as shown in eqn (8) whereby convective heat fluxes of inlet streams need to be subtracted and the heat fluxes of the outlet have to be added.
 | (8) |
Reaction to characterize mixing efficiency
A key parameter to perform homogeneous flow syntheses is mixing performance. Depending on the intrinsic reaction rate of a synthesis, different products and side products can be obtained if mixing of two miscible streams is the rate limiting factor. Therefore, mixing performance of the designed reactor plate was evaluated experimentally. This can be done with mixing-sensitive reactions, e.g. a system with consecutive and competitive reactions as described in literature.22,23 Despite being well documented, the Villermaux–Dushman system23 is adapted in various works to customize the redox reaction to the mixing time of the reactor, which complicates a comparison of different reactors.24,25 Also, the reaction can be altered by light, heat, and dissolved oxygen.26Because of these limitations, the diazo coupling published by Bourne et al.22 was chosen for mixing evaluations of the designed reactor plate, see Scheme S1 in the ESI.† In a first step, diazo coupling of 1-naphthol (A) and diazotised sulfanilic acid (B) takes place and gives the monoazo isomers p-R and o-R. Poor mixing promotes the secondary coupling of p-R and o-R with B giving the bisazo dye S. Better mixing is indicated by less formation of the secondary coupling product S.
 | (9) |
 | (10) |
 | (11) |
 | (12) |
Solutions were pumped with equal flow rates through the reactor plate at total flow rates of 0.2, 0.5, 1, 2, 4, 6, 8 and 10 ml min−1. Samples were collected after approximately three residence times and stored in a dark container. Before analysis, samples needed to be diluted (1![[thin space (1/6-em)]](https://www.rsc.org/images/entities/char_2009.gif) :
:![[thin space (1/6-em)]](https://www.rsc.org/images/entities/char_2009.gif) 8) with the 444.4 mM buffer to account for the long path length of 10 mm of the available UV-vis flow cell (Flow Cell-Z-10, Avantes). Spectral data was produced by passing the light from a UV light source (AvaLight-DS-DUV) through the flow cell and to a detector (AvaSpec-ULS2048) with an integration time of 1.05 ms, averaging of 100 samples and saving the obtained data from an interval of 390 to 700 nm in 10 nm steps. Concentrations were calculated by a multi-parameter-linear-regression of the absorption spectra as described in a previous work.21
8) with the 444.4 mM buffer to account for the long path length of 10 mm of the available UV-vis flow cell (Flow Cell-Z-10, Avantes). Spectral data was produced by passing the light from a UV light source (AvaLight-DS-DUV) through the flow cell and to a detector (AvaSpec-ULS2048) with an integration time of 1.05 ms, averaging of 100 samples and saving the obtained data from an interval of 390 to 700 nm in 10 nm steps. Concentrations were calculated by a multi-parameter-linear-regression of the absorption spectra as described in a previous work.21
Calorimeter calibration
Direct calibration of the assembled calorimeter is possible through the incorporated heating foils. This calibration method can account for heat losses to the environment already during calibration. To increase the measurement accuracy of the device, a calibration for each temperature set point should be made.For the calibration of each reactor segment, a known and steady electrical heat flux was supplied to the respective segment simultaneously. This heat flux was delivered by integrated heating foils (TSC0400040gR7.91, pelonistechnologies.com) for each reactor segment separately and recognized by the respective Seebeck element opposite the reactor plate as a thermoelectric voltage USE,i. Heating foils were connected in parallel to a power supply (Manson NRP-3630) which provided a known electrical power input. Each foil's electrical resistance had to be measured to calculate the true applied electrical heat flux for the respective foil. Because of the inaccurate voltage and current display of the power supply, an exact voltage and current measurement was installed with digital multimeters for exact power input characterization. Changes in the electrical resistance of all elements (ESI† Fig. S4) were seen by varying temperatures with a changing overall resistance of the system. This changing resistance was accounted in the calibration experiments. Calibration data was obtained at steady state conditions with 31 points between zero and 7 W applied to each reactor segment for an operation temperature of 25 °C.
Functionality test of the calorimeter setup
A functionality test of the whole setup was carried out by adding warm deionized water into the calorimeter with the goal to cool it down to 25 °C and measure the transferred heat. In addition to the heat transfer evaluation, it was also planned to see how the calorimeter reacts to unstable inlet conditions. To achieve such an unstable behaviour, the precooling water bath was heated to approximately 40 °C and set to 36 °C in the beginning of the experiment when the pumps were started. The slow cooling of the water bath generated varying inlet temperatures. Together with changing pump rates of 0.5, 1, 2, 3, 4 and 5 ml min−1 for the respective pumps, unstable inlet conditions were simulated. All experiments were carried out twice except for the flow rate of 5 ml min−1.Reaction to generate heat fluxes
To verify performance of the reaction calorimeter, exothermic neutralization of sodium hydroxide (NaOH) with acetic acid (AcOH) was used. The reaction equation of this neutralization is depicted in eqn (13).| CH3COOH + NaOH → H2O + CH3COONa | (13) |
Excess molar enthalpy measurements
Excess molar enthalpy HE is an essential thermodynamic property for the design of chemical processes, which address the non-linearity of solutions. It can be used to determine the vapour–liquid equilibria by utilizing the Gibbs–Helmholtz equation.28,29To demonstrate an additional application of the designed calorimeter, measurements of excess molar enthalpy of methanol (CHROMASOLV™ ≥99.9%, Honeywell) and deionized water at 25 °C were carried out. Within the experiments a constant total flow rate of 4 ml min−1 was used while different flow rates of the respective pumps were set to obtain mixture data throughout the binary system.
Additional heat capacity measurements
The segment-wise control of each reaction sections makes it possible to set different temperatures and therefore gives another possibility to calculate heat capacities of the pumped liquids if the mass flux is known. For this kind of experiment, the precooling plate was set to 25 °C and both reaction segments were set to 23 °C. A different mode of operation like this requires a new calibration to recognize the heat necessary to decrease the flowing fluids temperature by the calorimeter. To prove this measurement principle, water was pumped through the calorimeter equally with both pumps at total flow rates of 2, 4, 6, 8, 10, 12 and 14 ml min−1. Operating points between 2 and 10 ml min−1 were repeated twice.Results and discussion
Reactor plate performance evaluation
Applicability of the designed reactor plate for fast reactions was evaluated prior to heat flux measurements. For this evaluation mixing performance of the reactor plate was investigated with a mixing sensitive reaction system proposed by Bourne et al.22 Product formation and therefore decreasing yield of the bisazo dye S indicates a high mixing performance. As shown in Fig. 5, relatively low yields were obtained at total flow rates above 4 ml min−1 for the designed reactor plate. Therefore, the current calorimeter/reactor design should be operated at total flow rates above 4 ml min−1 to achieve sufficient mixing performance if the reaction is known to be fast and limited by mixing. Late mixing within the designed calorimeter would influence the product formation of a fast and mixing sensitive reaction but does not influence the heat flux detection. A reaction without mixing sensitivity would proceed to produce heat downstream until the fluid is well mixed and the reaction is completed.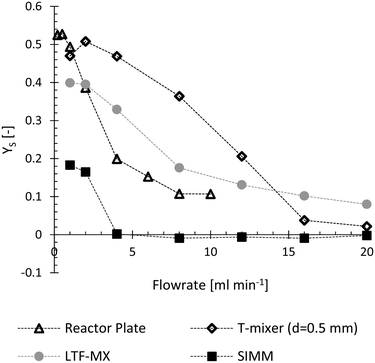 | ||
| Fig. 5 Evaluation of the reactor plate's mixing performance. Lower yield of the bisazo dye S at higher flow rates indicates increasing mixing performance. The evaluated reactor plate performed well compared to commercial mixers evaluated within literature.30 It is compared to a standard T-mixer (Upchurch Scientific), an X-mixer (Little Things Factory GmbH, type X) and the Slit interdigital micromixer SIMM-V2-ss (Institut für Mikrotechnik Mainz GmbH). | ||
A comparison of reactor performance with literature is possible with the Bourne reaction since it was carried out at the proposed standard conditions.27 Compared to commercial equipment,30 the designed reactor plate performed very well. It is compared in Fig. 5 with a standard T-mixer (Upchurch Scientific), a X-mixer (Little Things Factory GmbH, type X) and the Slit interdigital micromixer SIMM-V2-ss (Institut für Mikrotechnik Mainz GmbH). This comparison is of course still dependent on the chosen pumps; however, both evaluations utilized high-accuracy syringe pumps and similar pumping performance can be assumed.
Calibration with integrated heating foils
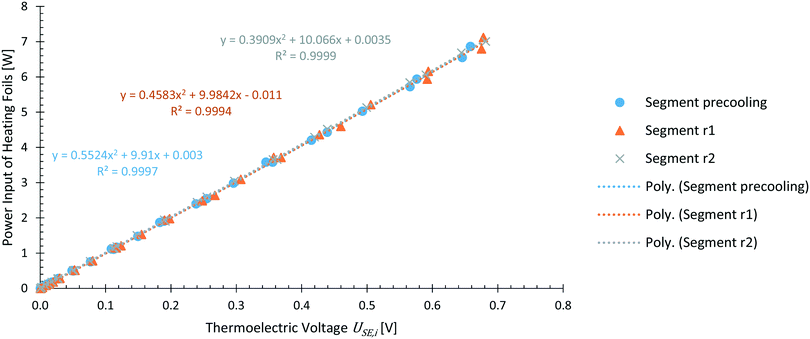
Calibration of the calorimeter was carried out with the integrated heating foils for each element. As described above, each reactor segment was calibrated simultaneously by applying a known power input to the respective heating foil. With this direct calibration method, heat losses to the environment were assumed to be accounted for the obtained calibration.The calibration at 25 °C for each reactor segment is shown in Fig. 6. As reported in literature,18 a correlation of heat flux and thermoelectric voltage USE,i of the respective Seebeck element was found in the form of a polynomial of second order. This polynomial matches to the theoretical Joule heating by electrical power input P expressed with electrical potential U, when assuming an ideal resistor R, and expressing electrical current with Ohm's law as shown in eqn (14).
 | (14) |
Functionality test with warm water
After obtaining a calibration for the calorimeter, a general functionality test was done. This experiment was meant to investigate the effects of unstable and varying inlet temperature on the calorimeter performance and to estimate the influence of temperature changes occurring within later operations. Therefore, warm water with changing temperature and different flow rates was pumped into the calorimeter to see how its regulation accounts for these changes. Additionally, with this experiment the outcome of changing inlet conditions on the calculated heat balance was evaluated.Experimental data of this experiment can be seen in the ESI† in Fig. S5 and S6. Within this experiment, the necessary heat flux to cool down both feeds was calculated and compared to the heat capacity of water 75.34 J mol−1 K−1.31 A heat capacity of 73.36 J mol−1 K−1 with a variation of ±2.62 J mol−1 K−1 was obtained from the measurements. Increasing accuracy of the measurement was seen at higher flow rates above 2 ml min−1 total flow rate. At these high flow rates, temperature measurements of in- and outlets can be expected to better represent the true fluid temperature in and out of the device because of heat losses between the sensors and the device. Excluding flow rates below 2 ml min−1 leads to a value of 75.74 J mol−1 K−1 with a variation of ±1.18 J mol−1 K−1 for the remaining experiments. An accurate function of the device even at changing process conditions could be shown with a deviation of 0.53% of the mean value from the literature value.
Proof of concept AcOH–NaOH neutralization
The neutralization of AcOH with NaOH was chosen to evaluate the calorimeter's applicability for a fast chemical synthesis. The obtained data are depicted in Fig. 7 for different mole fluxes of AcOH at changing total flow rates.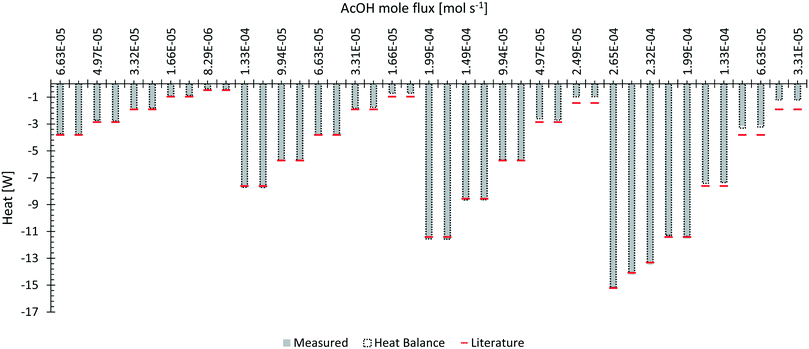 | ||
| Fig. 7 Neutralization of AcOH with NaOH with a comparison to the theoretical heat of neutralization for 1 mol of water.32 The grey area represents the directly measured heat flux with indication of the energy balance shown by an extending frame. | ||
From the obtained experimental data, (see ESI† Fig. S7–S9 for a comparison between experiments and Fig. S10–S17 for time resolved data of the respective measurement) it can be seen that at lower flow rates the reaction finished in the first reactor segment and only remaining heat gets transferred through convection to the second segment. Above flow rates of 6 ml min−1 a certain increase of detectable heat flux can be seen on the second segment. Most probably the reaction was shifted downstream at increasing flow rates. The pulsating nature of the HPLC pumps at higher flow rates is likely to be the main factor influencing this behaviour. Probably higher and lower concentrated plugs travel through the calorimeter and may experience back mixing to a uniform concentration field after a certain amount of mixing elements. Nevertheless, a constant operation for each measurement point was obtained after approximately 3 minutes.
Measured heat fluxes with contribution of the heat balance were compared to the expected neutralization enthalpy of −57.4 kJ mol−1 for the neutralization of AcOH with NaOH.32 Within all evaluations, heat capacity of pure water was used for the calculations. All measurements obtained a reaction heat of −52.95 kJ mol−1 with a variation of ±6.68 kJ mol−1. As in the previous experiment, low total flow rates of 1 and 2 ml min−1 gave dramatically bigger errors compared to higher flow rates. Without these low flow rates, a reaction heat of −57.00 kJ mol−1 with a variation of ±1.08 kJ mol−1 can be obtained from the measurements. The higher error occurring at lower flow rates was assumed to be caused by ineffective temperature measurements of the inlet stream due to heat losses. In this case, the heat balance was most probably not closed correctly.
Mixing heat of methanol and water
Molar excess enthalpy of methanol and water as a function of the mole fraction of water was chosen as an additional evaluation case. A total flow rate of 4 ml min−1 was constantly kept throughout the experiments as lower flow rates showed significantly reduced performances in previous experiments. Experimental data of this measurement can be found in the ESI† in Fig. S18 and S19.In Fig. 8, the obtained measurements at 25 °C were compared to the literature values presented by Piñeiro et al.10 A slight offset to the reported values from literature can be detected but the general shape of the curve was perfectly mimicked by the obtained measurement data. Apart from the qualitative comparison of the two curves, no further evaluations were carried out with the data at current state.
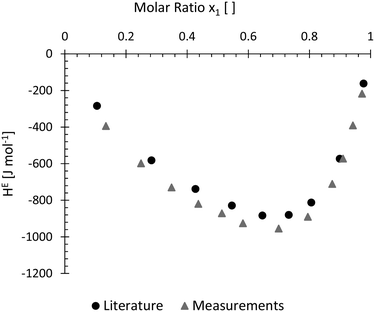 | ||
| Fig. 8 Measured molar excess enthalpy HE at 298.15 K for water (1) + methanol (2). With a slight offset, the obtained data nicely resembles measurements from literature.10 | ||
Additional heat capacity measurements
Heat capacity of water was measured in a different mode of operation by performing a temperature change of 2 °C between the calorimeter segments. This new configuration required a new calibration (see ESI† Fig. S20).From all measurements a heat capacity of 80.45 J mol−1 K−1 with a variation of ±7.51 J mol−1 K−1 was obtained. In contrast to the other measurements, discarding low flow rates did not shift the obtained value closer to the literature value of 75.34 J mol−1 K−1 (ref. 31) but the variance of measurement did improve. Without low flow rates, a heat capacity of 84.01 J mol−1 K−1 with a variation of ±2.70 J mol−1 K−1 was measured.
As seen from the experimental data during measurements (see ESI† Fig. S21 and S22), this temperature jump did not produce a high change in recognizable heat flux due to the low temperature difference. Increasing measurement error can be attributed to the small detectable heat flux where reduced measurement efficiency can be expected. This problem could be solved by applying greater temperature jumps between the segments. But accurate heat capacity measurements are generally shown with an experimental setup as reported before within the functionality test with warm water.
Conclusions
A modular reaction calorimeter is presented for direct and isothermal heat flux measurements intended to be used for highly reactive organic compounds as commonly found in flow chemistry. Its design is based on a combination of commercially available electronics and additive manufacturing. With this combination, elements can be adapted and reassembled easily to fit specific applications. To ensure isothermal operation, calorimeter segments are temperature-regulated independently from each other by means of a microcontroller-based Peltier cooling. Internally-calibrated Seebeck elements measure the transferred heat flux of each calorimeter segment.The designed calorimeter was validated with a series of experiments which produce a well-known heat flux. Through these experiments, the calorimeter design was proven to be applicable to measure reaction heats of fast reactions, important material properties like specific heat capacities, and system-specific properties as molar excess enthalpies.
Improvements of mixing performance for lower flow rates should still be considered for future models of the reactor plate. Adaptations of the existing calorimeter can be easily made due to its modular design. The reactor plate used can be exchanged to meet the requirements of different flow syntheses for higher or lower flow rates to provide additional mixing performance if required. In addition, additional connector ports can be added to the design if mixing of multiple streams is desired.
Future work will focus on extending the reactor plate to increase internal volume of the device as well as the addition of smaller Seebeck elements for a more locally resolved measurement. Further improvements of the setup will be made by coupling a controllable heat exchanger to both inlets for a precise preconditioning of the streams. Additionally, it is planned to investigate hazardous chemical syntheses with the current device as well as with advanced versions of it.
Conflicts of interest
There are no conflicts to declare.Acknowledgements
The authors would like to thank Stefan Scheer (Technical University Graz) for his support. The CC FLOW project (Austrian Research Promotion Agency FFG No. 862766) is funded through the Austrian COMET Program by the Austrian Federal Ministry of Transport, Innovation and Technology (BMVIT), the Austrian Federal Ministry of Science, Research and Economy (BMWFW) and by the State of Styria (Styrian Funding Agency SFG).Notes and references
- M. Movsisyan, E. I. P. Delbeke, J. K. E. T. Berton, C. Battilocchio, S. V. Ley and C. V. Stevens, Chem. Soc. Rev., 2016, 45, 4892–4928 RSC
.
- M. B. Plutschack, B. Pieber, K. Gilmore and P. H. Seeberger, Chem. Rev., 2017, 117, 11796–11893 CrossRef CAS PubMed
.
-
V. Hessel, S. Hardt and H. Löwe, Chemical Micro Process Engineering: Fundamentals, Modelling and Reactions, 2004 Search PubMed
.
- T. Westermann and L. Mleczko, Org. Process Res. Dev., 2016, 20, 487–494 CrossRef CAS
.
- N. Kockmann, Chem. Eng. Technol., 2008, 31, 1188–1195 CrossRef
.
- N. Kockmann, P. Thenée, C. Fleischer-Trebes, G. Laudadio and T. Noël, React. Chem. Eng., 2017, 2, 258–280 RSC
.
- A. Zogg, F. Stoessel, U. Fischer and K. Hungerbühler, Thermochim. Acta, 2004, 419, 1–17 CrossRef CAS
.
-
M. Toledo, Reaction Calorimeter RC1, https://www.mt.com/int/en/home/products/L1_AutochemProducts/Reaction-Calorimeters-RC1-HFCal/RC1mx-Reaction-Calorimeter.html, (accessed 13 November 2019)
.
- A. Zogg, U. Fischer and K. Hungerbühler, Ind. Eng. Chem. Res., 2003, 42, 767–776 CrossRef CAS
.
- Á. Piñeiro, Á. Olvera, G. García-Miaja and M. Costas, J. Chem. Eng. Data, 2001, 46, 1274–1279 CrossRef
.
-
Thermal hazard technology, Micro Reaction Calorimeter - μRC, http://www.thermalhazardtechnology.com/products/micro+reaction+calorimeter, (accessed 3 November 2019) Search PubMed
.
- G. Glotz, D. J. Knoechel, P. Podmore, H. Gruber-Woelfler and C. O. Kappe, Org. Process Res. Dev., 2017, 21, 763–770 CrossRef CAS
.
- C. Hany, C. Pradere, J. Toutain and J.-C. Batsale, Quant. Infrared Thermogr. J., 2008, 5, 211–229 CrossRef
.
- J. M. Köhler and M. Zieren, Thermochim. Acta, 1998, 310, 25–35 CrossRef
.
- Y. Zhang and S. Tadigadapa, Biosens. Bioelectron., 2004, 19, 1733–1743 CrossRef CAS PubMed
.
- M. A. Schneider and F. Stoessel, Chem. Eng. J., 2005, 115, 73–83 CrossRef CAS
.
- S. Loebbecke, J. Antes, W. Ferstl, D. Boskovic, T. Tuercke, M. Schwarzer and H. Krause, Inst. Chem. Eng. Symp. Ser., 2007, 153, 1–6 Search PubMed
.
- F. Reichmann, S. Millhoff, Y. Jirmann and N. Kockmann, Chem. Eng. Technol., 2017, 40, 2144–2154 CrossRef CAS
.
-
A. Ladosz, A. R. Teixeira, B. Hardy, I. Roes, J. Moore and K. F. Jensen, Poster pres. at, Int. Conf. Micro React. Technol, IMRET, Karlsruhe, 2018 Search PubMed
.
- B. Gutmann, M. Köckinger, G. Glotz, T. Ciaglia, E. Slama, M. Zadravec, S. Pfanner, M. C. Maier, H. Gruber-Wölfler and C. O. Kappe, React. Chem. Eng., 2017, 2, 919–927 RSC
.
- M. C. Maier, R. Lebl, P. Sulzer, J. Lechner, T. Mayr, M. Zadravec, E. Slama, S. Pfanner, C. Schmölzer, P. Pöchlauer, C. O. Kappe and H. Gruber-Woelfler, React. Chem. Eng., 2019, 4, 393–401 RSC
.
- J. R. Bourne, O. M. Kut, J. Lenzner and H. Maire, Ind. Eng. Chem. Res., 1990, 29, 1761–1765 CrossRef CAS
.
- M.-C. Fournier, L. Falk and J. Villermaux, Chem. Eng. Sci., 1996, 51, 5053–5064 CrossRef CAS
.
- L. Falk and J.-M. Commenge, Chem. Eng. Sci., 2010, 65, 405–411 CrossRef CAS
.
- J. R. Bourne, Chem. Eng. J., 2008, 140, 638–641 CrossRef CAS
.
- J.-M. Commenge and L. Falk, Chem. Eng. Process., 2011, 50, 979–990 CrossRef CAS
.
- J. Bałdyga, J. R. Bourne and S. J. Hearn, Chem. Eng. Sci., 1997, 52, 457–466 CrossRef
.
- R. W. Hanks, A. C. Gupta and J. J. Christensen, Ind. Eng. Chem. Fundam., 1971, 10, 504–509 CrossRef CAS
.
- R. W. Hanks, R. L. Tan and J. J. Christensen, Thermochim. Acta, 1978, 23, 41–55 CrossRef CAS
.
- S. Schwolow, J. Hollmann, B. Schenkel and T. Röder, Org. Process Res. Dev., 2012, 16, 1513–1522 CrossRef CAS
.
-
R. H. Perry, D. W. Green and J. O. Maloney, Perry's Chemical Engineer's Handbook, 8th edn, 2007 Search PubMed
.
-
E. Riedel and H.-J. Meyer, Allgemeine und Anorganische Chemie, De Gruyter, Berlin, Boston, 2018 Search PubMed
.
Footnote |
| † Electronic supplementary information (ESI) available. See DOI: 10.1039/d0re00122h |
| This journal is © The Royal Society of Chemistry 2020 |

