
 Open Access Article
 This Open Access Article is licensed under a Creative Commons Attribution-Non Commercial 3.0 Unported Licence
Photoelectrochemical enzymatic sensor for glucose based on Au@C/TiO2 nanorod arrays†
Lianyuan Gea,
Rui Hou a,
Yang Caoac,
Jinchun Tu*a and
Qiang Wu*b
a,
Yang Caoac,
Jinchun Tu*a and
Qiang Wu*b
aKey Laboratory of Advanced Materials of Tropical Island Resources, State Key Laboratory of Marine Resource Utilization in South China Sea, Hainan University, Haikou 570228, P. R. China. E-mail: tujinchun@hainu.edu.cn
bSchool of Tropical Medicine and Laboratory Medicine, Key Laboratory of Emergency and Trauma of Ministry of Education, Hainan Medical University, Haikou 571199, China. E-mail: wuqiang001001@aliyun.com
cKey Laboratory of Child Cognition & Behavior Development of Hainan Province, Qiongtai Normal University, Haikou 571127, P. R. China
First published on 15th December 2020
Abstract
In this work, a photoelectrochemical (PEC) glucose biosensor was synthesized on the basis of a type of Au@C/TiO2 composite by using an unsophisticated secondary hydrothermal strategy. The compounded Au@C/TiO2 material was characterized by XRD, SEM, TEM, UV-vis, and XPS to identify the composition and the purity of the phase. Glucose oxidase (GODx) was immobilized on the Au@C/TiO2. The PEC biosensor presented satisfactory stability and outstanding reproducibility. The range and the sensitivity of the linear measurement were 0.1–1.6 mM and 29.76 μA mM−1 cm−2, respectively, and the detection limit was low (0.049 mM). The GODx/Au@C/TiO2/FTO biosensor presented excellent efficiency in detecting glucose, suggesting the great potential application of this synthesized material in PEC biosensors.
1. Introduction
Photoelectrochemical (PEC) biosensors have drawn great attention recently because of many advantages, such as low background, low cost, and high sensitivity.1 PEC biosensors are dependent on photoactive semiconductor nanomaterials and exhibit excellent performance. Particularly, its photoactivity has an essential part in the determination of the function of biosensors in analysis.2,3TiO2, a semiconductor with a wide n-type band gap, is considered as a promising material in the detection of biomolecules in the heterogeneous photocatalysis due to its high chemical stability, low cost, nontoxicity, and excellent oxidizing power.4–7 Compared with other semiconductor materials, TiO2 is suitable to be applied in photocatalytic activities because of its high photoactivity and porosity.8,9 Nonetheless, as a kind of photocatalyst, TiO2 is not used extensively due to large band gap energy (Eg = 3.2 eV), and fast recombination rate of photoelectron–hole pairs, which limits the utilization of TiO2 in the visible light range.10,11 Several methods, such as dye bonding on the surface of TiO2, metal nanoparticles and nonmetal deposition, connecting narrow-band gap semiconductors, can be used to enhance the activity of the visible light for TiO2 and solve the aforementioned problems.12–14
Glucose (Glu) is considered as the main source for generating energy in cellular modulation and metabolism and shows an important position in the cellular growth. The lack or the excess of Glu may cause adverse effects on the function of cells. The sensitive and rapid assessment of the level of Glu, as one of the indicators for diabetes, in the urine and the blood is important.15–18
Generally, carbon (C) owns inherent benefits, including high stability, low cost, and improved electrical conductivity, and better biocompatibility. Moreover, C materials can improve the adsorption of enzymes and increase the detection range and the sensitivity of the enzyme sensors. Given that metal NPs(nanoparticles) can concentrate light near the semiconductor/liquid junction to generate photocarriers that can reach the interface, the proper integration of the surface plasmon resonance (SPR) enhanced photoelectrochemistry and well-designed biological reactions is possible and provides great opportunities for new biomolecule detection.19 Moreover, the nanoparticles made of noble metal can produce intermediates that can capture or transfer photo-generated electrons.20
Therefore, TiO2 nanorods, a novel enzyme Glu sensor, is constructed by integrating the advantages of C and Au. The synthesis of Au@C/TiO2 nanorod arrays (NRAs) is shown in Scheme 1. The TiO2 NRAs are obtained using a common hydrothermal approach. Au nanoparticles and the C shell are deposited onto the surface of TiO2 NRAs by using the secondary hydrothermal approach. The PEC biosensor of Glu is developed using Glu oxidase (GODx) over the surface of Au@C/TiO2 NRAs, which is coated with the electrode of F-doped SnO2 (FTO). The acquired PEC biosensor presents satisfactory reproducibility and outstanding stability. Additionally, the detection limit is low (0.049 mM). The range of linear measurement and the sensitivity of the PEC biosensor are 0.1–1.6 mM and 29.76 μA mM−1 cm−2, respectively.
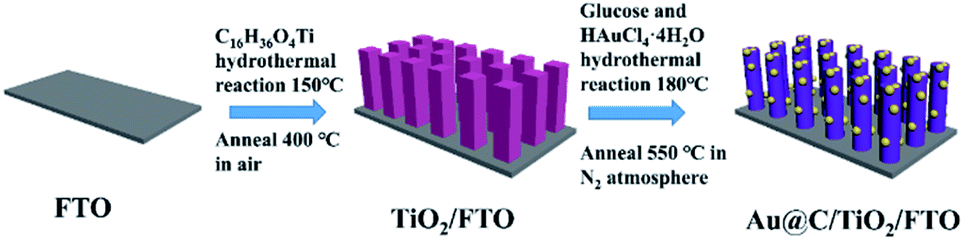 | ||
| Scheme 1 Au@/C/TiO2/FTO fabrication. | ||
2. Experimental
2.1. Reagents and materials
Outhwaite New Energy Company provided FTO glasses. Tetrabutyl titanate (C16H36O4Ti) was available from Tianjin Fuchen Chemical Reagent Factory. Ethanol (CH3CH2OH), isopropyl alcohol (CH3CH3CHOH), and hydrochloric acid (HCl) were the products of the Xilong Science Corporation. Glucose anhydrous (C6H12O6) was provided by Guangzhou Chemical Reagent Factory. Glucose oxidase (GODx) was gained from Shanghai Bioengineering Co. Ltd. HAuCl4·4H2O was from Sinopharm Chemical Reagent Co., Ltd. Materials were not further purification. Liquid solutions prepared by ultrapure water.2.2. Synthesis of TiO2 NRAs
TiO2 NRAs were grew on the FTO glass substrate by using a previously reported hydrothermal method.21 First, FTO glass substrates were ultrasonically cleaned by sonicating in isopropyl alcohol, acetone and ultrapure water. Second, 20 ml HCl was added into 20 ml ultrapure water, and the solution was stirred for 10 min, added with 0.4 ml tetrabutyl titanate, stirred vigorously for about 30 min and added with Teflon (30 ml). The mixture was placed onto a clean FTO glass substrate at an angle lying against the Teflon wall. The Teflon was sealed and heated for 4 h at 150 °C in an oven, and the autoclave was cooled to room temperature naturally. Finally, the sample was dried, washed with ultrapure water, and annealed for 2 h at 400 °C in air.2.3. Synthesis of C/TiO2 NRAs
C/TiO2 NRAs were constructed using a simple hydrothermal approach. Anhydrous Glu (0.36 g) was added with 20 ml ultrapure water, and the Glu solution was stirred for 10 min, added with Teflon, and placed onto the FTO glass substrate with TiO2 NRAs at an angle lying against the Teflon wall. The Teflon was sealed and heated for 4 h at 180 °C in an oven, and the autoclave was cooled to room temperature naturally. Finally, the sample was dried, washed using ultrapure water, and annealed for 2 h at 550 °C in an N2 atmosphere.2.4. Synthesis of Au/TiO2 NRAs
Au/TiO2 NRAs were synthesized using a simple hydrothermal approach. HAuCl4·4H2O (0.02 ml, 1%) was added with 20 ml ultrapure water, and the mixture was stirred for 10 min, added with the Teflon, and placed onto the FTO glass substrate with TiO2 NRAs at an angle lying against the Teflon wall. The Teflon was sealed and heated for 4 h at 180 °C in an oven, and the autoclave was cooled to room temperature naturally. Finally, the sample was dried, washed using ultrapure water, and annealed for 2 h at 550 °C in an N2 atmosphere.2.5. Synthesis of Au@C/TiO2 NRAs
Au@C/TiO2 NRAs were synthesized using a hydrothermal approach. Anhydrous Glu (0.36 g) was added with 20 ml ultrapure water, and the solution was stirred for 10 min, added with 1% HAuCl4·4H2O (0.02 ml), stirred for 10 min, added with the Teflon, placed onto the FTO glass substrate with TiO2 NRAs at an angle lying against the Teflon wall. The Teflon was sealed and heated for 4 h at 180 °C in an oven, and the autoclave was cooled to room temperature naturally. Finally, the sample was dried, washed using ultrapure water, and annealed for 2 h at 550 °C in an N2 atmosphere.2.6. Constructing of the PEC electrode
The Au@C/TiO2 NRAs FTO electrode and the GODx solution (10 mg ml−1) were prepared to establish the biosensor of GODx/Au@C/TiO2 NRAs. The GODx solution 20 μL was used on the Au@C/TiO2 NRAs FTO electrode, which was dried at 4 °C for 48 h.2.7. Detection and instruments
The morphology characteristics of the surface of the PEC electrode were assessed with the field emission scanning electron microscope (FESEM, Hitachi S-3000 4800). The images of TEM were obtained by using the transmission electron microscopy (Tecnai G2 20). The crystal structures were measured by using the analysis of X-ray diffraction (XRD) instrument of D8 Tools XRD. The voltage was set as 40 kV, and the current as 30 mA with Cu-Kα radiation (k = 1.5406 Å). The UV-vis absorption spectrophotometer (JASCO, UV-550) was used to obtain the UV-vis absorption spectrum, and the wavelength was set as 300–800 nm. We used the multifunctional imaging electron spectrometer (Thermo ESCALAB 250XI) to perform X-ray photoelectron spectroscopy (XPS). The CHI 660C workstation (CHI Instruments, Chenhua, Shanghai, China) combined with a 500 W Xenon lamp was applied to perform the PEC tests. Traditional electrochemical system with three electrodes was utilized in the PBS buffer (pH = 7.4) solution in room temperature, and the GODx/Au@C/TiO2 electrode was used as the working electrode. Meanwhile, Pt foil functioned as the counter electrode and Ag/AgCl as the reference electrode.3. Results and discussion
Fig. 1 shows the XRD patterns of the samples. The peaks of FTO substrates were indexed in accordance with the database of JCPDS (46-1688), whereas the peaks of samples were indexed in accordance with the database of JCPDS (21-1276). The samples were discovered to own rutile TiO2 tetragonal structures. The peaks at 27.45°, 36.08°, 54.32°, 62.74°, 69.01°, and 69.79° were associated with the planes of (110), (101), (211), (002), (301), and (112), respectively. The Au/TiO2 and the Au@C/TiO2 samples were indexed in accordance with the database of JCPDS (04-0784), and Au nanoparticles were found. The C/TiO2 and the Au@C/TiO2 samples had a slightly increased peak between 20° and 25° (Fig. S1†) and showed that the C shell had successfully grown on the TiO2.22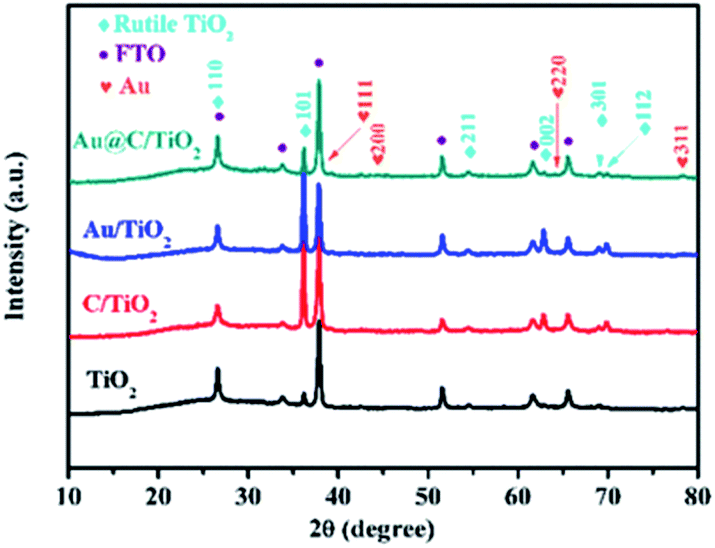 | ||
| Fig. 1 XRD patterns of TiO2, C/TiO2, Au/TiO2, and Au@C/TiO2. | ||
Fig. 2 shows the SEM images of TiO2, C/TiO2, Au/TiO2 and Au@C/TiO2. As shown in Fig. 2A–C, rutile TiO2 NRAs were successfully attached to the FTO substrates. The diameter and the length of TiO2 NRAs were approximately 60–120 nm and about 1–2 μm, respectively. As shown in Fig. 2D–F, with the addition of C, no evident change was observed in C/TiO2 compared with TiO2. Only parts of the TiO2 NRAs were covered with a thin layer of C. As shown in Fig. 2G–I, some Au nanoparticles with size of 5–40 nm were attached onto TiO2 NRAs. As shown in Fig. 2–L, with the addition of C and Au nanoparticles at the same time, Au@C composites covered TiO2 NRAs. The thickness of the Au@C composites was approximately 200–300 nm and Au nanoparticles had a size of about 5–40 nm. The Au@C composites structure may facilitate the transport of photogenerated electrons, thereby inhibiting the recombination of photogenerated electrons and holes.
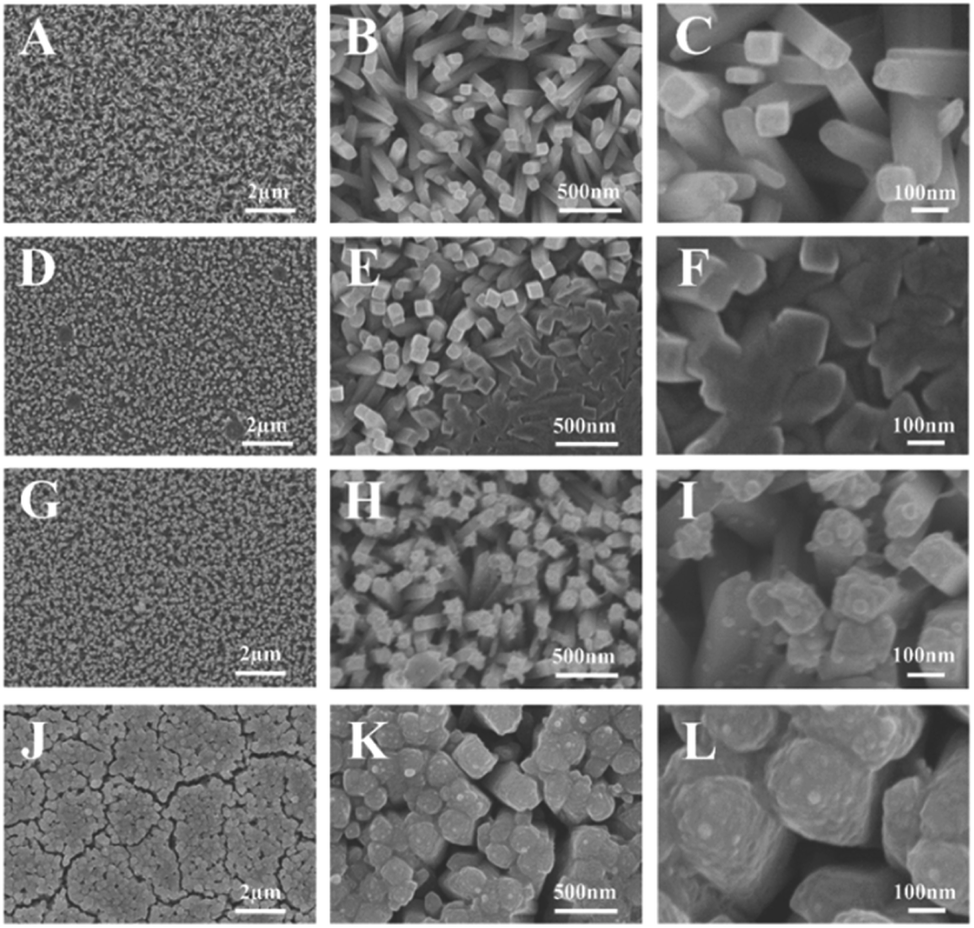 | ||
| Fig. 2 SEM images of (A–C) TiO2, (D–F) C/TiO2, (G–I) Au/TiO2, (J–L) Au@C/TiO2. | ||
The HRTEM and the TEM images of Au@C/TiO2 and TiO2 are shown in Fig. 3A–F, respectively. The Au@C/TiO2 and the TiO2 samples demonstrated similar morphological features in TiO2 nanorods. The diameter of TiO2 nanorods was approximately 120 nm. Given that the C and the Au gradually attached to the TiO2 nanorods, these nanorods were covered with the Au@C composites. Au nanoparticles had a size of about 5–40 nm. The lattice margins of Au@C/TiO2 and TiO2 (Fig. 1B and E) were 0.324 nm, which corresponded to the (110) crystal plane of the rutile TiO2. The lattice fringe of Au@C/TiO2 (Fig. 1F) was 0.235 nm, which corresponded to the (111) crystal plane of Au nanoparticles. The composition of Au@C/TiO2 was revealed using elemental mapping and HAADF-STEM imaging (Fig. 1G). Ti, O, C, and Au elements were uniformly distributed in Au@C/TiO2. Moreover, the C encased the Au particles, which were scattered on the surface of the TiO2 nanorods. The co-existence of Au and C would facilitate the transmission of electrons. At the same time, the Au@C composites structure would facilitate the adsorption of GODx.
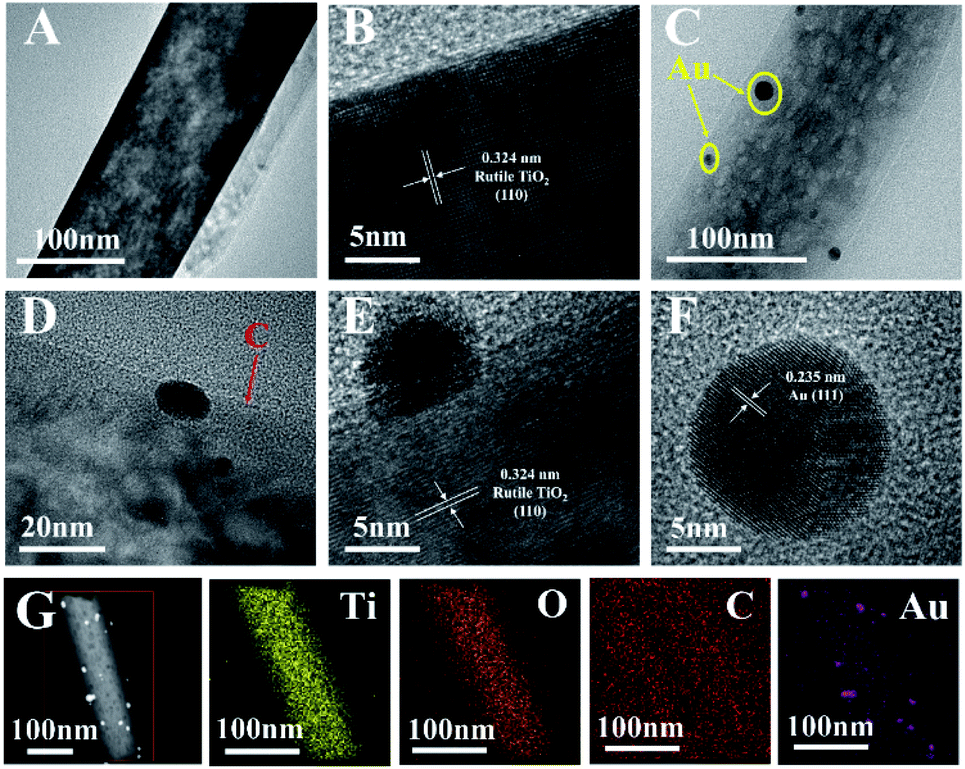 | ||
| Fig. 3 (A) TEM, (B) HRTEM of TiO2. (C and D) TEM, (E and F) HRTEM, (G) HAADF-STEM and element mappings of Ti, O, C, Au of Au@C/TiO2. | ||
The UV-vis spectra of Au@C/TiO2, Au/TiO2, C/TiO2 and TiO2are shown in Fig. 4A. Their bandgap values were obtained using the Kubelka–Munk function (Fig. 4B).23 The absorption band and the bandgap value of the TiO2 was at about 405 nm (Fig. 4A) and 3.06 eV (Fig. 4B), respectively. TiO2 was a typical rutile. C/TiO2 showed an escalated absorption peak (416 nm, Fig. 4A) and lower bandgap value (2.98 eV, Fig. 4B) in comparison with TiO2, suggesting that the C was successfully deposited onto the TiO2 surface, and a small amount of C was doped into the TiO2. The absorption band and the bandgap value of Au/TiO2 were about 406 nm (Fig. 4A) and 3.06 eV (Fig. 4B), respectively. The Au/TiO2 was observed with an evident absorption band from 500 nm to 600 nm (Fig. 4A), which was attributed to the SPR absorption of the Au nanoparticles. This result implied the deposition of Au nanoparticles on the TiO2 surface. The Au@C/TiO2 had higher absorption peak (416 nm, Fig. 4A) and lower bandgap value (2.98 eV, Fig. 4B) compared with the TiO2. These results implied that the C and the Au were deposited onto the TiO2 surface and that the Au@C was formed on the TiO2 surface. A small amount of C may be doped into TiO2. A new peak at 500–600 nm was observed in Au@C/TiO2 (Fig. 4A) and attributed to the SPR absorption of Au nanoparticles.
 | ||
| Fig. 4 (A) UV-vis absorption spectra, (B) plots of (F(R)hν)1/2 vs. E (eV) for TiO2, C/TiO2, Au/TiO2 and Au@C/TiO2. | ||
As shown in Fig. 5A, the XPS survey spectra suggested that the Au@C/TiO2 consisted of Au, C, Ti and O. Fig. 5B displays the O 1s spectra. Three intense peaks at 531.6, 530.3, and 529.1 eV, corresponding to the C![[double bond, length as m-dash]](https://www.rsc.org/images/entities/char_e001.gif) O bonds, C–O, and Ti–O bonds (lattice O), respectively, were observed in the samples.24 The C 1s spectra are shown in Fig. 5C. The peaks at 287.8 and 284.6 eV might result from the bonds of C–O and C–C.24 Fig. 5D shows the Ti 2p spectra of the core level with a high resolution. The XPS peaks of Ti 2p1/2 and 2p3/2, which had excellent symmetry with the TiO2 sample, appeared at about 463.6 and 457.9 eV, suggesting that the chemical valence of Ti4+ appeared to have an octahedral coordination with O.25 The binding energy difference (ΔE) between Ti 2p3/2 and Ti 2p1/2 was about 5.7 eV, indicating that the chemical state of Ti was Ti4+.24 In Fig. 5E, the XPS spectra of Au@C/TiO2 presented the peaks of Au 4f5/2 and Au 4f7/2 centered at 86.5 and 82.8 eV, respectively. The spin energy separation of 3.7 eV was highly consistent with the published results about Au 4f5/2 and Au 4f7/2 in Au nanoparticles.26
O bonds, C–O, and Ti–O bonds (lattice O), respectively, were observed in the samples.24 The C 1s spectra are shown in Fig. 5C. The peaks at 287.8 and 284.6 eV might result from the bonds of C–O and C–C.24 Fig. 5D shows the Ti 2p spectra of the core level with a high resolution. The XPS peaks of Ti 2p1/2 and 2p3/2, which had excellent symmetry with the TiO2 sample, appeared at about 463.6 and 457.9 eV, suggesting that the chemical valence of Ti4+ appeared to have an octahedral coordination with O.25 The binding energy difference (ΔE) between Ti 2p3/2 and Ti 2p1/2 was about 5.7 eV, indicating that the chemical state of Ti was Ti4+.24 In Fig. 5E, the XPS spectra of Au@C/TiO2 presented the peaks of Au 4f5/2 and Au 4f7/2 centered at 86.5 and 82.8 eV, respectively. The spin energy separation of 3.7 eV was highly consistent with the published results about Au 4f5/2 and Au 4f7/2 in Au nanoparticles.26
 | ||
| Fig. 5 XPS patterns of (A) survey spectra, (B) O 1s, (C) C 1s, (D) Ti 2p, (E) Au 4f. | ||
In Fig. 6, the electrochemical and the PEC experiments were performed to detect the PEC performance of TiO2, Au/TiO2, Au@C/TiO2, and C/TiO2 samples under illumination. In Fig. 6A, linear sweep voltammograms (LSV) highlighted the conclusions as follows. (1) C/TiO2, Au/TiO2, and Au@C/TiO2 samples showed enhanced photocurrent densities than TiO2, indicating that the inter-bands in C–Au, C, and Au-depositions and the SPR from Au nanoparticles created a light response for the TiO2-based photoelectrode. (2) The Au@C/TiO2 demonstrated the highest photocurrent density among all samples and had significantly higher photocurrent density than the C/TiO2 from the Au/TiO2 samples.
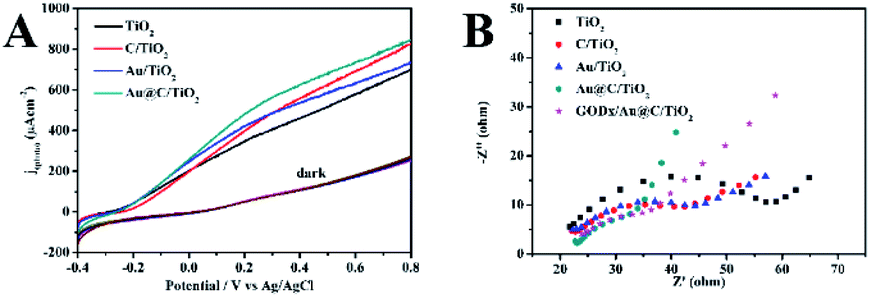 | ||
| Fig. 6 Photoelectrochemical performance of TiO2, C/TiO2, Au/TiO2, Au@C/TiO2 in (A) linear-sweep voltammograms, collected at a scan rate of 0.1 V s−1 under illumination, (B) electrochemical impedance spectra of Nyquist plots. | ||
The inherent electronic features were detected using electrochemical impedance spectra (EIS) and open-circuit photo-voltage decay (OCPVD) experiments to further understand the performance of PEC. OCPVD experiments were performed, and the electron lifetime generated by photo was estimated in accordance with the following formula:27
In the equation, τ represents the photoelectron lifetime dependent on the potential, T represents temperature, kB represents the Boltzmann's constant, VOC stands for the open-circuit voltage at time t, and e represents the charge in a single electron. As shown in Fig. S2,† the Au@C/TiO2 sample presented the longest lifetime of the electron, which contributed to the high performance of PEC. The EIS was considered as one of the powerful tools in the study of the interfacial features of photoelectrodes. Fig. 6B presents the Nyquist plots. The Au@C/TiO2 demonstrated the smallest diameter of the semicircle, indicating the lowest resistance in charge transfer and the fastest mobility of the electron. The measurement of capacitance of the electrolyte/electrode was performed to detect the carrier density (ND) in accordance with the following formula:28

In this equation, C stands for the capacitance of the space charge in the semiconductor, ND represents the density of the electron carrier, e is the elemental charge, ε0 represents the vacuum permittivity, ε is defined as the relative permittivity of the semiconductor, US is the applied potential, T represents temperature, and kB stands for the Boltzmann constant. The ND was measured as 1/C2 vs. potential (Fig. S3†) by using the Mott–Schottky (MS) plots through the equation as follows:28
The calculated donor densities followed the order: TiO2 < Au/TiO2 < C/TiO2 < Au@C/TiO2. The significantly increased ND confirmed that the C–Au-deposition could improve the electric conductivity, and accelerate the electron transfer.
Photocurrent responses used C/TiO2, TiO2, Au@C/TiO2, Au/TiO2and GODx/Au@C/TiO2 as the photoanodes under irradiation. The photocurrent–time curves of these samples are demonstrated in Fig. 7A. The photocurrents in the five samples were remarkably raised to the net saturated values and decreased to 0, which was consistent with the irradiation by light turned off and on. The results of PEC demonstrated that the j(photo) values followed the order: Au@C/TiO2 > C/TiO2 > Au/TiO2 > GODx/Au@C/TiO2 > TiO2. The Au@C/TiO2 showed the largest photocurrent (362 μA cm−2), which was followed by C/TiO2 (309 μA cm−2), Au/TiO2 (305 μA cm−2), GODx/Au@C/TiO2 (274 μA cm−2), and TiO2 (268 μA cm−2). The photocurrent of C/TiO2 was 1.15 times that of TiO2. This may be due to the fact that the TiO2 was coated with the carbon layer, and the carbon shell was beneficial to absorb light. At the same time, the carbon itself had good conductivity, which was beneficial to the transmission of electrons. And it reduced the coincidence of photo-generated electrons and holes to improve its photoelectric performance. The photocurrent of Au/TiO2 was 1.14 times that of TiO2. Due to the SPR effect of gold nanoparticles, its light absorption in the visible light region was enhanced. The conductivity of gold nanoparticles themselves was also excellent, and their electron transfer ability was enhanced, resulting in photocurrent improve. Approximately 1.35-fold increment in the produced photocurrent was acquired from TiO2 to Au@C/TiO2 due to two main reasons. First, the SPR from Au nanoparticles and the electrons transfer to the C shell and the TiO2. Second, the C–Au-deposition process accelerated the electron transfer and enhanced the separation efficiency for photogenerated electron–hole pairs.
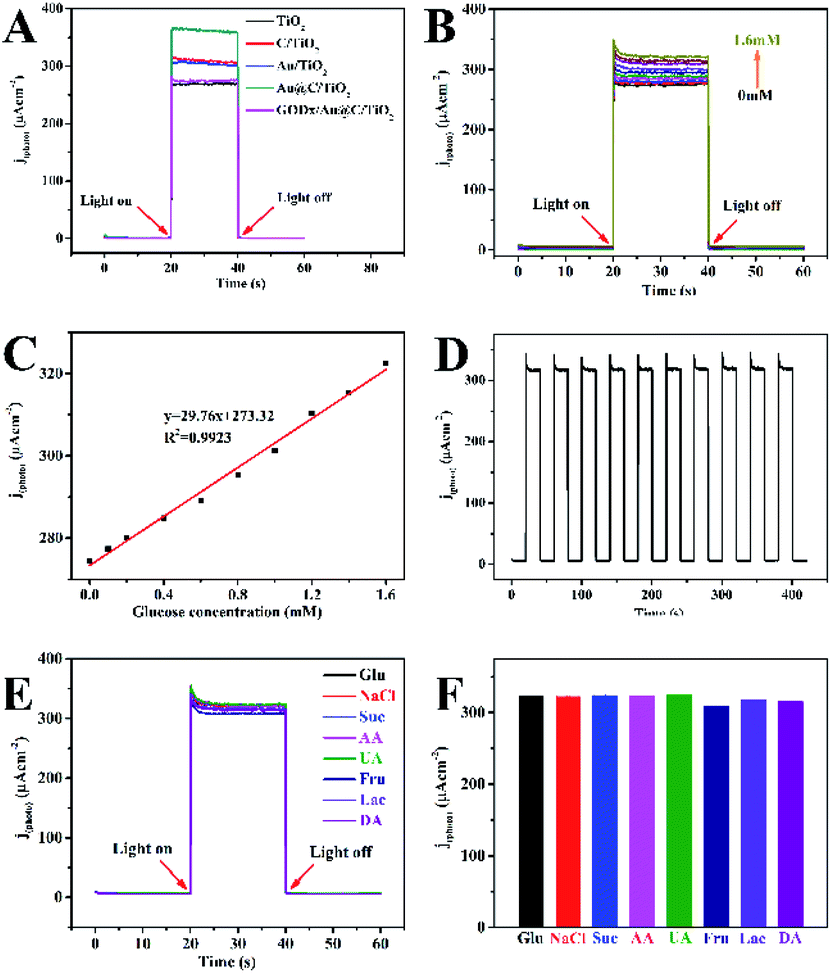 | ||
| Fig. 7 (A) The j(photo)–t responses of TiO2, C/TiO2, Au/TiO2, Au@C/TiO2 and GODx/Au@C/TiO2 in 0.1 M pH 7.4 PBS at 0.4 V vs. Ag/AgCl, (B) the j(photo)–t responses of GODx/Au@C/TiO2 toward Glu at increasing concentration from 0 mM to 1.6 mM in the supporting electrolyte of 0.1 M pH 7.4, (C) linear calibration ([Glu] vs. j(photo)) curve. (D) Stability of GODx/Au@C/TiO2 electrode with 1.6 mM glucose, (E and F) Effect of interferences on the response photocurrents. Experiments were performed in 0.1 M pH 7.4 PBS containing 1.6 mM of Glu with NaCl, Suc, AA, UA, Fru, Lac and DA with light ON. | ||
As shown in Fig. 7B, the photocurrent increased as the Glu concentration increased on the GODx/Au@C/TiO2 electrode, which demonstrated a sensitive reaction to the concentration of Glu. As shown in Fig. 7C, the linear regression equation between Glu concentrations and the photocurrent was j (μA cm−2) = 29.76X + 273.32 (mM). Thus, the sensitivity was measured as 29.76 μA mM−1 cm−2 at Glu concentration of 0.1 mM to 1.6 mM. The detection limit (3S/N) was 0.049 mM. Where S was the slope of the calibration curve and N was the standard deviation of blank samples signals. Moreover, the GODx/Au@C/TiO2 biosensor stability was featured through the responses of j(photo)–t, whereas the light was turned OFF/ON iteratively 10 times in PBS (0.1 M, pH 7.4; Fig. 7D). If light was turned on, the j(photo) response increased rapidly and stayed stable in seconds. The GODx/Au@C/TiO2 biosensor remained stable and fluctuated negligibly with time even after 10 cycles.
The effects of highly probable coexisting and usual molecular interfering species (such as NaCl, sucrose (Suc), ascorbic acid (AA), uric acid (UA), fructose (Fru), lactose (Lac) and dopamine (DA)), which may influence the response of the GODx/Au@C/TiO2 biosensor, was investigated. PEC experiments were performed under the same conditions as the detection of PEC Glu to discover the selectivity of the biosensor of GODx/Au@C/TiO2. In addition, the interfering species (0.1 mM) was added into the solution (Fig. 7E). The variance of j(photo) after the addition of interfering species was calculated using the plots of j(photo)–t. In Fig. 7E and F, no significant response was found in the detection of PEC Glu following the addition of the molecular interfering species. This response may result from the facilitation by the surface GODx fixed on the Au@C/TiO2. Results proved that the constructed PEC biosensor in accordance with the GODx/Au@C/TiO2 showed outstanding and specific selectivity to the Glu biosensor.
The analytical performance of the GODx/Au@C/TiO2/FTO biosensors was compared with those of other Glu sensors (Table 1) and showed good results in terms of sensitivity and linear range.
| Biosensor composition | Linear range/(mM) | Sensitivity/(μA mM−1 cm−2) | Reference |
|---|---|---|---|
| GODx/SnS2/Nafion/GCE | 0.025–1.10 | 7.6 | 29 |
| GCE/GODx/Nafion/Br[Demim]/TNT-AuNP | 0.01–1.2 | 5.1 | 30 |
| Nafion/GODx/Ag-Pdop@CNT/GCE | 0.05–1.10 | 3.1 | 31 |
| GODx/TCS-TiO2/chitosan/GCE | 0.005–1.32 | 23.2 | 32 |
| GODx/CNx-MWCNT/GCE | 0.02–1.02 | 13 | 33 |
| GODx/Au@C/TiO2/FTO | 0.1–1.6 | 29.76 | This work |
The plausible mechanisms for the PEC Glu detection on the GODx/Au@C/TiO2/FTO biosensor under light ON were determined.
As shown in Scheme 2, the C and the Au deposited on the surface of TiO2 was essential in the migration process of generated electrons and holes of the PEC and could minimize their recombination. Under light illumination, the SPR effect of Au nanoparticles and electrons were transferred to the C shell. The electrons in the TiO2 valence band were excited to the conduction band. Electrons were transferred to the conduction band of TiO2 from the C shell. Finally, electrons were transferred to the FTO substrate. The process accelerated the electron transfer rate and inhibited the recombination rate of the hole–electron pairs. The process prolonged the electron lifetime and increased the concentration of carriers. The group of the flavin adenine dinucleotide (FAD) redox in the GODx could oxidize Glu analytes into gluconic acids, which turned into the reduced flavine adenine dinucleotide (FADH2) with enhanced shifting and close attachment to the PEC. The GODx on the Au@C/TiO2 surface could reduce O2 into H2O2. At the same time, the photogenerated holes from the valence band of TiO2 could move. Electrons could migrate onto the Au@C/TiO2 surface, which was consumed by H2O2 to form a flow of charge.
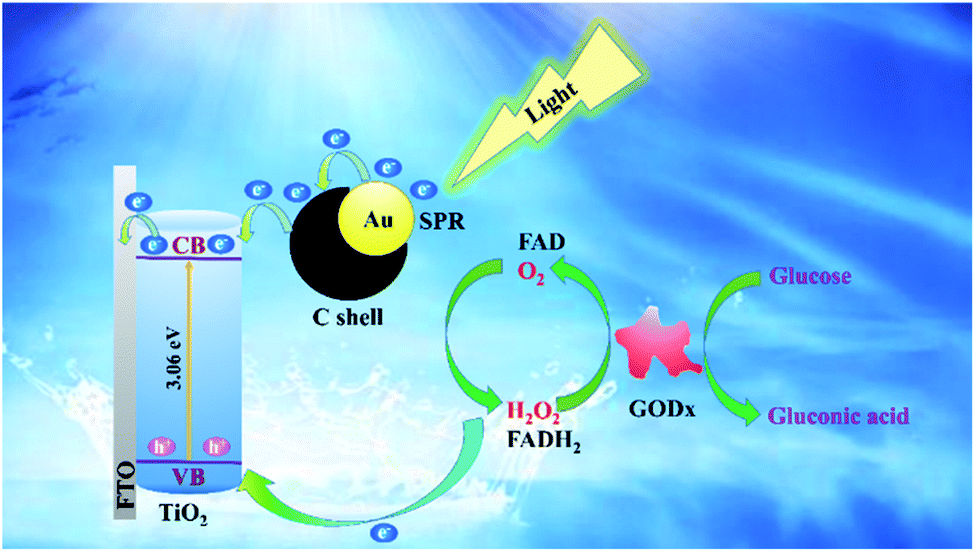 | ||
| Scheme 2 Mechanism of the PEC detection of glucose at the GODx/Au@/C/TiO2/FTO biosensor. | ||
4. Conclusions
In summary, our research has successfully developed a PEC biosensor for Glu on the basis of a type of Au@C/TiO2 composite, which had been synthesized using a common secondary hydrothermal approach. The SPR of Au nanoparticles and the introduction of the C shell accelerated the electron transport rate. The C–Au-deposition on the surface of the TiO2 decreased the recombination rate of hole–electron pairs. Their synergistic influence enhanced the performance of PEC, prolonged the lifetime of photogenerated electrons, and increased the concentration of carriers. As a result, the obtained GODx/Au@C/TiO2/FTO PEC biosensor presented outstanding stability and satisfactory reproducibility. The range of linear measurement and the sensitivity were 0.1–1.6 mM and 29.76 μA mM−1 cm−2, respectively, and the limit of detection was low (0.049 mM). The GODx/Au@C/TiO2/FTO biosensor exhibited excellent performance in detecting Glu, which suggested a possible application potential in the prepared composite of the PEC biosensors. The C–Au-deposition on the surface of TiO2 also laid the foundation for the application of other PEC biosensors.Conflicts of interest
There are no conflicts to declare.Acknowledgements
The authors thank associate professor Chao Zhen (Institute of Metal Research, Chinese Academy of Sciences) for providing constructive and valuable suggestions on this work. The authors thank Chinese Academy of Medical Sciences for the support. This research was financially supported by the Finance Science and Technology Project of Hainan Province (No. ZDYF2019161, 2018106 and 2019RC221), National Natural Science Foundation of China (No. 51762012, 81860373 and 51862006), Key Laboratory Open Project Fund of Hainan University (2019007), and Key laboratory and trauma (Hainan Medical University), Ministry of Education (Grant. KLET-201910).Notes and references
- W.-W. Zhao, J.-J. Xu and H.-Y. Chen, Chem. Rev., 2014, 114, 7421–7441 Search PubMed.
- W.-w. Zhan, Q. Kuang, J.-z. Zhou, X.-j. Kong, Z.-x. Xie and L.-s. Zheng, J. Am. Chem. Soc., 2013, 135, 1926–1933 Search PubMed.
- T. Hisatomi, J. Kubota and K. Domen, Chem. Soc. Rev., 2014, 43, 7520–7535 Search PubMed.
- Y. Yan, Q. Liu, X. Du, J. Qian, H. Mao and K. Wang, Anal. Chim. Acta, 2015, 853, 258–264 Search PubMed.
- S. Komathi, N. Muthuchamy, K. P. Lee and A. I. Gopalan, Biosens. Bioelectron., 2016, 84, 64–71 Search PubMed.
- Y. Wang, W. Wang, S. Wang, W. Chu, T. Wei, H. Tao, C. Zhang and Y. Sun, Sens. Actuators, B, 2016, 232, 448–453 Search PubMed.
- Y. Xin, Z. Li, W. Wu, B. Fu, H. Wu and Z. Zhang, Biosens. Bioelectron., 2017, 87, 396–403 Search PubMed.
- J.-H. Lee, I.-C. Leu, M.-C. Hsu, Y.-W. Chung and M.-H. Hon, J. Phys. Chem. B, 2005, 109, 13056–13059 Search PubMed.
- X. Zhang, V. Thavasi, S. G. Mhaisalkar and S. Ramakrishna, Nanoscale, 2012, 4, 1707–1716 Search PubMed.
- M. S. Arif Sher Shah, K. Zhang, A. R. Park, K. S. Kim, N.-G. Park, J. H. Park and P. J. Yoo, Nanoscale, 2013, 5, 5093–5101 Search PubMed.
- J. Fang, L. Xu, Z. Zhang, Y. Yuan, S. Cao, Z. Wang, L. Yin, Y. Liao and C. Xue, ACS Appl. Mater. Interfaces, 2013, 5, 8088–8092 Search PubMed.
- X. Liu, R. Yan, J. Zhu, X. Huo and X. Wang, Electrochim. Acta, 2015, 173, 260–267 Search PubMed.
- G.-C. Fan, M. Zhao, H. Zhu, J.-J. Shi, J.-R. Zhang and J.-J. Zhu, J. Phys. Chem. C, 2016, 120, 15657–15665 Search PubMed.
- S. Çakar and M. Özacar, J. Photochem. Photobiol., A, 2017, 346, 512–522 Search PubMed.
- J. Wang, Chem. Rev., 2008, 108, 814–825 Search PubMed.
- P. Wu, Y. He, H.-F. Wang and X.-P. Yan, Anal. Chem., 2010, 82, 1427–1433 Search PubMed.
- R. Ahmad, M.-S. Ahn and Y.-B. Hahn, Electrochem. Commun., 2017, 77, 107–111 Search PubMed.
- D. Geng, X. Bo and L. Guo, Sens. Actuators, B, 2017, 244, 131–141 Search PubMed.
- Y.-C. Zhu, N. Zhang, Y.-F. Ruan, W.-W. Zhao, J.-J. Xu and H.-Y. Chen, Anal. Chem., 2016, 88, 5626–5630 Search PubMed.
- S. I. Mogal, V. G. Gandhi, M. Mishra, S. Tripathi, T. Shripathi, P. A. Joshi and D. O. Shah, Ind. Eng. Chem. Res., 2014, 53, 5749–5758 Search PubMed.
- B. Liu and E. S. Aydil, J. Am. Chem. Soc., 2009, 131, 3985–3990 Search PubMed.
- F. Wang, J. Zheng, J. Qiu, S. Liu, G. Chen, Y. Tong, F. Zhu and G. Ouyang, ACS Appl. Mater. Interfaces, 2017, 9, 1840–1846 Search PubMed.
- C. Ye, Y. Bando, G. Shen and D. Golberg, J. Phys. Chem. B, 2006, 110, 15146–15151 Search PubMed.
- A. V. Raghu, K. K. Karuppanan and B. Pullithadathil, Adv. Mater. Interfaces, 2019, 6, 1801714 Search PubMed.
- S. K. Parayil, H. S. Kibombo, C.-M. Wu, R. Peng, J. Baltrusaitis and R. T. Koodali, Int. J. Hydrogen Energy, 2012, 37, 8257–8267 Search PubMed.
- M.-C. Daniel and D. Astruc, Chem. Rev., 2004, 104, 293–346 Search PubMed.
- B. H. Meekins and P. V. Kamat, ACS Nano, 2009, 3, 3437–3446 Search PubMed.
- G. Wang, Q. Wang, W. Lu and J. Li, J. Phys. Chem. B, 2006, 110, 22029–22034 Search PubMed.
- Z. Yang, Y. Ren, Y. Zhang, J. Li, H. Li, X. H. X. Hu and Q. Xu, Biosens. Bioelectron., 2011, 26, 4337–4341 Search PubMed.
- R. Zhao, X. Liu, J. Zhang, J. Zhu and D. K. Y. Wong, Electrochim. Acta, 2015, 163, 64–70 Search PubMed.
- Y. Wang, L. Liu, M. Li, S. Xu and F. Gao, Biosens. Bioelectron., 2011, 30, 107–111 Search PubMed.
- Z. Yang, Y. Tang, J. Li, Y. Zhang and X. Hu, Biosens. Bioelectron., 2014, 54, 528–533 Search PubMed.
- S. Deng, G. Jian, J. Lei, Z. Hu and H. Ju, Biosens. Bioelectron., 2009, 25, 373–377 Search PubMed.
Footnote |
| † Electronic supplementary information (ESI) available: XRD patterns of TiO2, C/TiO2, Au/TiO2 and Au@C/TiO2 between 15° and 30°; electron lifetime measurements of TiO2, C/TiO2, Au/TiO2, Au@C/TiO2; Mott–Schottky plots of TiO2, C/TiO2, Au/TiO2, Au@C/TiO2. See DOI: 10.1039/d0ra08920f |
| This journal is © The Royal Society of Chemistry 2020 |