 Open Access Article
Designing a high-performance smart drug delivery system for the synergetic co-absorption of DOX and EGCG on ZIF-8
Ahmad Haghi,
Heidar Raissi *,
Hassan Hashemzadeh
 and
Farzaneh Farzad
Department of Chemistry, University of Birjand, Birjand, Iran. E-mail: hraeisi@birjand.ac.ir
First published on 17th December 2020
Abstract
Due to the extreme pore volume and valuable surface area, zeolitic imidazole frameworks (ZIFs) are promising vehicles that enhance the delivery of therapeutic agents to tissues. Furthermore, these nanoporous materials have high stability in the pH and temperature of the surrounding healthy cells (37 °C and pH = 7) and an exotic potential to deform in carcinogenic environment (T > 37 °C and pH ∼ 5.5), which make them perfect smart drug delivery vehicle candidates. In this work, a series of molecular dynamics (MD) and metadynamics simulations have been performed to gain molecular insight into the mechanisms involved in the process of co-loading of doxorubicin (DOX) and EpiGalloCatechin-3 Gallate (EGCG) on ZIF-8, which form a smart drug delivery system (SDDS). The obtained results revealed that DOX was adsorbed on the carrier mostly through electrostatic interactions (Ecoul = ∼−1200 kJ mol−1, Etot = −1700 kJ mol−1), and EGCG was stacked on ZIF-8 mainly via van der Waals interactions (EL-J = ∼−600 kJ mol−1, Etot = ∼−1200 kJ mol−1). It is worth mentioning that the drug–drug L-J interactions (EL-J = ∼500 kJ mol−1) were also important in the co-loading process. The insertion of DOX and EGCG as additive agents to the initial ZIF-8/EGCG and ZIF-8/DOX systems led to the enhancement of the drug–carrier pair interactions to about ∼−2300 kJ mol−1 and ∼−2000 kJ mol−1, respectively. This finding implied that the drug–drug interactions had a complementary role in the development of SDDS via ZIF-8. From the metadynamics simulation, it was found that the geometry of the drugs is a determining factor in an efficient co-loading SDDS.
Introduction
From the pharmaceutical point-of-view, the production of a new drug normally takes up to a decade or more, besides the several hundreds of millions of dollars in the budget. Despite the time and monetary investments, the produced drugs may also suffer from low solubility, nonspecific delivery, and uncontrolled release. These shortcomings mostly lead to the administration of high drug dosages that are accompanied by severe side effects. When it comes to chemotherapy, side effects that are sometimes negligible turn out to be of more importance at other times because the chemotherapeutic agents not only annihilate cancerous tumors but also kill normal cells. Therefore, frequent usage of such drugs in cancer therapy may inadvertently cause serious damages to healthy tissues as well.1 Doxorubicin (DOX) is one of many such anticancer drugs that are ordinarily prescribed for the treatment of various conditions, including breast cancer, bladder cancer, lymphoma, and lymphocytic leukemia. Furthermore, regular DOX injection may lead to several side effects, such as hair loss, nausea, vomiting, dilated cardiomyopathy, and potentially lethal heart failure, among many other threats.2 It is well-known that the antitumor property of DOX is achieved through different mechanisms and that in many of them, free radicals are produced, and are considered the main culprit behind the cardiotoxic side effects.3–5There are plenty of herbal-extracted components with proven anticancer properties, among which EpiGalloCatechin-3 Gallate (EGCG) has shown bioactivities, such as antioxidative, anticarcinogenic, anti-inflammatory, and cardioprotective, which is of special interest.6–8 As the main and most biologically active component of green tea, EGCG exhibits antioxidative property by decreasing the reactive oxygen species (ROS) levels in the intracellular medium.9,10 Rafieian-Kopaei and Movahedi11 published an updated review on the chemopreventive and chemotherapeutic effects of green tea components on breast cancer. They mentioned that EGCG, among other polyphenol constituents of green tea, effectively acted as a chemotropic agent through a mechanism involving growth factor signaling, angiogenesis, and lipid metabolism. Tae Won Kwak et al.,12 investigated the anticancer activities of EGCG and found that it could suppress the growth of HuCCt1 cells through the inhibition of the folate pathway, without showing any adverse effects on 293T cells. Zhang et al.,13 suggested a mechanism by which EGCG may mediate breast cancer inhibition and found out that it could reduce the activity of Rac1 and expression of VASP in MCF-7 cells. Cao et al.,14 reported a comprehensive review of experimental investigations, suggesting that the polyphenol constituents of green tea, including EGCG, can improve anticancer drug efficiency and reduce their side effects. Stearns et al.,15 explored the combined therapeutic effects of EGCG with DOX in human prostate tumors. They found that the combination of EGCG and DOX showed better therapeutic properties. Such synergetic effects of green tea extracts on DOX anticancer activity have already been reported by many other studies.16,17
Moreover, the side effects of chemotherapeutic agents can be further reduced via targeted delivery in which drugs are directly released in target cells. In this regard, a series of metal–organic frameworks, called zeolitic imidazole framework (ZIF), firstly synthesized by Park et al.,18 can make a great contribution as efficient carriers for controlled drug delivery. ZIF-8, with a chemical formula of C6H6N4Zn, was synthetically crystallized by Olga Karagiaridi et al.,19 in a cubic crystallographic system with sodalite topology and a unit cell length of 16.9 Å. At neutral pH environments (e.g. blood and normal tissue), ZIF-8 shows great thermal and aqueous stability, while at acidic levels (tumor tissue conditions), it self-decomposes into harmless components. Adhikari et al.,1 explored the encapsulation and release of DOX via ZIF-7 and -8 and found that ZIF-8 could effectively encapsulate the drug and release it in a controlled manner, whereas ZIF-7 was not as efficient. These frameworks have been used by many other authors as vehicles to deliver drugs.20–23
The classical molecular dynamics (MD) simulation is a computational method that can determine the equilibrium and dynamic properties of a molecular system by solving the Newtonian equation of motions for all of the constituent atoms of the system.24 MD simulations are widely used in many disciplines, including physics, chemistry, and biology.25–27 It is proven to be a powerful tool in providing molecular insights into the processes involved in physical absorption on a substrate surface, especially in the case of smart drug delivery systems.28–30 Well-tempered metadynamics simulation, firstly suggested by Alessandro Laio and Michele Parrinello in 2002,31 is an enhanced sampling technique and is considered to be a very powerful tool for the exploration of meta-stable states and free energy surface.32 These states are often separated via high-energy barriers that are sometimes hard and even unlikely to explore through the classical MD simulations.33
In this work, we performed a series of classical MD and well-tempered metadynamics simulations to examine the kinetic and thermodynamic properties of DOX and EGCG adsorption on the ZIF-8 surface, a probable smart drug delivery vehicle. Furthermore, the dual loading of these chemotherapy agents on the ZIF-8 surface was examined.
Materials and methods
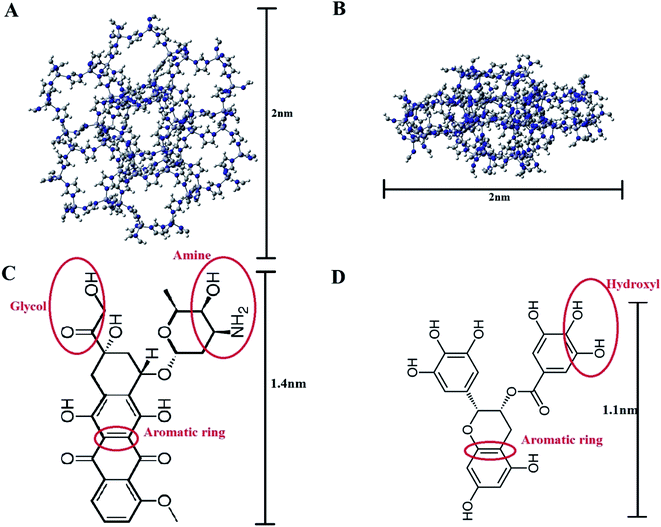
The crystal structure of ZIF-8, the model carrier, was obtained from the Chemtub3D website. Moreover, the structural data files (SDF) for Doxorubicin (PubChem CID: 31703) and EGCG (PubChem CID: 65064) molecules were taken from the PubChem database (Fig. 1). All computations were performed via GROMACS 2019.2.34,35 The force field parameters for ZIF-8 and the drug molecules were obtained from Zheng et al.,36 and CHARMM36,37 respectively. Two types of cubic simulation boxes with the sizes of 7 × 7 × 7 nm3 and 8 × 8 × 8 nm3, both containing a ZIF-8 nanoparticle made of 2 × 2 × 2 unit cells, were employed. The drug molecules were inserted into the simulation boxes and filled with the standard TIP3P water models. It should be noted that the drug molecules were located at least 2 nm away from the ZIF-8 surface to avoid the initial effect. A concentration of 0.15 M NaCl was chosen to mimic the real biological environment.Five MD simulation systems were constructed as follows: in system-1, 10 DOX molecules were inserted into a 7 × 7 × 7 nm3 simulation box, which ran for 200 ns to reach the equilibrium state. In system-2, the final configuration of the ZIF-8/DOX complex was extracted from system-1. Then, this complex was placed at the center of an 8 × 8 × 8 nm3 simulation box alongside 10 EGCG molecules, and the system was run for 300 ns. To build system-3, 10 EGCG molecules were added to a 7 × 7 × 7 nm3 box and run for 105 ns for all the drug molecules to be absorbed on the surface of ZIF-8 and to ensure the stability of the system (resembling step 1). In system-4, water and ions were removed from the MD simulation box resulting from system-3, and the remaining ZIF-8/EGCG complex was inserted into another 8 × 8 × 8 nm3 simulation box alongside 10 DOX molecules, and the system ran for 300 ns (resembling step 2). Furthermore, to explore the kinetic and competitive drug adsorption behavior, system-5 was designed with five EGCG and five DOX molecules posed around ZIF-8, and the MD production ran for 300 ns. More details on the MD simulation procedures are provided in Table 1.
| No. of row | Initial composition (no. of molecules) | Simulation box size (nm3) | Inserted molecules (no. of molecules) | Running time (ns) |
|---|---|---|---|---|
| 1 | ZIF-8 (1) | 7 × 7 × 7 | DOX (10) | 200 |
| 2 | ZIF-8 (1) + DOX (10) | 8 × 8 × 8 | EGCG (10) | 300 |
| 3 | ZIF-8 (1) | 7 × 7 × 7 | EGCG (10) | 105 |
| 4 | ZIF-8 (1) + EGCG (10) | 8 × 8 × 8 | DOX (10) | 300 |
| 5 | ZIF-8 (1) | 7 × 7 × 7 | DOX (5) + EGCG (5) | 300 |
The analysis of free energy surfaces (FES) for the adsorption of six individual DOX and EGCG molecules on different positions of the ZIF-8 surface was carried out through well-tempered metadynamics simulation via the sum_hills tool in Gromacs 2019.2 ref. 34, 35 and 38 patched with the PLUMED version 2.5.2 plugin40.39 Initial height for Gaussian hills set to 1.0 kJ mol−1 and width of 0.25 A that deposited every 500 time-steps with a bias factor of 15.
The FESs are calculated as a function of the distance between the center of mass (COM) of DOX and the COM of chosen atoms on the ZIF-8 surface that are already proven to have the most interactions with DOX according to MD simulation. More details about the well-tempered metadynamics simulation are provided and analyzed in the “Results and discussion” section.
Simulation
All simulations in this study were performed via the GROMACS 2019.2 molecular dynamics simulation package34,35,38 at 1 atm pressure and 310 K temperature, which resemble the biochemical conditions in living cells. It should be noted that the temperature and pressure were maintained at respective constant values by applying the V-rescale thermostat40 and the Berendsen algorithm,41 respectively. The equation for the motion of constituent atoms was solved by implementing the leap-frog algorithm with time-steps of 1.5 femtoseconds under the periodic boundary conditions. The LINCS algorithm42 was also used to make all the bonds in the designed systems constrained, and the Grid algorithm43 was used to search for neighboring atoms. Moreover, the particle-mesh Ewald (PME) method44 was used to represent long-range electrostatic interactions, while the short-range electrostatic interactions between charged groups were represented by Lennard-Jones (L-J) potential values calculated with a cutoff range of 1.3 nm. The visual molecular dynamics (VMD) program was utilized for the molecular visualization of the initial and final states of the systems.45Results and discussion
It is widely believed that the formation of drug/carrier complexes is mostly governed by the intermolecular hydrogen bond (HB) and π–π stacking interactions.30,46,47 Therefore, drugs are expected to be almost weakly bonded to conventional nano-carries like carbon nanotubes, graphene nanosheets, and their functionalized forms. On the contrary, the results provided in this paper make us cast doubts on such preconceptions because of the presence of metallic zinc atoms and the pH-sensitive ring of imidazole in the structure of the carrier.It is worth mentioning that drug–drug interactions in a co-loading system might have different effects on the adsorption of drugs on the carrier. The influence of these characteristics was subjected to scrutiny with different analyses in this study; albeit, it is necessary to make sure that the obtained results are derived from the equilibrated state of the systems. To ensure that the systems under MD simulation reached their respective equilibrium states and produced valid data as output, the root-mean-squared deviation (RMSD), L-J interaction, potential energy, and total energy were evaluated. Fig. 2 presents RMSD curves for the studied systems as a function of simulation time, demonstrating that all the studied systems reached their respective equilibrium state about 30 ns after MD production was started. It should be noted that the dimension of system-2 and system-4 that show flat RMSD curves at 5.5 nm was 8 × 8 × 8 nm3, and systems-1, -3, and -5 that show flat RMSD curves at 4.5 nm had a size of 7 × 7 × 7 nm3.
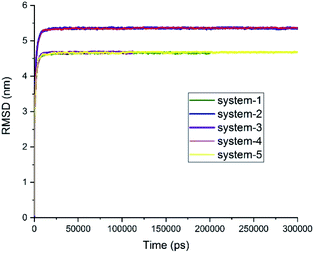 | ||
| Fig. 2 RMSD curves for the studied systems. Systems 2, 4, and 5 ran for 300 ns. System 1 ran for 200 ns, and system 3 ran for 105 ns (see Table 1). | ||
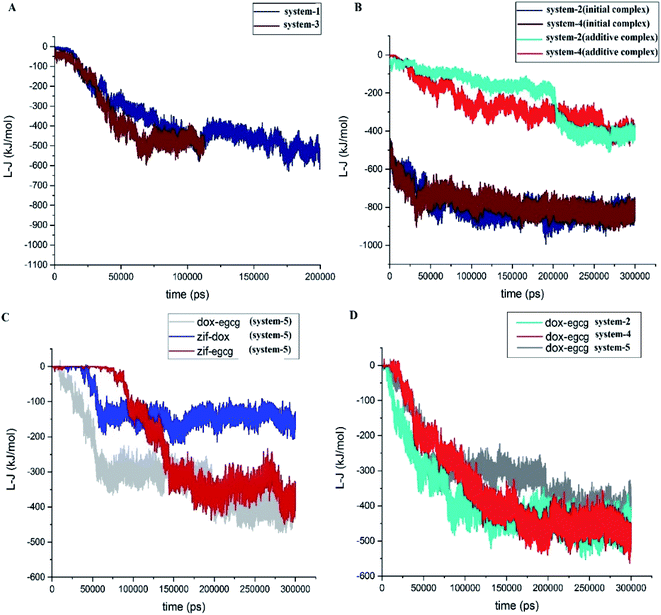
The interaction energies between the constituents of each system were also subjected to different analyses. Fig. 3A depicts the L-J energy values of the drug–carrier pair interactions in simulation systems 1 and 3. The ZIF-8/DOX and ZIF-8/EGCG pair interaction curves confirmed that their equilibrium states were reached after 150 ns and 50 ns, respectively. The MD simulations were continued for another 50 ns to confirm the stability of the systems. As mentioned in the “Materials and methods” section, the ZIF-8/drug complexes obtained from system-1 and system-3 were adopted as the initial substrates for constructing systems-2 and system-4, respectively. The pair interactions of different components of system-2 and system-4 (Fig. 1B) indicated that the L-J curves fully converged at ∼−800 kJ mol−1 after 300 ns. In the same manner, system-5 (competitive system) also approached its respective stable state by 300 ns. Now that the equilibrium state was confirmed, we continued to investigate the dynamics and kinetics of the systems.
A close inspection (Fig. 3B) revealed that the initial interaction of the drugs with ZIF-8 in system-2 and system-4 declined in a similar pattern from ∼−500 kJ mol−1 to ∼−800 kJ mol−1. This observation showed that the presence of additive molecules led to the reinforcement of the initial interactions of the drugs with the carrier. Moreover, the energy values for the ZIF-8/DOX and ZIF-8/EGCG pair interactions were lower when the drug was added as an additive than the corresponding values for system-1 and system-3, respectively. This may be related to the occupation of the preferred ZIF-8 active sites with the initially present drugs and, therefore, the availability of fewer active sites for the adsorption of the additive drugs.
Fig. 3C presents the L-J interaction curves for the competitive adsorption of DOX and EGCG on the ZIF-8 surface (system-5). As seen in this figure, the DOX molecules are absorbed on ZIF-8 quickly after 60 ns, and their pair interaction fluctuates around its average value (∼−150 kJ mol−1) for the rest of the simulation time. Whereas, the adsorption of EGCG on the carrier takes more time and happens around 140 ns, and its energy fluctuates at about −350 kJ mol−1. A comparison of the L-J values of the drug–carrier combinations showed that interaction in the ZIF-8/EGCG pair was significantly more than that in ZIF-8/DOX.
The L-J interaction energy between DOX and EGCG was also evaluated in system-5, and the obtained result is given in Fig. 3C. The value of energy for the DOX–EGCG pair was comparable with that of the ZIF–EGCG pair and reached ∼−400 kJ mol−1. The drug–drug pair interactions in systems-2, -4, and -5, are represented in Fig. 3D, which reveals that the pair interactions in the mentioned systems decreased almost in the same manner. The average energies for the DOX–EGCG pair interactions in systems −2, −4, and −5 almost had a similar value at around ∼−500 kJ mol−1. These values are comparable with that of the drug–carrier interactions and might promote synergic adsorption of drugs on the carrier. Therefore, the existence of attraction between DOX and EGCG might help in better understanding and also in better design of real-world experiments.
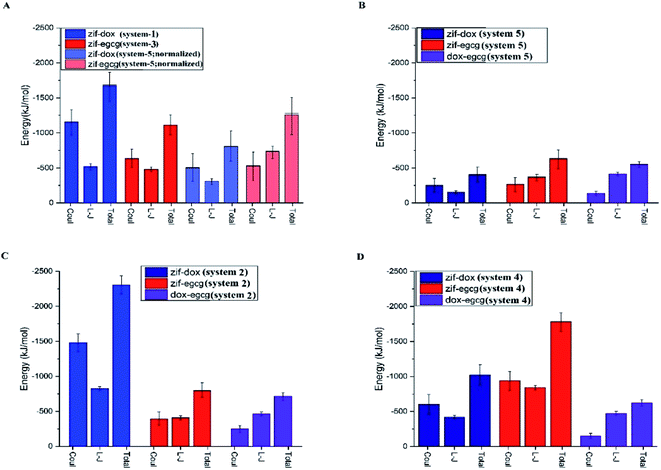
The average L-J, coulombic (coul), and total (L-J + coul) energies of every constituent in the studied systems are provided in Fig. 4. This can help us gain a better understanding of the contribution of each energy type in the adsorption process. Furthermore, it can provide the criteria to identify the exact mechanism involved in adsorption. Fig. 4 represents a comparison of the interaction energies of the drug/carrier and drug/drug pairs in the studied systems. As seen in this figure, the coulombic energy term was significantly higher than the L-J energy term for the drug–carrier interactions in the majority of the systems, especially for the ZIF-8/DOX pair. It can be deduced that the introduction of additive molecules leads to an increase in the adsorption energy of the initial drugs (see Fig. 4 panels C and D). A comparison between the investigated systems revealed that this increase was more noticeable for the ZIF-8/DOX pair. This remarkable interaction might also play an interfering role in the adsorption of EGCG on ZIF-8 in system 4.
Furthermore, in system 5, where the DOX and EGCG molecules fairly compete to adsorb on the ZIF-8 surface, both molecules had almost the same adsorption probability on the carrier surface. It is worth mentioning that EGCG performed a little better than DOX in adsorption on the substrate (Fig. 4B). The normalized total energy of adsorption for ZIF-8/EGCG in system-5 was comparable to that in system-3 (Fig. 4A). In such a system, the drug–drug interaction is also comparable to the drug–carrier interaction, and therefore, from Fig. 3C, it can be deduced that the fast adsorption of DOX on ZIF-8 might have a synergic effect on better adsorption of EGCG, resulting in higher total energy. To sum up, it can be stated that while designing a co-loading system, the order of inserting the chemotherapy agents is of high importance. When the higher adsorption of a specific drug on ZIF-8 is important, it is better to use it as the initial absorbate. However, if the therapeutic effects of both drugs are equal, a competitive adsorption scheme is better. It is evident from Fig. 4 that coulombic interactions play a determining role in the adsorption of molecules on the carrier, which can be related to the presence of metallic Zn and electronegative N in the structure of ZIF-8. In the case of DOX, the N-terminal (amine) and O-terminal (glycol) might also play an additional role in establishing electrostatic interactions and facilitating coulombic interactions with the Zn atom in ZIF-8.
Radial Distribution Function (RDF) is a valuable tool to describe the distribution of a guest molecule around a host surface; that is, in essence, another way of describing the interaction of the ligand with the substrate. In this case, RDF for the DOX and EGCG molecules with respect to the ZIF-8 surface is represented in Fig. 5. A close inspection of Fig. 5A, which shows no competition, revealed that EGCG was closer to the carrier but was present in less amount, and a higher amount of DOX accumulated a little farther away from the carrier. The location of DOX at a distance could be related to its bigger size compared to EGCG. Fig. 5B reveals that in system-5, the probability of finding EGCG was higher both in terms of closeness to the surface and amount. This is in agreement with the fact that the L-J and total energies for EGCG in this system were higher than those for DOX. A comparison between Fig. 5A and B reveals that strong interactions between the DOX and EGCG molecules had helped EGCG to get closer to the carrier in higher amounts. Furthermore, when there was unfair competition, in systems-2 and -4 (Fig. 5C), the first-added molecule, regardless of its nature, accumulated in a greater amount, and at a closer distance to the substrate. In this way, both DOX and EGCG, when used as the first molecule, revealed similar RDF patterns, but as an additive, DOX showed a higher peak at the same position where EGCG reached its maximum distribution. A close inspection of Fig. 3 and 4 reveals that DOX molecules had slightly lesser L-J interactions, whereas it shows higher values for coulombic interactions. This finding suggested that, for the DOX molecule, RDF was mostly governed by the coulombic interaction energy.
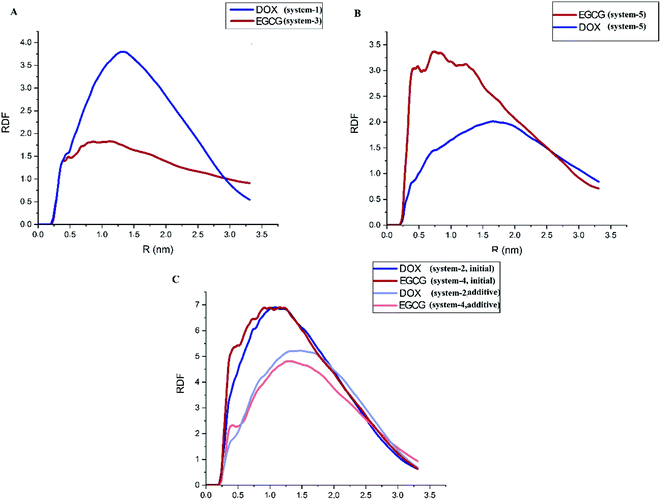 | ||
| Fig. 5 Radial distribution function of the drug molecules around the ZIF-8 surface in systems (A) 1 and 3, (B) 5 and (C) 2 and 4. | ||
To gain more knowledge about the nature of interactions between the drugs and carrier and also the importance of pair-wise interactions of various atoms in the ZIF-8/drug complex, Atomic Radial Distribution Function (aRDF) analysis was performed for systems 1 to 5. Fig. 6 presents the aRDF curves of individual pair interactions that potentially contribute to complexation. As seen in Fig. 6 panel A, the pair interaction of Zn in the ZIF-8 structure and oxygen in DOX showed an intense peak at around 0.4–0.6 nm. The highest Zn–O peak belonged to system-2, where the coulombic interaction is much higher than that in the other systems (ref. Fig. 4). A similar trend for the intensity of the Zn–O peak and coulombic energy was observed for other systems. In the case of EGCG, the lower Zn–O interaction led to a decrease in the coulombic term for the ZIF-8/EGCG complex. In other words, the stronger interaction of the Zn–O pair correlated with higher coulombic energy. On the contrary, the Zn–C pair interactions, which are a potential source of Zn⋯π interactions, and the N–C pair interactions that resemble π–π stacking showed the highest peak in the ZIF-8/EGCG complex of system-4 (panel D and F). It is believed that these interactions have a prominent impact on the extent of vdW energy. A close inspection of Fig. 6C–F indicates that the intensity of the Zn–C and N–C peaks in EGCG was higher than those in DOX molecules. These observations are in sound agreement with the obtained energy results, which suggests that the role of L-J interactions in the adsorption of EGCG on ZIF-8 is higher than that of the coulombic term.
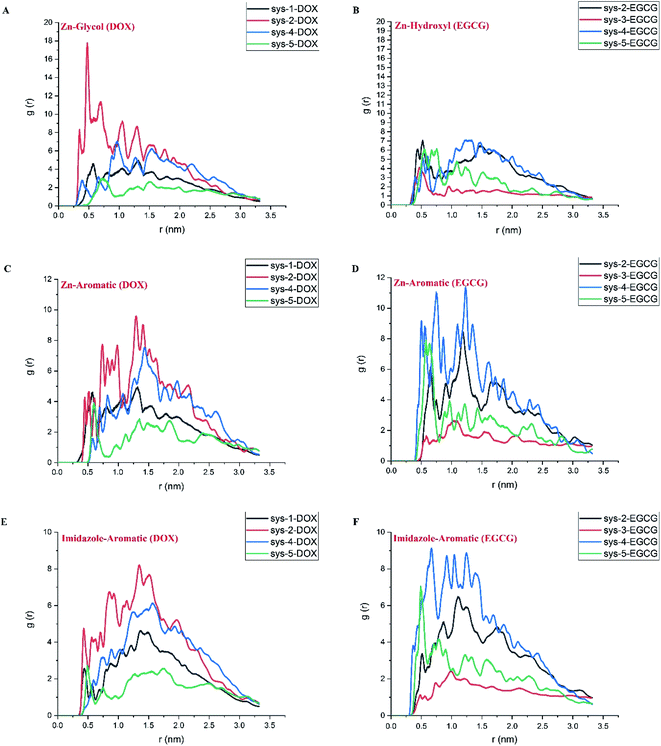 | ||
| Fig. 6 The atomic radial distribution function for different active cites in DOX (left) and EGCG (right) with respect to Zn and N (representing imidazole ring) in ZIF-8. The selected atoms for represent drug active sites are highlighted in Fig. 1 panels C and D. | ||
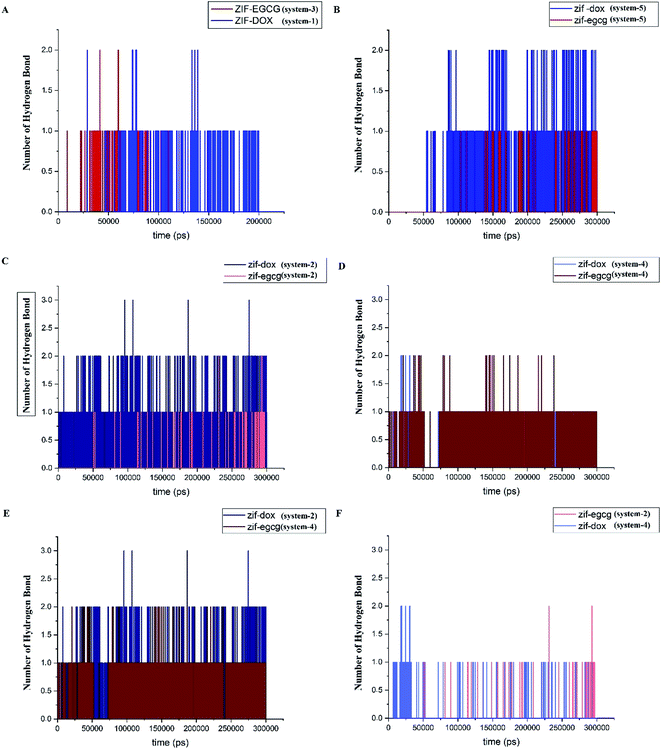
Hydrogen bonds formed between drugs and substrates are among the main factors contributing to the stability of the drug delivery system (DDS). They are the practical tool to investigate the natural forces involved in the process of adsorption. Based on a cutoff of 3.5 Å for the donor–acceptor distance, we assessed the number of hydrogen bonds and evaluated their role in the adsorption process of DOX and EGCG on the ZIF-8 surface. Fig. 7 provides the number of hydrogen bonds (HB) presumably formed between the selected pairs of components in the studied systems. Fig. 7A presents the number of hydrogen bonds formed between ZIF-8 and the ligands in systems 1 and 3. It must be noted that for reaching the equilibrium state, system-1 and -3 took 200 ns and 105 ns, respectively. In Fig. 7B, the competition between DOX and EGCG in forming hydrogen bonds with ZIF-8 in system-5 throughout the simulation time is depicted. As seen, the DOX molecule, which has more acceptor and donor atoms than EGCG, is prone to more hydrogen bond formation. This can be the reason for the high contribution of coulombic energy toward ZIF-8/DOX interaction. The number of HBs in systems −2 and −4 are given in Fig. 7 panels C and D, respectively. Obviously, DOX could make more HBs as an initial drug, although EGCG controlled all possible HBs in system 4. It can be concluded that DOX forms more HBs when used as the initial molecule, while as an additive, EGCG forms more HBs (see Fig. 7C–F). This observation is in line with the adsorption energy result that by reducing the number of hydrogen bonds between the drugs and ZIF-8, the adsorption energy for this pair could be significantly reduced. Despite the significant decrease in the number of HBs, the adsorption energy was relatively high in the case of DOX used as an additive. Therefore, it seems that other interactions, such as Zn–O, Zn–π, and π–π are, more effective in the interaction of DOX with ZIF-8.
Mean Squared Displacement (MSD) is another statistical tool to explore the behavior of ligands absorbed on a substrate. Based on eqn (1), the mean square displacement was calculated to evaluate the behavior of the drug molecules in the ZIF-8 pores.
| MSD (Δt) = 〈(ri(Δt) − ri(0))2〉 = 〈Δri(Δt)2〉 | (1) |
 | (2) |
According to this equation, the self-diffusivity Di of the DOX and EGCG molecules was calculated with respect to the ZIF-8 nanoparticle and is listed in Table 2.
| Sys numb | Component | Di | Error |
|---|---|---|---|
| System 1 | DOX | 0.0041 | ±0.0000 |
| System 2 | EGCG | 0.0026 | ±0.0013 |
| System 3 | EGCG | 0.0095 | ±0.0039 |
| System 4 | DOX | 0.0030 | ±0.0014 |
| System 5 | EGCG | 0.0053 | ±0.0005 |
| System 5 | DOX | 0.0051 | ±0.0001 |
The results presented in Table 2 reveal that in systems 1 and 3, where there was no competition between the components, and also in system 5, in which there was a fair competition, the EGCG molecules showed higher Di and error values compared with the DOX molecules. This finding can be related to the smaller size of EGCG, as well as its weaker interaction with ZIF-8. The higher diffusion of EGCG leads to an increase in its movement and consequently, helps it to get closer to the surface of the carrier. This is confirmed by the RDF results in Fig. 4, which indicates that the distance between EGCG and ZIF-8 is shorter than that between DOX and ZIF-8. In system 2, the diffusion coefficient of EGCG was significantly reduced compared with system 3. This observation can be explained by the blocking effect of the DOX molecule. Similar behavior of the DOX molecule was observed in system-1 and system-4.
Metadynamics
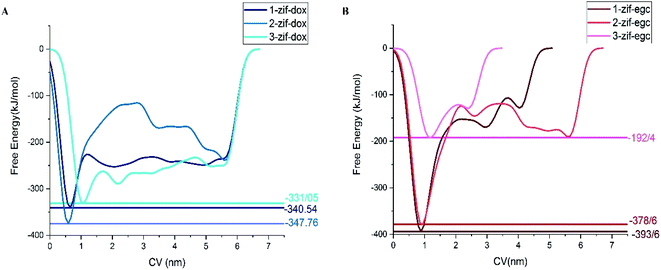
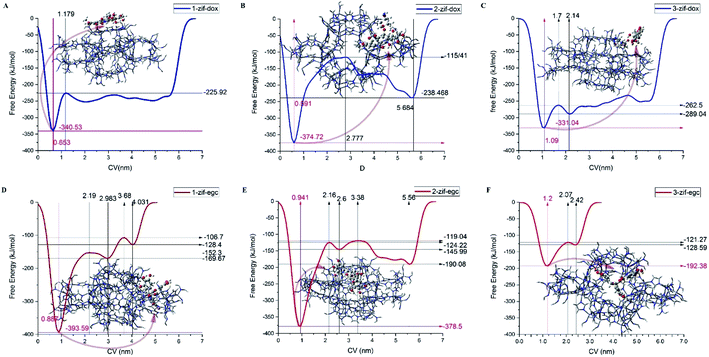
Metadynamics simulation is performed for investigating drug adsorption on different active sites of ZIF-8 in systems-1 and -3. For this purpose, the final configurations of the drug/carrier complexes in system-1 and system-3 were analyzed, and three different adsorption configurations for each system were used.Fig. 8 and 9 depict the free energy surfaces (FES) of the adsorption process for the individual center of mass (COM) of DOX or EGCG with respect to the corresponding COM of the active sites in ZIF-8, which host DOX or EGCG. For long distances of the ligand from the carrier surface, the free energy set was to be zero. It turned more and more negative as the molecule moved toward the carrier through the adsorption process. In the process of reaching their respective global minima, they experience local minima and energetic boundaries that are usually presented as reaction coordination curves. As seen in Fig. 8 and 9, the global minima for ZIF-8/DOX (ZIF-8/EGCG) at positions no. 1, 2, and 3 were observed at around 0.65(0.88), 0.5(0.95), and 1.1(1.2) nm, respectively. The free energy values for the ZIF-8/DOX complexes at their global minima were about −340, −360, and −330 kJ mol−1. While, on the one hand, FES at the global minimum for the ZIF-8/EGCG complexes at positions no. 1 and 2 even reached −390 and −380 kJ mol−1, respectively; on the other hand, the value for the 3rd position never exceeded −192 kJ mol−1.
It seems that π–π and X–π (X stand for Zn or N atoms) stacking interactions are the main factors behind EGCG absorption on ZIF-8. Therefore, the free energy values might vary in a wide range depending on the drug orientation and the ZIF-8 active sites. When the EGCG molecule is stuck in a cavity of ZIF-8, it can form π-stacking interactions with the substrate through all of its three wings, while at the surface, two wings of the EGCG molecule interact with each side of the edge and the third one can barely form any interactions (Fig. 9). More precisely, when the EGCG molecule was at configuration 3, its global minimum reached −190 kJ mol−1, whereas, in configurations 1 and 2, the global minimum exceeded −390 kJ mol−1. However, in the ZIF-8/DOX complexes, hydrogen bonds, along with other types of electrostatic attractions, between DOX and carrier played the governing role. The lowest global minimum for the ZIF-8/DOX complex in the different configurations varied in a narrow margin of 330–350 kJ mol−1. These might be, to some extent, a result of the planar and simpler structure of DOX molecules in comparison with the tridentate EGCG molecule.
The formation of electrostatic interactions, such as conventional and non-conventional HBs, between DOX and ZIF-8 (see Fig. 7), reflected in their higher coulombic interaction energy (Fig. 4). Overall, an individual EGCG molecule can be strongly absorbed at a specific active site on ZIF-8 through π–X stacking interactions. However, their binding strength might change with the orientation of the molecule and its adsorption position on the carrier surface (FESs of EGCG in different positions are compared in Fig. 8B). The position of drug adsorption on the carrier surface at a global minimum point can reflect on the contribution of the energy terms.
Conclusions
Classical molecular dynamics and well-tempered metadynamics simulations were performed to gain molecular insight into the co-loading of DOX and EGCG on ZIF-8 nanoparticles. The obtained results reveal that in a co-loading system, the strength of the physical adsorption of a molecule depends on the drug insertion order. It was found that the drug–carrier L-J interaction energy value of the first inserted molecule, whether it is DOX or EGCG, reached −600 kJ mol−1 at its equilibrium state. The insertion of an additive drug imposed a synergic effect on the initial ZIF-8/drug complex and further decreased the L-J interaction energy to about −800 kJ mol−1. Besides the drug–carrier complex, the drug–drug L-J interaction energy was also considerable and consequently, played a critical role in the adsorption process. In a competitive system, DOX kinetically adsorbs on the ZIF-8 surface relatively fast and interacts with EGCG molecules and may facilitate its adsorption on the carrier. The HB analyses revealed that DOX has a better ability to form a hydrogen bond with the carrier than EGCG. However, HB was not the only factor involved in the process of adsorption. The aRDF investigations revealed that the glycol–Zn interaction played a major role in the adsorption of DOX on ZIF-8. On the contrary, the π–π and Zn–π interactions were the determinant interactions in the case of EGCG.The mean squared displacement analyses for DOX and EGCG suggest that in the absence of DOX, EGCG can diffuse better into the nanocarrier cavity because of its smaller size and weaker binding to ZIF-8 in comparison with DOX. However, in the presence of DOX as an initial or additive molecule, the Di of the EGCG molecules noticeably decreased. This behaviour may be explained by the interfering or blocking effect of DOX. On the contrary, in a competitive system, where active sites were widely available for the two drugs, Di values of both drugs were relatively equal with no sign of blocking or interfering effects.
Metadynamics simulations performed for EGCG at 3 different active sites on the ZIF-8 surface revealed that the global minimum at FES depends on where and how EGCG meets ZIF-8. EGCG, being a tridendate molecule, mostly gets stuck on the substrate in a way that one of its arms has no considerable interaction with ZIF-8, while the planar structure of DOX allows the drug to stack on the carrier and making interactions in all possible capacity. Consequently, when EGCG was stuck over the substrate in its full capacity, FES revealed a global minimum at about −390 kJ mol−1, which is almost 10% higher than the DOX free energy value. However, there is still a chance for the EGCG molecules to leave an arm without interaction with the substrate and consequently drop its global minimum by half.
Overall, to design a purposeful system for the co-delivery of DOX and EGCG with ZIF-8, the order of drug insertion should be kept in mind. Furthermore, the availability of active sites, the size of nanoparticles, and the concentration of the drugs must be considered for enhancing DDS efficiency.
Conflicts of interest
There are no conflicts to declare.Notes and references
- C. Adhikari, A. Das and A. Chakraborty, Mol. Pharm., 2015, 12, 3158–3166 Search PubMed.
- K. Chatterjee, J. Zhang, N. Honbo and J. S. Karliner, Cardiology, 2010, 115, 155–162 Search PubMed.
- G. Powis, Free Radical Biol. Med., 1989, 6, 63–101 Search PubMed.
- S. Rossi, Antimycotic imidazoles. part. 4, Adelaide: The Australian Medicines Handbook Unit Trust, p. 1056 Search PubMed.
- H. G. Keizer, H. M. Pinedo, G. J. Schuurhuis and H. Joenje, Pharmacol. Ther., 1990, 47, 219–231 Search PubMed.
- W. Zhong, X.-D. Huan, Q. Cao and J. Yang, Exp. Ther. Med., 2015, 9, 405–410 Search PubMed.
- P. A. Townsend, T. M. Scarabelli, E. Pasini, G. Gitti, M. Menegazzi, H. Suzuki, R. A. Knight, D. S. Latchman and A. Stephanou, FASEB J., 2004, 18, 1621–1623 Search PubMed.
- Y.-F. Yao, X. Liu, W.-J. Li, Z.-W. Shi, Y.-X. Yan, L.-F. Wang, M. Chen and M.-Y. Xie, Life Sci., 2017, 180, 151–159 Search PubMed.
- T. Nakazato, K. Ito, Y. Ikeda and M. Kizaki, Clin. Cancer Res., 2005, 11, 6040–6049 Search PubMed.
- C.-T. Wang, H.-H. Chang, C.-H. Hsiao, M.-J. Lee, H.-C. Ku, Y.-J. Hu and Y.-H. Kao, Mol. Nutr. Food Res., 2009, 53, 349–360 Search PubMed.
- M. Rafieian-Kopaei and M. Movahedi, Electron. Physician, 2017, 9, 3838–3844 Search PubMed.
- T. W. Kwak, S. B. Park, H.-J. Kim, Y.-I. Jeong and D. H. Kang, OncoTargets Ther., 2017, 10, 137–144 Search PubMed.
- Y. Zhang, G. Han, B. Fan, Y. Zhou, X. Zhou, L. Wei and J. Zhang, Eur. J. Pharmacol., 2009, 606, 172–179 Search PubMed.
- J. Cao, J. Han, H. Xiao, J. Qiao and M. Han, Nutrients, 2016, 8, 762–772 Search PubMed.
- M. E. Stearns, M. D. Amatangelo, D. Varma, C. Sell and S. M. Goodyear, Am. J. Pathol., 2010, 177, 3169–3179 Search PubMed.
- L. Chen, H.-L. Ye, G. Zhang, W.-M. Yao, X.-Z. Chen, F.-C. Zhang and G. Liang, PLoS One, 2014, 9, 85771–85783 Search PubMed.
- T. Cheng, J. Liu, J. Ren, F. Huang, H. Ou, Y. Ding, Y. Zhang, R. Ma, Y. An, J. Liu and others, Theranostics, 2016, 6, 1277–1292 Search PubMed.
- K. S. Park, Z. Ni, A. P. Côté, J. Y. Choi, R. Huang, F. J. Uribe-Romo, H. K. Chae, M. O'Keeffe and O. M. Yaghi, Proc. Natl. Acad. Sci., 2006, 103, 10186–10191 Search PubMed.
- O. Karagiaridi, M. B. Lalonde, W. Bury, A. A. Sarjeant, O. K. Farha and J. T. Hupp, J. Am. Chem. Soc., 2012, 134, 18790–18796 Search PubMed.
- M. Gomar and S. Yeganegi, Microporous Mesoporous Mater., 2017, 252, 167–172 Search PubMed.
- Z. Tian, X. Yao and Y. Zhu, Microporous Mesoporous Mater., 2017, 237, 160–167 Search PubMed.
- L. Shi, J. Wu, X. Qiao, Y. Ha, Y. Li, C. Peng and R. Wu, ACS Biomater. Sci. Eng., 2020, 6(8), 4595–4603 Search PubMed.
- C. Zheng, Y. Wang, S. Z. F. Phua, W. Q. Lim and Y. Zhao, ACS Biomater. Sci. Eng., 2017, 3, 2223–2229 Search PubMed.
- G. Sutmann, Multiscale Simulations Methods, Mol. Sci., 2009, 42, 1–50 Search PubMed.
- T. Nanok, S. Vasenkov, F. J. Keil and S. Fritzsche, Microporous Mesoporous Mater., 2010, 127, 176–181 Search PubMed.
- P. Demontis, G. Stara and G. B. Suffritti, Microporous Mesoporous Mater., 2005, 86, 166–175 Search PubMed.
- P. Demontis and G. B. Suffritti, Microporous Mesoporous Mater., 2009, 125, 160–168 Search PubMed.
- M. Shahabi and H. Raissi, Appl. Surf. Sci., 2020, 146186 Search PubMed.
- C. Rungnim, T. Rungrotmongkol, S. Hannongbua and H. Okumura, J. Mol. Graphics Modell., 2013, 39, 183–192 Search PubMed.
- A. Alinejad, H. Raissi and H. Hashemzadeh, J. Biomol. Struct. Dyn., 2020, 38, 2737–2745 Search PubMed.
- A. Laio and M. Parrinello, Proc. Natl. Acad. Sci., 2002, 99, 12562–12566 Search PubMed.
- A. Barducci, G. Bussi and M. Parrinello, Phys. Rev. Lett., 2008, 100, 20603–20607 Search PubMed.
- V. Spiwok, P. Lipovová and B. Králová, J. Phys. Chem. B, 2007, 111, 3073–3076 Search PubMed.
- B. Hess, C. Kutzner, D. Van Der Spoel and E. Lindahl, J. Chem. Theory Comput., 2008, 4, 435–447 Search PubMed.
- C. Kutzner, S. Páll, M. Fechner, A. Esztermann, B. L. de Groot and H. Grubmüller, J. Comput. Chem., 2019, 40, 2418–2431 Search PubMed.
- B. Zheng, M. Sant, P. Demontis and G. B. Suffritti, J. Phys. Chem. C, 2012, 116, 933–938 Search PubMed.
- J. Lee, X. Cheng, J. M. Swails, M. S. Yeom, P. K. Eastman, J. A. Lemkul, S. Wei, J. Buckner, J. C. Jeong, Y. Qi and others, J. Chem. Theory Comput., 2016, 12, 405–413 Search PubMed.
- H. J. C. Berendsen, D. van der Spoel and R. van Drunen, Comput. Phys. Commun., 1995, 91, 43–56 Search PubMed.
- M. Bonomi, D. Branduardi, G. Bussi, C. Camilloni, D. Provasi, P. Raiteri, D. Donadio, F. Marinelli, F. Pietrucci, R. A. Broglia and others, Comput. Phys. Commun., 2009, 180, 1961–1972 Search PubMed.
- G. Bussi, D. Donadio and M. Parrinello, J. Chem. Phys., 2007, 126, 14101 Search PubMed.
- H. J. C. Berendsen, J. P. M. van Postma, W. F. van Gunsteren, A. DiNola and J. R. Haak, J. Chem. Phys., 1984, 81, 3684–3690 Search PubMed.
- B. Hess, H. Bekker, H. J. C. Berendsen and J. G. E. M. Fraaije, J. Comput. Chem., 1997, 18, 1463–1472 Search PubMed.
- V. Yip and R. Elber, J. Comput. Chem., 1989, 10, 921–927 Search PubMed.
- M. Deserno and C. Holm, J. Chem. Phys., 1998, 109, 7678–7693 Search PubMed.
- W. Humphrey, A. Dalke, K. Schulten and others, J. Mol. Graphics, 1996, 14, 33–38 Search PubMed.
- M. Pakdel, H. Raissi and M. Shahabi, J. Biomol. Struct. Dyn., 2020, 38, 1488–1498 Search PubMed.
- H. Moradnia, H. Raissi and M. Shahabi, J. Biomol. Struct. Dyn., 2020, 1–8 Search PubMed.
| This journal is © The Royal Society of Chemistry 2020 |

