 Open Access Article
Unraveling the mechanism of CO2 capture and separation by porous liquids†
Jie Yina,
Wendi Fua,
Jinrui Zhanga,
Hongshun Rana,
Naixia Lvb,
Yanhong Chao a,
Hongping Li
 *a,
Wenshuai Zhu
 *a,
Hui Liu*a and
Huaming Li
 a
a
aInstitute for Energy Research, School of Chemistry and Chemical Engineering, Jiangsu University, Zhenjiang, 212013, P. R. China. E-mail: hongpingli@ujs.edu.cn; zhuws@ujs.edu.cn; lh7544@ujs.edu.cn
bCollege of Biology and Chemistry, Xingyi Normal University for Nationalities, Xingyi, 562400, P. R. China
First published on 24th November 2020
Abstract
Carbon dioxide (CO2) emissions intensify the greenhouse effect so much that its capture and separation are needed. Porous liquids, possessing both the porous properties of solids and the fluidity of liquids, exhibit a wide range of applications in absorbing CO2, but the mechanism of gas capture and separation demands in-depth understanding. To this end, we provide a molecular perspective of gas absorption in a porous liquid composed of porous organic cages dissolved in a size-excluded solvent, hexachloropropene, by density functional theory for the first time. In this work, different conformations were considered comprehensively for three representative porous organic cages and molecules. Results show that chloroform, compared to CO2, tends to enter the cage due to stronger C–H⋯π interaction and the optimal capacity of each cage to absorb CO2 through hydrogen bonding and π–π interaction is 4, 2 and 4 equivalents, respectively. We hope that these discoveries will promote the synthesis of similar porous liquids that are used to capture and separate gases.
1. Introduction
With the increase of carbon dioxide emissions from fossil fuels, human health and the living environment have been seriously threatened due to the intensification of the greenhouse effect. Therefore, carbon dioxide capture and separation are particularly significant. Currently, the capture of CO2 includes not only solid adsorption, such as with metal organic frameworks (MOFs)1–3 and zeolites,4–6 but also liquid absorption, especially with ionic liquids.7–12As a new type of material, porous liquids have been a research hotspot since James et al.13 proposed the concept in 2007. In general, porous liquids are divided into three categories. One is pure substances with permanent pores, and the other two are those that dissolve rigid porous materials in sterically hindered solvents.13 It is the porous liquid that not only possesses the cavity of the porous material, but also combines the fluidity of the liquid, thus it has a huge application prospect in the storage and transportation of gas.
However, the difficulty of preparation greatly limits the development of porous liquids, resulting in a few related reports,14–24 many of which are more about porous organic cages.25 Jie et al.15 successfully developed a porous liquid based on an anionic organic covalent cage and crown ether through a supramolecular complexation strategy. James et al.22 modified the vertices of porous organic cages (POCs) with alkyl groups to make type I porous liquid. After that, a type II porous liquid containing crown ether modified POCs, dissolved in the size-excluded solvent 15-crown-5, is proposed.17 Owing to the high viscosity of the crown ether type porous liquid, the complicated production process and the low yield, a simple preparation type II porous liquid was introduced. The porous liquid consists of POCs formed by substituting amines in sterically hindered solvent hexachloropropene (PCP).17 These two liquids have a high absorption capacity for carbon dioxide, and it was found that after adding chloroform (CHCl3), the absorbed carbon dioxide would be displaced. Now that porous liquids are a promising new class of materials for gas capture, it is necessary for us to further gain insight into these systems from a molecular perspective to design better performance materials easily. Hence, several issues deserve further study that types of the interaction, gas absorption capacity of the cage cavity and the replaced mechanism. Here, the interaction between CO2 and the porous liquids as well as the displaced process needs more deep understanding at molecular level. In 2016, Zhang et al.26 studied the thermodynamics and kinetics for the storage of CH4, CO2, and N2 molecules in porous liquids by molecular dynamics (MD) simulations, which provided a dynamic view. By contrast, a static angle to systematically study the issues mentioned above is carried out through density functional theory (DFT) that is a method of studying the electronic structure of multi-electron systems and have encountered a wide range of applications to study molecular properties.27,28
In current work, we studied the optimal adsorption capacity of the cages and the interaction nature between POCs, CO2, and CHCl3 to elucidate the physics behind these macroscale characteristics from the microscopic point of view. Moreover, the exchange mechanism between chloroform and carbon dioxide is the dominated research content. After three representative POCs were properly constructed, various conformations where CO2 or CHCl3 lied in the cavity of the cage were considered in detail according to the symmetry of the cages. The results show that POCs have a certain adsorption capacity for CO2, and the cage does provide a cavity for absorbing or containing CO2. Furthermore, chloroform tends to interact with cavities more likely than CO2, as a result, CO2 will indeed be squeezed out by chloroform. It is hoped that this work will help to improve the absorption of CO2 and the synthesis of POCs.
2. Computational details
2.1 Theory
Whether it is liquid absorption or solid adsorption, almost all non-covalent forces exist in the system.7,29,30 Intermolecular non-covalent interactions, including hydrogen bonds, π–π interactions, C–H⋯π interactions, etc., are the foundation and core content of supramolecular chemistry. In this work, there are also non-covalent forces between the porous organic cage and CO2 (and/or CHCl3). Related literature shows that the M0X-type density functional (e.g. M06-2X) of the Minnesota family with dispersion correction is widely used in such non-covalent systems.27,28,31,32 Therefore, the M06-2X density function with dispersion correction in the Gaussian16 program33 was selected as the method. In addition, considering the reasonableness of the calculation time and the accuracy of the results, the smaller basis set 6-31G (d) was first used for structural optimization, and then the larger basis set 6-311G (d,p) was employed to calculate the energy and physical properties.2.2 Model
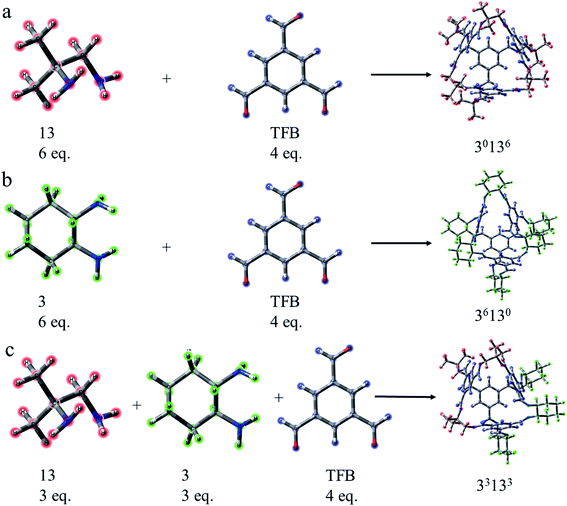
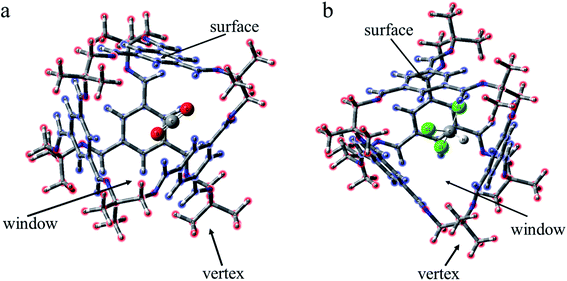
As a type II porous liquid, it is composed of hexachloropropene and porous organic cages (POCs). James et al.17 proved that the cavity provided by POCs does provide a great contribution to gas absorption. In view of this, we selected a single POC as the research object. As shown in Fig. 1 and 2, each POC has four surfaces and windows, as well as six vertices. The TFB (1,3,5-tricarbonylbenzene) in blue forms the surface of the cage, and the “3” (1,2-cyclohexanediamine) in green as well as the “13” (1,2-diamino-2-methylpropane) in red constitute the vertices of the cage. Obviously, POCs can be distinguished by different vertices. Given the rationality and complexity of the model, we chose three kinds of POC as representatives. 3x13y is defined as the number of 1,2-cyclohexanediamine (x) and the number of 1,2-diamino-2-methylpropane (y) in each cage. Thus, the three cages are named 30136, 36130 and 33133 respectively. By investigating the different positions of CO2 and CHCl3, the mechanism of CHCl3 displacing CO2 was explored.In order to intuitively understand the magnitude of the interaction between CO2/CHCl3 and the cavity, the interaction energy was calculated according to the following formula:
| Eabs = Eopt − Ecage − ECO2 − ECHCl3 + EBSSE | (1) |
Among them, Eopt is the optimized energy of placing CO2 and CHCl3 around the POC. Ecage is the energy of the cage. ECO2 and ECHCl3 represent the energy of carbon dioxide and chloroform, respectively. To obtain precise results, the basis set supper position error (BSSE) was taken into account. Generally speaking, the value of Eabs is negative. The greater its absolute value is, the stronger the force will be.
Furthermore, the exchange energy is defined to investigate the possibility for separation of CO2, which was calculated as follows:
| Eexc = Eout − Ein | (2) |
Among them, Eout refers to the lowest energy of the conformation in which CO2 stands outside the cage and CHCl3 lies inside the cage. Ein is the lowest energy of the conformation where CO2 lies inside the cage and CHCl3 stands outside the cage. Eexc is the exchange energy of CO2 and CHCl3. The positive or negative value indicates the stability of the conformation. If it is a positive value, it means that CO2 is relatively stable in the cage whereas a negative value indicates that CHCl3 in the cage is more stable. Hence, a negative value shows the potential to separation of CO2 after absorption.
What's more, in order to explore gas absorption capacity, the interaction energy of each gas molecule in per cage was obtained:
| ΔĒaver = 1/n(Eopt − Ecage − nECO2 + EBSSE) | (3) |
Among them, n is the number of gases. Eopt is the energy after structure optimization. Ecage represents the energy of the cage. ECO2 is the energy of a single CO2. Certainly, the BSSE was also included.
3. Results and discussion
3.1 Structures
For the structural analysis, there may be π–π interaction between CO2 and benzene ring, and C–H⋯π interaction, as well as Cl⋯π interaction, between chloroform and benzene ring. In order to clearly understand the magnitude of these forces, three model structures were separately construct as shown in Fig. S1.† We might as well take the center of the benzene ring as X, and then use the dashed line connecting the O atom above the benzene ring and X as the distance from CO2 to the benzene ring. Similarly, the interaction distance of C–H⋯π is the dashed line connecting the H atom and X, and the distance of Cl⋯π is the dashed line connecting the Cl atom and X. Besides, the energy and distance of the above three structures are listed for reference. It can be seen that the value of C–H⋯π is greater than the other two forces. As is shown in Fig. 2, according to the symmetry of the POC, except for the cavity, we considered three sites, namely the vertex, the window and the surface, which represents near the vertex formed by “3” (“13”), in the hole of the cage and on the benzene ring of TFB, respectively. Then, the positions of the inner and outer molecules of the POC were exchanged to obtain three other conformations.| Complex | Interaction energy (Eabs) | CO2 | CHCl3 | |||
|---|---|---|---|---|---|---|
| Bond angle (°) | Bond length (Å) | |||||
| CO2 | 180 | 1.163 | ||||
| C–H | 1.086 | |||||
![[thin space (1/6-em)]](https://www.rsc.org/images/entities/char_2009.gif) |
||||||
| Cage 30136 | ||||||
| COM-a | −9.2 | 179.711 | 1.161 | 1.167 | 1.085 | |
| COM-b | −15.9 | 179.817 | 1.161 | 1.166 | 1.092 | |
| COM-c | −12.6 | 179.736 | 1.161 | 1.167 | 1.085 | |
| COM-d | −18.2 | 179.782 | 1.164 | 1.162 | 1.086 | |
| COM-e | −19.0 | 178.569 | 1.165 | 1.162 | 1.089 | |
| COM-f | −19.4 | 178.848 | 1.165 | 1.162 | 1.085 | |
![[thin space (1/6-em)]](https://www.rsc.org/images/entities/char_2009.gif) |
||||||
| Cage 36130 | ||||||
| ABS-a | −9.7 | 179.872 | 1.166 | 1.162 | 1.085 | |
| ABS-b | −16.0 | 178.621 | 1.164 | 1.163 | 1.086 | |
| ABS-c | −12.7 | 179.798 | 1.164 | 1.163 | 1.087 | |
| ABS-d | −17.0 | 179.833 | 1.163 | 1.163 | 1.088 | |
| ABS-e | −22.9 | 176.277 | 1.160 | 1.167 | 1.089 | |
| ABS-f | −19.5 | 178.828 | 1.165 | 1.162 | 1.089 | |
![[thin space (1/6-em)]](https://www.rsc.org/images/entities/char_2009.gif) |
||||||
| Cage 33133 | ||||||
| SYS-a | −10.3 | 179.672 | 1.160 | 1.167 | 1.086 | |
| SYS-b | −16.2 | 179.669 | 1.160 | 1.167 | 1.086 | |
| SYS-c | −14.3 | 179.637 | 1.162 | 1.166 | 1.085 | |
| SYS-d | −18.1 | 179.835 | 1.163 | 1.163 | 1.088 | |
| SYS-e | −23.6 | 179.242 | 1.162 | 1.165 | 1.086 | |
| SYS-f | −20.7 | 178.887 | 1.162 | 1.166 | 1.087 | |
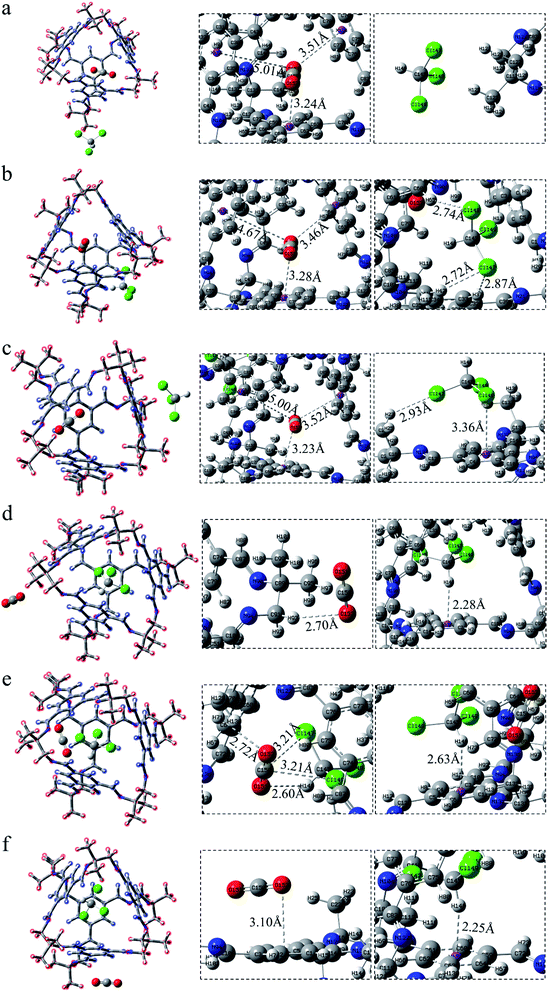
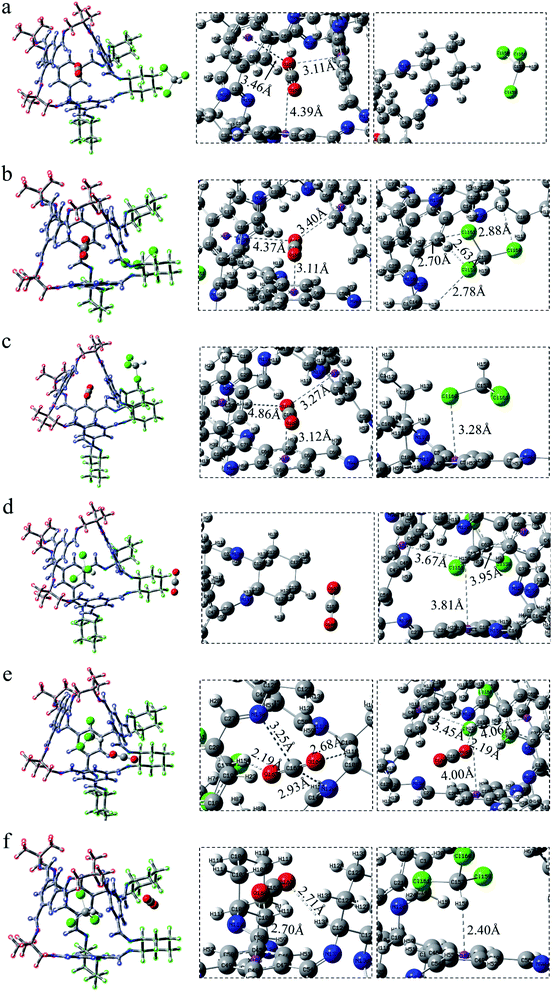
After exchanging the molecules in the cavity of the POC, CHCl3 lies in the cage (Fig. 3d–f). The main force between CHCl3 and the cavity is C–H⋯π. The shortest interaction distance is in Fig. 3f (2.25 Å) while the longest is in Fig. 3e (2.63 Å). The distance between C–H⋯π in Fig. 3d and f is close to that in Fig. S1b,† indicating that the force may be stronger. In Fig. 3d, CO2 has a weak hydrogen bond with the vertex O152⋯H93–C91 (2.70 Å). Also, there is a hydrogen bond O152⋯H71–C70 (2.72 Å) at the window between CO2 and the cage in COM-e. It is worth noting that there remain forces between CO2 and CHCl3, such as O151⋯H146–C145 (2.60 Å), C150⋯Cl149 (3.21 Å) and C150⋯Cl147 (3.21 Å). In Fig. 3f, the π–π interaction distance between CO2 and the benzene ring is 3.10 Å, which is almost equivalent to the parameter in Fig. S1a.† When CHCl3 lies in the cage, only the C–H in COM-e forms a hydrogen bond with CO2 and C–H⋯π interaction with the benzene ring. Hence, the C–H bond length in this structure is the largest (1.089 Å) according to Table 1. In a word, the more forces are, the greater the molecule will change. As expected, the change in the bond length and bond angle of CO2 in COM-e should be the largest.
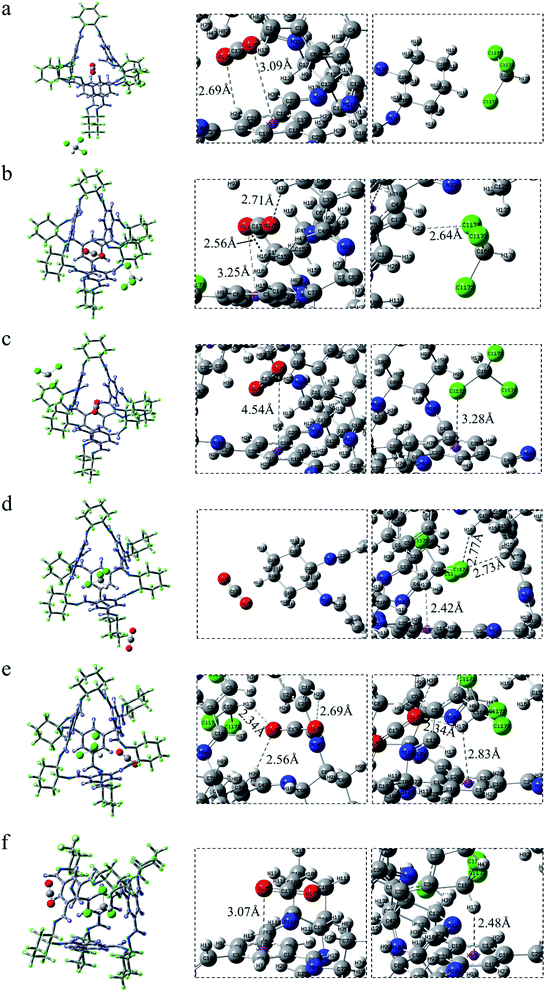
The positions of CHCl3 in the cage are almost indistinguishable after exchanging the molecules in the cavity of POC (Fig. 4d–f). It can be seen that the three chlorine atoms in chloroform all face three windows. From the perspective of interaction distance, the distance of C–H⋯π is greater than that in Cage 30136. But in Fig. 4d (ABS-d), compared with COM-d in Fig. 3d, CHCl3 has two more hydrogen bonds with the cage. In Fig. 4e, in ABS-e are three hydrogen bonds. It is noteworthy that one of them is the hydrogen bond between CO2 and CHCl3. In Fig. 4f (ABS-f), the possible interaction is the π–π interaction (3.07 Å) which is smaller than that in COM-f (3.10 Å). According to Table 1, the existence of C–H⋯π causes the C–H bond length to become longer. In ABS-e, the reason why the bond length and bond angle in CO2 changes drastically is that there remain atoms interacting with it.
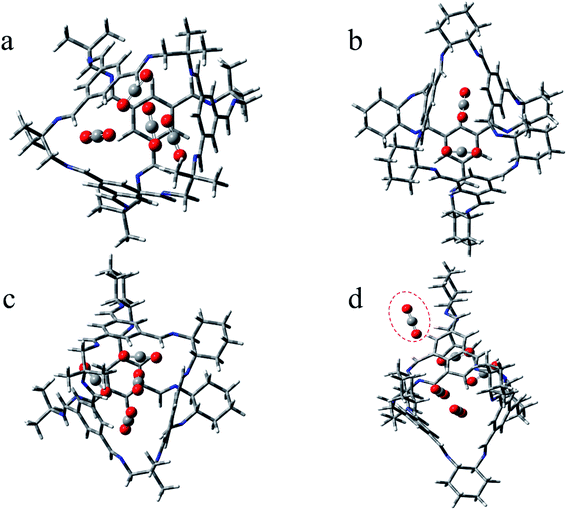
After CHCl3 is placed in the cage, it can be observed that the chlorine and H atoms of CHCl3 in Fig. 5d and e face four windows respectively. Although the interaction of C–H⋯π is relatively weak, there exist a few Cl⋯π interactions in this system, which are not drawn here. More details are described in the reduced density gradient analysis section. It is precisely because of these Cl⋯π actions that CHCl3 is more stable inside the cage. Similarly, the CO2 at the vertex in Fig. 5d has no hydrogen bond. In Fig. 5e, there are both electrostatic interaction and hydrogen bonding between CO2 and the cage, of which O163⋯H158–C162 (2.19 Å) seems stronger. In Fig. 5f, CO2 interacts with both the surface and the vertex.
In a word, what can be seen from the structural analysis is that carbon dioxide can be steady absorbed in the cages. However, chloroform lies in the cage more stable than carbon dioxide. What's more, different cages have different types of force. Due to the increased structural disorder, the interaction of the formed asymmetric cage (33133) seems to be stronger than that of the cage made of a single diamine (30136, 36130).
3.2 Energetics
| Complex | Interaction energy (ΔEabs) | Exchange energy (ΔEexc) |
|---|---|---|
| COM-b | −15.9 | −3.5 |
| COM-f | −19.4 | |
| ABS-b | −16.0 | −6.9 |
| ABS-e | −22.9 | |
| SYS-b | −16.2 | −7.4 |
| SYS-e | −23.6 |
For investigating the force between a single molecule and the cage more simply, six structures were made with carbon dioxide or chloroform in the cage. In Table 3, COM, ABS and SYS represent cage 30136, 36130, and 33133 respectively. The suffix indicates the single molecule in the cage. It can be observed that the interaction energy of CO2 in the cavity is much smaller than that of CHCl3. Moreover, the cavity of cage 33133 has the largest interaction energy for CO2 (−7.2 kcal mol−1), possessing the best adsorption capacity. In addition, the interaction between the three cages and chloroform is relatively strong.
| Complex | Interaction energy (ΔEabs) |
|---|---|
| COM–CO2 | −6.7 |
| COM–CHCl3 | −17.7 |
| ABS–CO2 | −7.1 |
| ABS–CHCl3 | −15.2 |
| SYS–CO2 | −7.2 |
| SYS–CHCl3 | −16.9 |
In summary, the interaction energy of chloroform in the cage is larger, indicating that CHCl3 tends to enter the cavity more than CO2, and consequently, CHCl3 can indeed substitute CO2. Additionally, the interaction energy at the vertex is the smallest while the energy at the window is the largest. According to Table 1, the interaction energy generally increases with the replacement of vertices. As a matter of fact, the cages prepared from a single diamine (like 30136, 36130) have a high degree of symmetry than such scrambled ones (such as 33133). After replacing the different vertices, the disorder of the system is increased. The interaction energy of the same sites increased because of Cage 33133 with structural disorder, indicating that it is beneficial for absorption of CO2 as the disorder of the cage are increased by changing the vertices of the cages.
| Complex | Interaction energy (ΔĒaver) |
|---|---|
| Cage 30136 | |
| CAP–COM-1 | −6.7 |
| CAP–COM-2 | −6.9 |
| CAP–COM-3 | −7.1 |
| CAP–COM-4 | −9.8 |
| CAP–COM-5 | −7.4 |
![[thin space (1/6-em)]](https://www.rsc.org/images/entities/char_2009.gif) |
|
| Cage 36130 | |
| CAP–ABS-1 | −7.1 |
| CAP–ABS-2 | −7.4 |
| CAP–ABS-3 | −5.3 |
| CAP–ABS-4 | −5.4 |
| CAP–ABS-5 | −5.2 |
![[thin space (1/6-em)]](https://www.rsc.org/images/entities/char_2009.gif) |
|
| Cage 33133 | |
| CAP–SYS-1 | −7.2 |
| CAP–SYS-2 | −7.4 |
| CAP–SYS-3 | −7.1 |
| CAP–SYS-4 | −9.5 |
| CAP–SYS-5 | −6.3 |
3.3 Analysis on the interaction nature of gas absorption
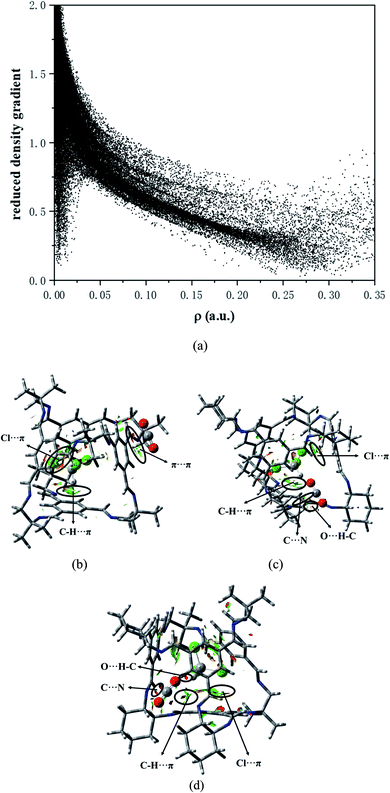
As depicted in Fig. 8b, in COM-f, CHCl3 lies in the cavity and CO2 is in the surface. What can be seen is that there is indeed C–H⋯π between the C–H and benzene ring in chloroform. The area corresponding to the interaction has both red and green, indicating that the interaction has a certain bonding effect. In addition, there remains a π–π interaction between the C![[double bond, length as m-dash]](https://www.rsc.org/images/entities/char_e001.gif) O double bond and the benzene ring. However, it is found that there is a red segment between the C in CO2 and the benzene ring. This is because the Mulliken charge of C in CO2 is positive, while the Mulliken charge of C on the benzene ring is positive. Therefore, there is a certain electrostatic effect between the two. Besides, there is a Cl⋯π interaction between the Cl atom and the benzene ring. Although C–Cl points to the window, between Cl and the benzene ring is a halogen bond. In Fig. 8c, on the one hand, there exists a strong electrostatic interaction between CO2 at the window and N atoms at the edge. The green segment at the window is a weaker hydrogen bond. On the other hand, there are C–H⋯π interactions and Cl⋯π interactions between CHCl3 in the cage and the cavity. Fig. 8d is the RDG diagram of SYS-e. It can be observed that carbon dioxide not only has a strong hydrogen bond with chloroform, but also has a hydrogen bond with the window, which is consistent with the previous structural analysis. Furthermore, C⋯N electrostatic interaction, C–H⋯π action and Cl⋯π action also exist in this structure. In short, RDG analysis shows that when CHCl3 is in the cage, there are C–H⋯π and Cl⋯π interactions between the chloroform and the cavity. When CO2 is located at the window, more atoms interact with it, which proves that the site has a stronger interaction.
O double bond and the benzene ring. However, it is found that there is a red segment between the C in CO2 and the benzene ring. This is because the Mulliken charge of C in CO2 is positive, while the Mulliken charge of C on the benzene ring is positive. Therefore, there is a certain electrostatic effect between the two. Besides, there is a Cl⋯π interaction between the Cl atom and the benzene ring. Although C–Cl points to the window, between Cl and the benzene ring is a halogen bond. In Fig. 8c, on the one hand, there exists a strong electrostatic interaction between CO2 at the window and N atoms at the edge. The green segment at the window is a weaker hydrogen bond. On the other hand, there are C–H⋯π interactions and Cl⋯π interactions between CHCl3 in the cage and the cavity. Fig. 8d is the RDG diagram of SYS-e. It can be observed that carbon dioxide not only has a strong hydrogen bond with chloroform, but also has a hydrogen bond with the window, which is consistent with the previous structural analysis. Furthermore, C⋯N electrostatic interaction, C–H⋯π action and Cl⋯π action also exist in this structure. In short, RDG analysis shows that when CHCl3 is in the cage, there are C–H⋯π and Cl⋯π interactions between the chloroform and the cavity. When CO2 is located at the window, more atoms interact with it, which proves that the site has a stronger interaction.
4. Conclusion
This work explores the mechanism of carbon dioxide capture and separation in porous liquids. Based on the analysis of structure, energy, ESP and RDG analysis, the following conclusions are drawn:(1) Structure analysis shows such kind of porous organic cage has a certain absorption capacity for CO2 through π–π interaction. Compared with CO2, chloroform is more stable inside the cage due to stronger C–H⋯π interactions and Cl⋯π interactions.
(2) In the energy analysis section, the conformations where chloroform lies inside the cage whereas CO2 stand outside the cage have the strongest interaction energy ranging from −17.0 to −23.6 kcal mol−1. Also, their exchange energy is negative, indicating that chloroform can displace carbon dioxide in the cage and eventually separate it. Combined with the interaction energy of single molecules, it is found that the scrambled cage 33133 possesses the strongest energy. As far as a single cage is concerned, the optimal CO2 absorption capacity of the cage 30136 and the cage 33133 is 4 eq. while the cage 36130 is 2 eq.
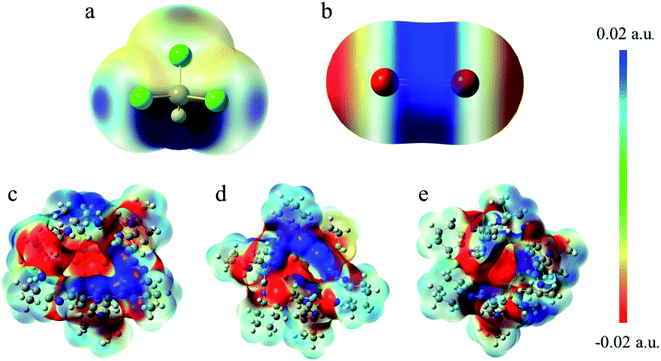
(3) The electrostatic potential analysis shows that when CO2 is located at the window, the interaction force is stronger. This is because the O atoms in the negatively charged region of CO2 tend to form hydrogen bonds with the H atoms in the positively charged region of the window.
(4) The RDG analysis shows that there exists weak interaction in the system. Furthermore, it is confirmed again that there are C–H⋯π and Cl⋯π interactions between chloroform and the cavity.
Conflicts of interest
The authors declared that they have no conflicts of interest to this work.Acknowledgements
This work was financially supported by the National Natural Science Foundation of China (No. 21808092, 21878133, 22078135), China Postdoctoral Science Foundation (2019M651742), the Science and Technology project of Southwest Guizhou Autonomous Prefecture (2019-2-51), and the Youth growth project of GuiZhou Provincial Educational Department (KY[2019]220). This research work is supported by the high performance computing platform of Jiangsu University.References
- Q. Wang and D. Astruc, Chem. Rev., 2020, 120, 1438–1511 CrossRef CAS.
- J. Yu, L. H. Xie, J. R. Li, Y. Ma, J. M. Seminario and P. B. Balbuena, Chem. Rev., 2017, 117, 9674–9754 CrossRef CAS.
- A. Torrisi, R. G. Bell and C. Mellot-Draznieks, Cryst. Growth Des., 2010, 10, 2839–2841 CrossRef CAS.
- A. Samanta, A. Zhao, G. K. H. Shimizu, P. Sarkar and R. Gupta, Ind. Eng. Chem. Res., 2011, 51, 1438–1463 CrossRef.
- J. G. Min, K. C. Kemp, H. Lee and S. B. Hong, J. Phys. Chem. C, 2018, 122, 28815–28824 CrossRef CAS.
- W. Jeong and J. Kim, J. Phys. Chem. C, 2016, 120, 23500–23510 CrossRef CAS.
- S. Zeng, X. Zhang, L. Bai, X. Zhang, H. Wang, J. Wang, D. Bao, M. Li, X. Liu and S. Zhang, Chem. Rev., 2017, 117, 9625–9673 CrossRef CAS.
- M. Pan and C. Wang, ACS Symp. Ser., 2015, 1194, 341–369 CrossRef CAS.
- J. F. Brennecke and B. E. Gurkan, J. Phys. Chem. Lett., 2010, 1, 3459–3464 CrossRef CAS.
- M. Ramdin, T. W. de Loos and T. J. H. Vlugt, Ind. Eng. Chem. Res., 2012, 51, 8149–8177 CrossRef CAS.
- H. Liu, J. Huang and P. Pendleton, ACS Symp. Ser., 2012, 1097, 153–175 CrossRef CAS.
- J. Wang, Z. Song, H.-Y. Cheng, L. Chen, L. Deng and Z. Qi, ACS Sustainable Chem. Eng., 2018, 6, 12025–12035 CrossRef CAS.
- N. O'Reilly, N. Giri and S. L. James, Chem.–Eur. J., 2007, 13, 3020–3025 CrossRef.
- J. Zhang, S. H. Chai, Z. A. Qiao, S. M. Mahurin, J. Chen, Y. Fang, S. Wan, K. Nelson, P. Zhang and S. Dai, Angew. Chem., Int. Ed., 2015, 54, 932–936 CrossRef CAS.
- K. Jie, N. Onishi, J. A. Schott, I. Popovs, D. E. Jiang, S. Mahurin and S. Dai, Angew. Chem., Int. Ed., 2020, 59, 2268–2272 CrossRef CAS.
- L. Ma, C. J. E. Haynes, A. B. Grommet, A. Walczak, C. C. Parkins, C. M. Doherty, L. Longley, A. Tron, A. R. Stefankiewicz, T. D. Bennett and J. R. Nitschke, Nat. Chem., 2020, 12, 270–275 CrossRef CAS.
- N. Giri, M. G. Del Pópolo, G. Melaugh, R. L. Greenaway, K. Rätzke, T. Koschine, L. Pison, M. F. C. Gomes, A. I. Cooper and S. L. James, Nature, 2015, 527, 216–220 CrossRef CAS.
- M. Costa Gomes, L. Pison, C. Cervinka and A. Padua, Angew. Chem., Int. Ed., 2018, 57, 11909–11912 CrossRef CAS.
- J. Cahir, M. Y. Tsang, B. Lai, D. Hughes, M. A. Alam, J. Jacquemin, D. Rooney and S. L. James, Chem. Sci., 2020, 11, 2077–2084 RSC.
- W. Shan, P. F. Fulvio, L. Kong, J. A. Schott, C. L. Do-Thanh, T. Tian, X. Hu, S. M. Mahurin, H. Xing and S. Dai, ACS Appl. Mater. Interfaces, 2018, 10, 32–36 CrossRef CAS.
- R. L. Greenaway, D. Holden, E. G. B. Eden, A. Stephenson, C. W. Yong, M. J. Bennison, T. Hasell, M. E. Briggs, S. L. James and A. I. Cooper, Chem. Sci., 2017, 8, 2640–2651 RSC.
- N. Giri, C. E. Davidson, G. Melaugh, M. G. Del Pópolo, J. T. A. Jones, T. Hasell, A. I. Cooper, P. N. Horton, M. B. Hursthouse and S. L. James, Chem. Sci., 2012, 3, 2153 RSC.
- R. J. Kearsey, B. M. Alston, M. E. Briggs, R. L. Greenaway and A. I. Cooper, Chem. Sci., 2019, 10, 9454–9465 RSC.
- G. Melaugh, N. Giri, C. E. Davidson, S. L. James and M. G. Del Pópolo, Phys. Chem. Chem. Phys., 2014, 16, 9422–9431 RSC.
- T. Tozawa, J. T. Jones, S. I. Swamy, S. Jiang, D. J. Adams, S. Shakespeare, R. Clowes, D. Bradshaw, T. Hasell, S. Y. Chong, C. Tang, S. Thompson, J. Parker, A. Trewin, J. Bacsa, A. M. Slawin, A. Steiner and A. I. Cooper, Nat. Mater., 2009, 8, 973–978 CrossRef CAS.
- F. Zhang, F. Yang, J. Huang, B. G. Sumpter and R. Qiao, J. Phys. Chem. B, 2016, 120, 7195–7200 CrossRef CAS.
- H. Li, Y. Chang, W. Zhu and C. Wang, Phys. Chem. Chem. Phys., 2015, 17, 28729–28742 RSC.
- H. Li, Y. Chang, W. Zhu, W. Jiang, M. Zhang, J. Xia, S. Yin and H. Li, J. Phys. Chem. B, 2015, 119, 5995–6009 CrossRef CAS.
- J. Zhang, N. Lv, Y. Chao, L. Chen, W. Fu, J. Yin, H. Li, W. Zhu and H. Li, J. Mol. Graphics Modell., 2020, 100, 107694 CrossRef CAS.
- K. D. Vogiatzis, W. Klopper and J. Friedrich, J. Chem. Theory Comput., 2015, 11, 1574–1584 CrossRef CAS.
- H. Li, B. Zhang, W. Jiang, W. Zhu, M. Zhang, C. Wang, J. Pang and H. Li, Green Energy Environ., 2019, 4, 38–48 CrossRef.
- W. Jiang, H. Jia, H. Li, L. Zhu, R. Tao, W. Zhu, H. Li and S. Dai, Green Chem., 2019, 21, 3074–3080 RSC.
- M. J. Frisch, G. W. Trucks, H. B. Schlegel, G. E. Scuseria, M. A. Robb, J. R. Cheeseman, et al., Gaussian 16, Gaussian, Inc., Wallingford, CT, USA, 2016 Search PubMed.
- R. F. W. Bader, M. T. Carroll, J. R. Cheeseman and C. Chang, J. Am. Chem. Soc., 1987, 109, 7968–7979 CrossRef CAS.
- P. Politzer, J. S. Murray and T. Clark, Phys. Chem. Chem. Phys., 2010, 12, 7748–7757 RSC.
- G. Cavallo, P. Metrangolo, R. Milani, T. Pilati, A. Priimagi, G. Resnati and G. Terraneo, Chem. Rev., 2016, 116, 2478–2601 CrossRef CAS.
- H. Wang, W. Wang and W. J. Jin, Chem. Rev., 2016, 116, 5072–5104 CrossRef CAS.
- P. Politzer, J. S. Murray and T. Clark, Phys. Chem. Chem. Phys., 2013, 15, 11178–11189 RSC.
- J. S. Murray, P. Lane, T. Clark, K. E. Riley and P. Politzer, J. Mol. Model., 2012, 18, 541–548 CrossRef CAS.
- Z. P. Shields, J. S. Murray and P. Politzer, Int. J. Quantum Chem., 2010, 110, 2823–2832 CrossRef CAS.
- E. R. Johnson, S. Keinan, P. Mori-Sánchez, J. Contreras-García, A. J. Cohen and W. Yang, J. Am. Chem. Soc., 2010, 132, 6498–6506 CrossRef CAS.
- T. Lu and F. Chen, J. Comput. Chem., 2012, 33, 580–592 CrossRef CAS.
Footnote |
| † Electronic supplementary information (ESI) available. See DOI: 10.1039/d0ra08039j |
| This journal is © The Royal Society of Chemistry 2020 |

