 Open Access Article
The sensitive detection of methylene blue using silver nanodecahedra prepared through a photochemical route
Xuan Hoa Vu a,
Nguyen Dac Dienb,
Thi Thu Ha Pham*c,
Tran Thu Tranga,
N. X. Ca
 a,
P. T. Tho
 a,
Nguyen Dinh Vinhc and
Phan Van Dod
aFaculty of Physics, TNU-University of Sciences, Tan Thinh ward, Thai Nguyen city, Vietnam. E-mail: hoavx@tnus.edu.vn
bFaculty of Labour Protection, Vietnam Trade Union University, 169 Tay Son street, Hanoi city, Vietnam
cFaculty of Chemistry, TNU-University of Sciences, Tan Thinh ward, Thai Nguyen city, Vietnam. E-mail: haptt@tnus.edu.vn
dThuyloi University, 175 Tay Son, Dong Da, Hanoi, Vietnam
First published on 23rd October 2020
Abstract
In this work, we have carried out systematic studies on the critical role of polyvinyl pyrrolidone (PVP) and citrate in the well-known chemical reduction route to synthesize silver nanodecahedra (AgND). Silver nitrate (AgNO3) was used as silver source, which can be directly converted to metallic silver after being reduced by sodium borohydride (NaBH4) under blue light-emitting diode (LED) irradiation (λmax = 465 nm), and polyvinyl pyrrolidone (PVP) as a capping agent to assist the growth of AgND. The obtained products were silver nanodecahedra of excellent uniformity and stability with high efficiency and yield. The results showed that PVP acted as a capping agent to stabilize the silver nanoparticles, prolonging the initiation time required for nanodecahedra nucleation, thus inducing anisotropic growth, allowing the size and morphology of the AgND to be controlled successfully. This improved understanding allows a consistent process for the synthesis of AgND with significantly enhanced reproducibility to be developed and the formation mechanism of these nanostructures to be elucidated. This is a simple, cost-effective and easily reproducible method for creating AgND. The typical absorption maxima in the UV-vis spectroscopy of Ag seeds was λmax ∼400 nm and that of AgND was λmax ∼480 nm. The size of the prepared AgND was in the range of 60–80 nm. SEM images confirmed the uniform and high density of AgND when the concentration of PVP was 0.5 mM. The XRD pattern showed that the final product of AgND was highly crystallized. In addition, the prepared AgND can be used to detect methylene blue (MB) in a sensitive manner with good reproducibility and stability using Surface-Enhanced Raman Scattering (SERS) phenomenon. Out of the obtained products, the AgND prepared with 50 min blue LED light irradiation (AgND-50) displayed the strongest SERS signal. Interestingly, MB in diluted solution can be detected with a concentration as low as 10−7 M (the limit of detection, LOD) and the linear dependence between SERS intensity and the MB concentration occurred in the range from 10−7 to 10−6 M. The enhancement factor (EF) of the SERS effect was about 1.602 × 10⁶ with a MB concentration of 10−7 M using 532 nm laser excitation.
1. Introduction
Among silver-based nanomaterials, silver nanodecahedra are three-dimensional plasmonic nanostructures that have attracted the continued and considerable interest of the scientific community for the last few decades owing to their Surface-Enhanced Raman Scattering (SERS) and related applications, especially in detecting methylene blue (MB) or Rhodamine 6G (R6G) in waste water.1,2 They display this unique property along with decreasing size of structural units.3 These small structures possess a very high surface to volume ratio and have distinct characteristics with applications in different fields where high surface areas are critical. The degree of anisotropy of this type of nanostructure is clear at the vertices, which favors localized surface plasmon resonance (LSPR) and generates high electromagnetic-field enhancement.4 In plasmonics, metal nanostructures can serve as antennas to route light to desired locations with nanometer precision.5 LSPR occurs through a strong interaction between incident light and free electrons in the nanostructures. Therefore, many groups developed a variety of solution-based strategies to synthesize silver nanodecahedra, including photochemical process,6–8 chemical reduction under the assistance of large-molecular-mass surfactants,9 photoassisted chemical reduction,10,11 seed-mediated plasmon-driven regrowth,12 shape evolution in DMF (dimethylformamide, (CH3)2N–CHO) solution13 or in the presence of polyvinyl alcohol (PVA, (C2H4O)n),14 etc. Recently, there has been remarkably rapid progress in the development of photocatalytic reactions sensitized by high-brightness light-emitting diodes (LEDS).4 Researchers used LED lamps (blue LED or green LED, depending on the wavelength) and halide lamp as light sources to irradiate into the reacting solution in order to control the morphology, size and optical properties of silver nanoparticles.6,9 The wavelength, time and intensity of the light irradiation can effect the morphology and size of silver product.15,16 This synthesis route has been gaining increased attention because of its ease of preparation, high yield, simple setups and promises the large-scale production.5 Due to the desire to minimize the surface area and energy, the formation of polyhedrons such as nanodecahedra,10 dodecahedra,17 icosaheral18 or octahedra19 is thermodynamically favored comparing to the extremely anisotropic silver nanoplates (nanoprisms or nanodisks).13 Many hypotheses have been proposed to explain the formation mechanism of nanodecahedral structures, where the polyvinyl pyrrolidone (PVP) as a capping agent played an essential role.6 The selective adhesion of capping ligands to a particular crystal facet of the growing nanocrystal is dependent on the crystal symmetry of the starting nuclei.20 Each reagent such as citrate or PVP plays a critically important role in determining the structure of seeds and their growth process has been attributed to the presence of various chemical species or reaction conditions, containing seed concentration, surfactants, pH value, reaction temperature.8,14 The growth mechanism of metal nanoparticles still remains an area of great research potential. LED is more efficient than traditional lamps due to its narrow-band emission, high intensity and low energy consumption.17 Due to the advances in the application of LEDs as the source of excitation light in photocatalytic reactions, we have studied the synthesis of silver nanodecahedra (AgND) using blue LED light.SERS offers a potential technique for non-destructive detection with extremely low detecting limitation and is capable of qualitative and quantitative analysis.21 The mechanism for the enhancement effect of SERS on the noble metal proposes the enhancement of local electromagnetic field of free electrons, so the scattering cross section of target molecules locating on the surface of the metal can be enhanced.22 The enormous enhancement in SERS can be attributed to two mechanisms. The chemical mechanism arises from interactions between the molecule and the nanoparticle leading to the charge transfer between the probe molecule and the nanoparticle. The electromagnetic mechanism is thought to contribute most of the enhancement, much larger than the chemical enhancement, where light is focused into tiny volumes of sharp features on nanostructures.5 Both of shape and size affect SERS enhancement, beside composition and excitation polarization.23 Shan-Wei Lee et al. used plasmon-mediated method under the irradiation of green LED to prepare Ag nanodecahedra which exhibited good SERS activities for R6G.6 Agnese D'Agostino et al. synthesized silver nanoplates for the detection of thiram fungicide by SERS.24 SERS can signal the presence of chemical species by the vibrational fingerprint and has been applied in materials science, biomedical imaging and food safety.25–27 Methylene Blue (MB) is a dark green powder with the molar weight of 373.9 g mol−1. It is a water soluble powder and has a deep blue color in solution in water. MB is a cationic dye and is extensively applied in industries, household products and the treatments of many diseases.28 Because of the biological and industrial importance of MB, much attention has been devoted to develop methods to detect this dye.29,30
In this work, we present a comprehensive study to obtain silver nanodecahedra (AgND) in the chemical reduction route under the assistance of PVP and blue LED. This understanding allows us to produce AgND in an efficient and reproducible process with desired surface plasmon resonance bands. The results showed that citrate reduced Ag+ ion into the metallic silver (Ag0) to form silver nuclei as long as the silver is in cationic form before reduction occurs and single PVP ligand was the most essential component in producing high-quality AgND with high yield in a stable colloidal form. In addition, NaBH4 acted as a reducing agent and a capping agent contributing to the nanostructure evolution, while blue LED light activated the AgND synthesis. The main objective of the present research is synthesis of AgND from silver salt in the presence of PVP and blue LED. After irradiation for 50 min, we obtained the high-yield decahedral silver nanoparticles with a fairly narrow size distribution of about 50–80 nm. Besides, the obtained AgND have highly sharp edge and vertices which can be promising SERS substrates for sensing application in detecting methylene blue (MB). However, a thin layer of PVP molecules will reside on the surface of the as-prepared AgND which may reduce the active surface area available for the adsorption of analytic molecules onto the metal surface.
2. Experimental section
Silver nitrate (AgNO3, 99.92% pure) was used as silver source, polyvinyl pyrrolidone (PVP, molar weight MW = 29![[thin space (1/6-em)]](https://www.rsc.org/images/entities/char_2009.gif) 000 g mol−1) as capping agent, sodium citrate tribasic dihydrate (TSC, Na3C6H5O7·2H2O, 99.96% pure) as reducing chemical, sodium borohydride (NaBH4, 99.93% pure) as both reducing and capping agents, KBr and methylene blue (MB, C16H18ClN3S) were all purchased from Sigma-Aldrich Chemical Co. (USA). All chemicals were of analytical reagents grade and used as received without further treatment. Deionized water used for all solution preparation throughout all experiments was obtained with Millipore purification system. Glassware was cleaned with double distilled water carefully before use. A blue light-emitting diode (blue LED) with an emission peak at 465 nm was purchased from RS components (United Kingdom).
000 g mol−1) as capping agent, sodium citrate tribasic dihydrate (TSC, Na3C6H5O7·2H2O, 99.96% pure) as reducing chemical, sodium borohydride (NaBH4, 99.93% pure) as both reducing and capping agents, KBr and methylene blue (MB, C16H18ClN3S) were all purchased from Sigma-Aldrich Chemical Co. (USA). All chemicals were of analytical reagents grade and used as received without further treatment. Deionized water used for all solution preparation throughout all experiments was obtained with Millipore purification system. Glassware was cleaned with double distilled water carefully before use. A blue light-emitting diode (blue LED) with an emission peak at 465 nm was purchased from RS components (United Kingdom).
A typical procedure of fabricating the AgND is described as follows: 1 ml aqueous AgNO3 solution (0.01 M), 0.2 ml trisodium citrate solution (TSC, 0.3 M), 0.3 ml PVP solution with various concentrations of 0.1 mM, 0.3 mM, 0.5 mM, 0.8 mM, 1 mM and 2 mM were combined with deionized water in a glass beaker to the total volume of the reaction solution of 100 ml. Then, the mixed solution was vigorously stirred on a magnetic stirrer at 1500 revolution per minute (rpm) at ambient temperature in air for 10 min to form a homogeneous solution, followed by gradually injecting 0.5 ml sodium borohydride solution (NaBH4, 0.05 M) into this mixture to initiate the reduction. The molar ratio of NaBH4 to AgNO3 was kept at 2.5. The reaction beaker was chilled in an ice-cold water bath under continuously stirring for 1 h. At the very beginning of the reaction, the mixture was almost colorless because the four initial chemical reagents are all colorless. After the addition of NaBH4, the mixture immediately turned light-yellow after about 3 min then changed to pale yellow after about 30 min, which is the typical color for spherical silver seed colloids. PVP was added to the original reaction mixture to narrow the seed size distribution and enhance their stability, where PVP formed a self-assembly monolayer on the silver seeds that protected the surface from dissolution and avoided shape transformation. These Ag seeds were further evaluated for their Particle Size Distribution (PSD). The resulting yellow colloidal solution was used as a feedstock of silver cations for the photochemical reaction in the next step. For photo-synthesis, the colloidal silver seeds solution was exposed to the blue LED light (λmax = 465 nm) at room temperature for different time intervals of 15, 25, 40, 50, 60, and 70 minutes. The solution and LEDs were assembled on a cylindered reaction pot. The various irradiation powers of 1.2, 4 and 9 mW cm−2 were obtained by controlling the distance between the reduced solution and the LED. The color of the reaction solution gradually changed from pale yellow to reddish-brown. Finally, the AgND were washed by repeated centrifugation at 13![[thin space (1/6-em)]](https://www.rsc.org/images/entities/char_2009.gif) 000 rpm for 10 min. The diameter of AgND was obtained from a hypothetical circle that minimally covers their entire area for convenience.
000 rpm for 10 min. The diameter of AgND was obtained from a hypothetical circle that minimally covers their entire area for convenience.
The morphological shape and size of AgND were examined with field emission scanning electron microscopy (FESEM, Hitachi S4800, Japan) operating under high vacuum at an acceleration voltage of 10 kV, transmission electron microscopy (TEM, JEOL JEM-1010) operating at 100 kV, and high-resolution TEM (HRTEM) image was taken at an acceleration voltage of 200 kV. Before being analyzed by TEM and SEM, a drop of silver colloids was placed onto a carbon-coated copper grid and left to dry in air at room temperature. Images were registered with the backscattered electrons mode (BSE) and using secondary electron detector to gain higher spatial resolution.
PSD was determined based on the dynamic light scattering (DLS) of red laser having wavelength 750 nm using Particle Size Analyzer (PSA, Delta NanoC, Beckman). The laser light was allowed to pass through the samples in liquid sampler and was scattered due to Brownian motion of the colloidal Ag seeds. The crystalline nature and crystal structure of the synthesized samples was identified through X-ray powder diffraction (XRD) measurements carried out on a Bruker D8 Advance diffractometer, wherein a copper X-ray tube emitted Cu-Kα radiation (wavelength of λ = 1.5406 Å) with a scanning angle 2θ in the range of 30–80° and a scanning speed of 0.02° s−1. The sample was deposited onto a glass slide. The elemental composition analysis was performed by means of energy dispersive X-ray spectroscopy (EDS, Nova 450). The optical property and the shape evolution of AgND was monitored by recording their time-dependent ultraviolet-visible (UV-vis) extinction spectra using UV-vis spectrophotometer (JASCO V770, Japan) in the wavelength of 250–800 nm. 1 ml of colloidal solution was drawn out every 10–15 min to determine the absorption maxima of synthesized silver nanoparticles. All UV-vis extinction spectra were recorded at 25 °C using a quartz cuvette with an optical path of 10 mm.
The functional group present in the silver nanoparticles was identified using Fourier transform infrared spectrometer (FTIR, JASSCO 4600, Japan). The colloidal silver nanoparticles were dried, mixed with anhydrous KBr in 1![[thin space (1/6-em)]](https://www.rsc.org/images/entities/char_2009.gif) :
:![[thin space (1/6-em)]](https://www.rsc.org/images/entities/char_2009.gif) 20 molar ratio and pressed to make a pellet. The absorption frequency in FTIR ranged from 4000 cm−1 to 500 cm−1 and wavenumber resolution of 2 cm−1.
20 molar ratio and pressed to make a pellet. The absorption frequency in FTIR ranged from 4000 cm−1 to 500 cm−1 and wavenumber resolution of 2 cm−1.
The AgND were washed with bidistilled water to remove the possible impurities adorbed on their surface before SERS measurement. PVP molecules might result in unwanted impurity peaks in the desired SERS spectra or obstruct the adsorption of MB onto the AgND surfaces, so the AgND in the absence of PVP and surfactants would have larger approachable surface and fewer limitation for SERS application. Then the AgND were dispersed on Si substrates before the Surface-Enhanced Raman Scattering (SERS) responses were determined. Methylene Blue (MB) was chosen as the target molecule to study SERS performance. In order to make aqueous solutions of MB with different concentrations, we prepared an aqueous solution of MB with a high concentration of 10−4 M. A required volume of deionized water was poured into the beaker containing the weighted MB powder, then the stock solution was stirred with a magnetic stirrer to obtain a uniform solution. MB was consecutively diluted in water to prepare different concentrations of MB solution (10−4 M, 10−5 M, 10−6 M, 8 × 10⁻⁷ M, 6 × 10⁻⁷ M, 4 × 10⁻⁷ M, 2 × 10⁻⁷ M, 10−7 M, and 10−8 M). Firstly, 50 μl AgND colloid was spread onto a 1 cm2 Si substrate, then Si substrate was dipped into the MB solution with a concentration in the range of 10−8 M to 10−4 M for 30 min. After that, the AgND and MB-coated Si substrate was taken out and then dried in air before SERS experiment. SERS spectra were recorded using a Raman microscope (Horiba XploRA PLUS), which was equipped with a solid state excitation laser source (Nd:YAG) with line filter at 532 nm, coupled with a liquid-nitrogen-cooled charge-coupled device (CCD) detector. The excitation wavelength of 532 nm provided the highest enhancement of the SERS performance based on silver substrate24 and the recorded Raman spectra possesses high signal-to-noise ratio (SNR).31 The incident laser power was kept at 30 mW and total accumulation time for each SERS spectrum of 40 s was employed. The spectra were measured in the range from 300 cm−1 to 2000 cm−1. For each sample, we collected four SERS spectra in randomly different locations of the SERS substrate then averaged them to reduce random errors. The acquisition time in each spectrum was typically 10 s. All experimental measurements were performed at room temperature.
3. Results and discussion
3.1. Characterization of Ag seeds
In the direct chemical reduction route, Ag nanodecahedra are typically prepared by reducing an aqueous solution of AgNO3 with NaBH4 in the presence of TSC and PVP. At the initial stage, only quasi-spherical silver nanoparticles can be obtained as indicated by the yellow color of as-prepared colloids (Fig. 1a), which has also been confirmed by TEM characterization (Fig. 1b). The originally colorless solution became light yellow suggesting the reduction of silver. NaBH4 is a strong reducing agent to reduce Ag+ ions to form crystal nucleus from the very beginning of the reaction as following:1| 2AgNO3 + 2NaBH4 → 2Ag↓ + H2↑ + 2BH3 + 2NaNO3 | (1) |
 | ||
| Fig. 1 (a) Digital photograph of colloidal Ag seeds solution, (b) TEM image of silver seeds, (c) DLS histogram interprets the size distribution of silver seeds. | ||
The dissolved Ag+ ions were reduced to Ag atoms, which grow into small clusters through the outgrowth of the petals and eventually nanostructures.32 The formation of AgND is generally affected by polymers and surfactants.33 PVP is used to stabilize the nanostructures during and after formation and they can play the role as a protecting agent and a structure-directing agent to direct particle growth to the desired shapes.34 Small silver nanoparticles formed are stabilized by the adsorption of PVP molecules on the surface through Ag:O coordination35 against ripening, so the extensive growth of the Ag seeds to larger particles is inhibited. PVP molecules can slow down the reaction owing to their adsorption onto the initial silver nuclei. Therefore, silver stays in the form of small nanoparticles which appear light yellow in color. Ag seeds allow the production of silver nuclei with the protection of PVP molecules because the majority of the surface is capped by ligands. PVP improved the size distribution of Ag nanoparticles, the size limiting effect of PVP as a surfactant leaded to the narrow size distribution of the product. Citrate serves as a shape-directing agent and stabilizer and has been considered an essential component. The TEM image indicates that Ag particles with almost uniform structure and a diameter of about 6 nm can be produced by this process (Fig. 1b). DLS technique is used to measure the size distribution of colloidal suspensions. Fig. 1c shows the histogram of the diameter distribution of the Ag seeds and confirms the polydispersity of the Ag seeds. The width of the histogram interval is 1 nm from 2 to 12 nm and the average diameter of the Ag seeds is determined to be 6 nm. The average DLS size of the Ag seeds is in good agreement with the TEM image.
3.2. Structure and morphology analysis of AgND
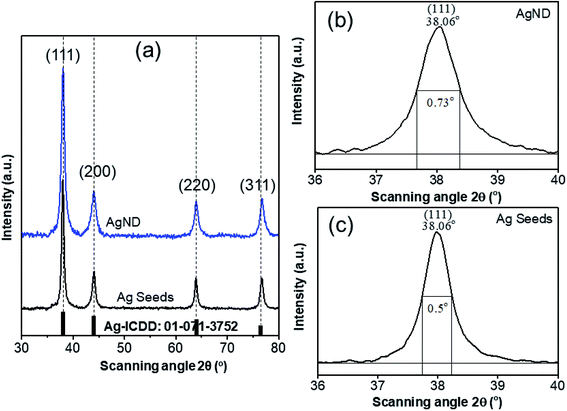
The phase structure of the products was characterized by X-ray powder diffraction (XRD) patterns. The four strong peaks in the XRD patterns (Fig. 2a) of the as-prepared Ag seeds and nanodecahedra at 2θ of 38.06°, 44.03°, 63.95°, and 76.78° were indexed to the reflections from the (111), (200), (220), and (311) Bragg crystal planes of the face-centered-cubic (FCC) Ag phase, respectively, which is consistent with the standard data file ICDD (International Cetre for Diffraction Data) no. 01-071-3752. It is worth noting that the four diffraction peaks obtained from AgND are similar to peaks from Ag seeds, indicating that both products are well-crystallized and polycrystallinity structure.All diffraction peaks are almost identical, which implies that Ag seeds didn't grow anisotropic along a certain crystal plane, but assembled into more complex structure. The dominant diffraction peak corresponds to the (111) plane of FCC Ag phase and limited diffractions from (200), (220) and (311) planes suggests that the (111) plane is the predominant orientation. One can see the preferable growth direction is (111) plane when applying the proper surfactant (PVP) during the growth of AgND. The ratio of intensity between (111) and (200) peaks reveals a relatively high value of 3 compared to the theoretical ratio value of 2.5,36 which indicates the enhancement of {111} crystalline planes in the AgND. The diffraction peaks are broad and smooth, while their full width at half-maximum (FWHM) reduced with the irradiation time, and Debye–Scherrer equation37 predicts that the average crystalline sizes of Ag seeds and AgND are 11.42 nm and 16.67 nm, respectively (Fig. 2b). In addition, no impurity element peaks are identified, indicating the elevated purity of the silver samples.
The lattice resolved TEM image taken on a single Ag unit was used to calculate the lattice parameters. Fig. 3a reveals fringes with a separated spacing of about 0.234 nm, which can be assigned to the spacing distance dhkl of the {111} plane, consistent with lattice fringe spacing of face-centered cubic (FCC) Ag.1 This information suggests that the Ag particles were single crystalline and the lattice constants are calculated according to the spacing distance dhkl of the {111} planes and the equation:33
 | (2) |
This calculated lattice constant is very close to a = 0.4053 nm, agreeing with the literature value.38
If the amount of secondary phase is below the detection limit imposed by the XRD analysis (≈3%), it is impossible to confirm the purity of these samples. Therefore, energy dispersive X-ray spectroscopy (EDS) measurement was employed to obtain information on the composition in the final products. Fig. 3b displays EDS spectrum acquired from the silver nanodecahedra sample after 70 min blue LED irradiation. Only silver peaks are noted in the spectrum, showing that only Ag elements are detected, proving the product is pure silver. The AgND prepared at different reaction times show similar EDS spectra.
Time-dependent growth of the AgND from the initiation of the synthesis was monitored by observing the SEM images of the silver nanostructures from reaction solution taken at different reaction times. SEM images in Fig. 4 shows the morphologies and sizes of the products obtained from 15 to 70 min blue LED irradiation when the concentration of PVP as 0.1 mM. With the reaction time increasing to 15 min and 25 min, a lot of Ag nanodecahedra and Ag triangular nanoplates appeared in the solution (Fig. 4a and b). As evidenced by the SEM image shown in Fig. 4a–f, the as-obtained product was a mixture of truncated triangular nanoplates and nanodecahedra with a nanodecahedra yield increasing with illuminating time. As the reaction proceeded, the proportion of AgND increased at the expense of the smaller particles as a function of time, indicating the possibility of Ostwald ripening. These results clearly suggest that PVP can promote the formation of decahedral structures. When the irradiation time of blue LED into the reaction was prolonged to 70 min, AgND with high yield and great uniformity can be obtained, as shown in Fig. 4f. The average edge length of AgND increase from 50 nm to 80 nm when the irradiating time of blue LED increases from 15 min to 70 min. The reaction was completed at 70 min, which was proved by the high proportion of AgND (more than 85%) with remainder being silver nanoplates and other types of polyhedrons as shown in the SEM image (Fig. 4f). The SEM images at each synthesis stage are in very good agreement with the following UV-vis spectroscopic observation. These results clearly indicate that the blue LED light enhances the transformation from nanoparticles to nanodecahedra which are more stabilized particles. The SEM images and XRD patterns proved that AgND had been successfully fabricated through photochemical reaction.
 | ||
| Fig. 4 SEM images of AgND after irradiating blue LED for (a) 15 min, (b) 25 min, (c) 40 min, (d) 50 min, (e) 60 min, (f) 70 min. | ||
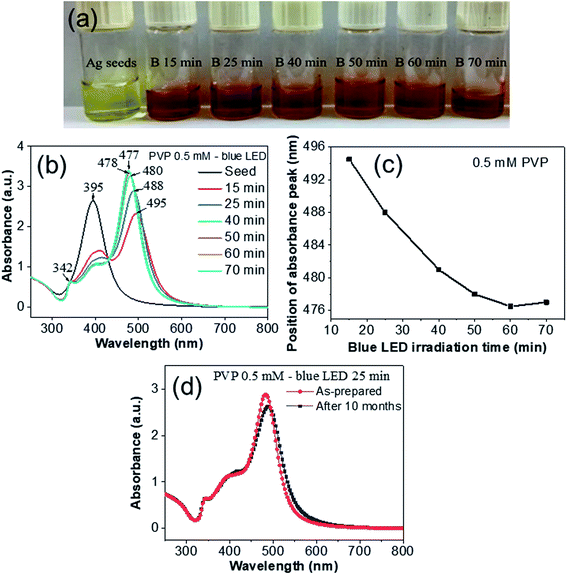
The reduction of Ag+ ions to Ag0 in the presence of blue LED light presented a reddish-brown color of the reaction mixture. The color change that accompanied this reduction can be seen with the naked eye. The reduction completed after 70 min illumination and the color of the solution did not change further (Fig. 5a). The UV-vis spectroscopic method can be used to track the morphological evolution involved in the growth process because silver nanostructures having different shapes and sizes exhibit different SPR bands. Fig. 5b shows the variation of the UV-Vis absorption spectra of Ag seeds or nanodecahedra at various blue LED irradiation times from 15 to 70 min. At the initial stage, the yellow color of the reaction solution implied that Ag+ ions were coordinated with the PVP molecules. The peak at 278 nm could be attributed to the absorption of the complex of Ag+ ions and PVP molecules. The UV-vis spectrum of the colloidal Ag seeds before the light irradiation revealed an absorption peak at λmax = 395 nm, which can be assigned to the out-of-plane dipole resonance of the Ag nanoparticles. This strong single plasmon band in the extinction spectrum is a distinctive feature typical of isotropic silver nanoparticles, which indicated the formation of spherical Ag seeds with small diameter, agreeing with Mie scattering theory.39,40 These seeds were formed through homogeneous nucleation with diameter smaller than 10 nm. The localized surface plasmon resonance (LSPR) of spherical Ag nanoparticles41 is due to the periodic change in electron density at the surface (surface plasmon absorption). Surface Plasmon Resonance (SPR) is the resonant oscillation of conduction electrons at the surface of metal stimulated by incident light. The surface plasmon polariton modes are electromagnetic waves coupled to the collective oscillations of free electrons in the metal.42 In the localized surface plasmons (LSPs), the time-varying electric field associated with the incident light exerts a force on the negatively charged electrons in the metal surface and drives them to oscillate collectively. If the excitation frequency of the incident light is in resonance with this collective oscillation, the oscillation of the surface electrons will become strong, commonly known as a LSPR mode.43 The dimensions of the structures that support LSPR are much smaller than the wavelength of the light. Plasmonics requires a coupling between an electromagnetic wave and the metal nanostructures to generate a surface plasmon. At the LSPR frequencies, metal nanostructures exhibit strong absorption resulting in peaks in the extinction spectrum. The specific location and strength of these peaks depend strongly on the morphological feature of the nanostructure, so the extinction spectrum can evaluate the size, shape, and uniformity of plasmonic nanostructures.34 When blue LED light was irradiated into the reaction solution, the yellow color turned into red with two absorption peaks in the UV-vis spectra at 400 nm and 500 nm (Fig. 5b). Blue LED has a wavelength of 465 nm close to the SPR of decahedral silver nanoparticles (ca. 490 nm).9 A strong peak centered 495 nm appeared, implying the formation and growth of silver nanodecahedra because this peak was attributed to the longitudinal dipolar SPR mode of the silver decahedra according to the assignment in the previous study.44 The intensity of 400 nm peak gradually shrank as the irradiating time of blue LED was increased up to 70 min, indicating the consumption of spherical nanoparticles during the reaction. The shoulder around 400–410 nm can be assigned to the transverse dipolar SPR mode of the AgND. The rapid enhancement of the peak intensity at ∼500 nm implies that the number of AgND grows quickly. Since the decahedral silver nanoparticles have a shorter SPR wavelength than silver nanoplates, the peak at 495 nm blue-shifted to 477 nm implying that the shape conversion from nanoplates to nanodecahedra. A light source with a short wavelength (blue LED 465 nm) should be more suitable for producing decahedral silver nanoparticles,9 in contrast, a light source with a long wavelength (green LED 520 nm) preferred to produce plate-like silver nanostructures.2 The dipole resonance can be easily formed for centrosymmetrical shape like nanodecahedra because the charge separation into the corners of a decahedron in an isotropic environment will create a dipole. A third small peak at 342 nm is assigned to the transversal plasmon resonance mode of out-of-plane quadrupoles.45 When the irradiating time of blue LED was increased from 15 min to 70 min, the dipole resonance was blue-shifted from 495 to 477 nm. With the reaction continuing, there are almost no obvious changes in the UV-vis spectra. The plot in Fig. 5c suggests that there was a more or less linear relationship between the major LSPR peak position and the irradiation time. Both the color change and the spectral change are attributed to the change of the AgND morphology. The plasmonic properties of nanostructures can be largely effected by their sharpness of corners or edges.46 Because the blunt features of AgND tend to decrease charge separation and increase the restoring force for the dipole oscillation, a increase in resonance frequency or blue-shift in wavelength is expected. The shoulder around 400 nm in the UV-vis spectra is not pronounced, suggesting the Ag nanoplates are by-product of the reaction. In addition, the UV-vis spectrum of the AgND was quite stable after storing at room temperature for 10 months (Fig. 5d). This result shows that the AgND avoided aggregation for more than 10 months, exhibiting the stability of the as-prepared silver nanodecahedra. From the description, both SEM images and UV-vis spectra are correlated for confirming AgND formation.
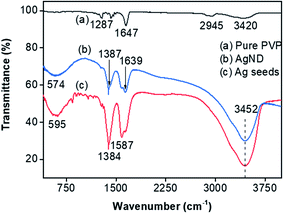
The interaction of obtained AgND with PVP was confirmed by FTIR spectra. Fig. 6 shows the FTIR spectra of pure PVP, AgND and Ag seeds. In the spectrum of pure PVP, the absorption peak locates at around 1647 cm−1 ascribed to the stretching vibration of C![[double bond, length as m-dash]](https://www.rsc.org/images/entities/char_e001.gif) O (carbonyl group), which is called the free C
O (carbonyl group), which is called the free C![[double bond, length as m-dash]](https://www.rsc.org/images/entities/char_e001.gif) O stretching band of pure PVP. The absorption peak located at around 1287 cm−1 can be assigned as the stretching vibration of C–N, the peak at 2945 cm−1 is due to C–H stretching vibration, a broad peak located at around 3420 cm−1 can be assigned to the O–H (hydroxyl group) stretching vibration.35 Fig. 6b shows the FTIR spectra of AgND. The absorption peak located at around 1639 cm−1 can be assigned as the stretching vibration of C
O stretching band of pure PVP. The absorption peak located at around 1287 cm−1 can be assigned as the stretching vibration of C–N, the peak at 2945 cm−1 is due to C–H stretching vibration, a broad peak located at around 3420 cm−1 can be assigned to the O–H (hydroxyl group) stretching vibration.35 Fig. 6b shows the FTIR spectra of AgND. The absorption peak located at around 1639 cm−1 can be assigned as the stretching vibration of C![[double bond, length as m-dash]](https://www.rsc.org/images/entities/char_e001.gif) O, which is called the coordinated C
O, which is called the coordinated C![[double bond, length as m-dash]](https://www.rsc.org/images/entities/char_e001.gif) O bands due to the coordination between Ag atoms and carbonyl oxygen.47 The carbonyl absorption peak of AgND/PVP composite is red-shifted from 1647 to 1639 cm−1 compared with pure PVP, this is due to the change in the chemical environment of PVP because of the interaction between silver nanodecahedra and carbonyl group in PVP after the adsorption interaction between PVP and silver atoms.48 Where Ag+ would immediately coordinate with the lone pair electrons of the oxygen atom on the carbonyl group of PVP, leading to the decrease of the chemical potential of Ag+.35 The absorption peak at about 3452 cm−1 is the characteristic band of the stretching vibration of hydrogen bonded O–H. In the PVP spectrum, the peaks were weak, while with Ag the peaks were sharper. The width and intensity of peaks in a Fourier transform infrared (FTIR) spectrum explicitly depend on the particle size. The width of the peak decreases and intensity increases as the particle size increases. The major peak at 1384 cm−1 showed the strong symmetrical stretch of nitro compound (NO2) resulting from the starting material silver nitrate (AgNO3).
O bands due to the coordination between Ag atoms and carbonyl oxygen.47 The carbonyl absorption peak of AgND/PVP composite is red-shifted from 1647 to 1639 cm−1 compared with pure PVP, this is due to the change in the chemical environment of PVP because of the interaction between silver nanodecahedra and carbonyl group in PVP after the adsorption interaction between PVP and silver atoms.48 Where Ag+ would immediately coordinate with the lone pair electrons of the oxygen atom on the carbonyl group of PVP, leading to the decrease of the chemical potential of Ag+.35 The absorption peak at about 3452 cm−1 is the characteristic band of the stretching vibration of hydrogen bonded O–H. In the PVP spectrum, the peaks were weak, while with Ag the peaks were sharper. The width and intensity of peaks in a Fourier transform infrared (FTIR) spectrum explicitly depend on the particle size. The width of the peak decreases and intensity increases as the particle size increases. The major peak at 1384 cm−1 showed the strong symmetrical stretch of nitro compound (NO2) resulting from the starting material silver nitrate (AgNO3).
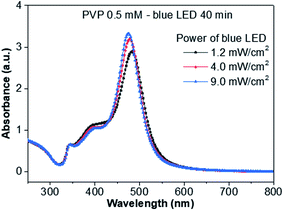
The effect of the excitation intensity on the growth of the AgND is presented in Fig. 7. At low power (1.2 mW cm−2), the reaction is slow and the yield of AgND is low, accompanied by the formation of the irregular products. As the power is increased, the yield of AgND increases with the highest yield of AgND observed at 9 mW cm−2, because the reduction of Ag+ is faster at high intensities.
3.3. Growth process
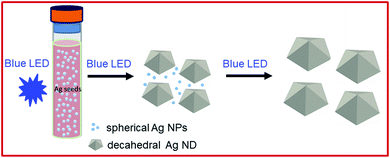
The formation process of AgND is schematically illustrated in Fig. 8. At the initial stage of the reduction process, silver ions are reduced to atoms, which in turn come together to form small clusters of quasi-spherical structure through homogenous nucleation with the assistance of PVP. PVP decreases the chemical potential of Ag+ so the crystal seeds would be generated more easily during the nucleation period. As the Ag clusters grow larger, they become more stable and could serve as seeds, from which they will ultimately grow into nanostructures with desired shape under the influence of PVP. The particles formed at the initial stage of the reduction process would grow into Ag nanoplates and AgND, which is called self-seeding process. After 25 min, many nanoplates can be observed. In the later stage of the photochemical reaction, AgND appeared and the number of Ag nanoplates decreased. The shape evolution of the silver nanostructures followed the process of Ostwald ripening, where the unstable Ag nanoplates scarified and provided the silver element source for the growth of Ag nanodecahedra. This process results in a Boltzmann-like distribution of decahedron with lowest free energy and thus the most abundant morphology due to the energetic favorability.49 The silver nanoplates can be regarded as intermediates and almost disappear at the final reaction stage.6 The PVP structure has a polyvinyl skeleton with polar groups4 containing nitrogen and oxygen atoms called carbonyl oxygen. PVP serves as the polymeric capping agent to generate metal colloids. The AgND have fivefold symmetry with their surfaces bounded by ten {111} facets (five {111} facets at each end) which are of minimized surface-energy. Hence, the reduced silver atoms are preferentially deposited onto {111} facets. The interaction between PVP and {100} facets is much stronger than that between PVP and {111} facets, so PVP molecules would selectively adsorb onto the Ag (100) surface by the coordination and prevent the aggregation of Ag atoms onto these surfaces.50 As a stabilizer, PVP promote the growth of a variety of high-quality particle morphologies, so it was used in many polyol syntheses of Ag nanostructures such as Ag nanowires, Ag nanospheres, Ag nanocubes.51 When light is irradiated on the silver seeds, the light is absorbed and converted to thermal energy that causes coalescence of the seeds, which is called the seed-coalescence caused by the light irradiation.17 The 465 nm photons have enough high energy to form the most stable decahedra. Blue LED possesses the shorter, higher energy excitation wavelength comparing to green LED (520 nm), which leads to faster rate of reaction, in turn yield nanodecahedral structure after 70 min. While using green LED light, AgND were obtained after 76 h.1 After 15 min blue LED irradiation, countless tiny silver nanoparticles form silver nanodecahedra rudiments. In this seed-mediated growth, preformed nanocrystals were used as seeds for further growth, where the nucleation and growth are separated steps.52 The average coordination number of silver atoms in nanodecahedra is larger than that in nanoplates and the reaction controlled at a low temperature leads to the formation of nanodecahedra, consistent with previous publication.10 Kabashin et al. used pulsed lasers irradiating the Ag colloids to fabricate Ag nanostructures with well-defined and controllable shapes in the presence of appropriate chemical species.53 Light excitation can also be used to grow or modify nanostructures in a controllable fashion.54 The light excited LSPR modes of the Ag seeds which regulate their size and shape evolution. As can be seen from Fig. 4a, the silver nanodecahedra and tiny silver nanoparticles co-occur at the inceptive reaction stage of 15 min. Protracting irradiating time to 70 min, the amount of silver nanodecahedra significantly increases while these tiny silver nanoparticles nearly disappear, indicating that they were used as building blocks in silver nanodecahedra assembly. Throughout the whole reaction, AgND develop by consuming tiny silver nanoparticles, and the size of the formed AgND grows proportionally (Fig. 4b–f). The experimental results as well as theoretical studies suggested that citrate binds more strongly to Ag (111) than Ag (100) surfaces, so the {111} facets are expected to grow more slowly than the {100} facets during seed-mediated growth when citrate ions are present,55 where citrate may play a shape-directing role. The amount of citrate photo-oxidation depends on the strength of the plasmonic response of the Ag seeds to the irradiating light. The excitation wavelength of the irradiation light used in this work as 465 nm can meet localized surface plasmon resonance (LSPR) condition. Blue LED light was resonant with both the quadrupole LSPR (peak 400 nm in the UV-vis spectra) and the dipole plasmon (peak 500 nm in the UV-vis spectra) of AgND. The morphology observed in this study was a result of the preferential growth of structures caused by the strongest plasmonic response and the greatest amount of photo-oxidation of citrate.56 AgND have the same crystal structure and lattice constant as the seed (Fig. 2), in contrast, the final shape of the nanostructure deviates from that of the initial seed. The seed-mediated growth methods for generating Ag nanorods and nanowires have also been reported previously.57 This photochemical approach could be used to produce high-quality Ag decahedrons,58 bipyramids59 and tetrahedrons.60 The study of the mechanism underlying the AgND formation process is important to blue LED irradiation synthesis technique. With a more complete understanding of the mechanism of plasmon-assisted growth, this method may become a highly tunable way for generating well-defined Ag nanostructures.53.4. Influence of PVP concentration on the morphology and optical properties
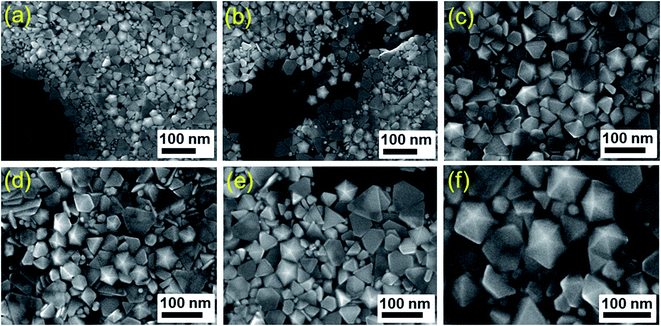
To investigate the effect of PVP concentration to the formation of silver nanodecahedra, we systematically investigated its influence on the morphology of the products through series of experiments while keeping the other conditions unchanged. It was found that the structure and morphology of the Ag products strongly depended on the concentration of PVP in the solution. PVP formed a self-assembly monolayer on the nanoparticle surface to protect the surface from dissolution and avoid shape transformation. Fig. 9 shows the SEM images of silver products at different PVP concentrations after 50 min blue LED irradiation. With the increasing in concentration of PVP from 0.1 mM to 0.3 mM, it could be observed from Fig. 9a and b two obvious products including truncated triangular nanoplates and decahedral nanoparticles. The obtained product exhibited the relatively narrow size distribution with the edge length of silver nanoplates around 100 nm and the diameter of decahedra around 60 nm. Numerous tiny nanoparticles dispersed among silver nanoplates and nanodecahedra. Fig. 9c and d displays SEM images of the silver products readied with 0.5 and 0.8 mM PVP, respectively. The shape and size of the obtained silver product remained unchanged when PVP concentration increased. Further increasing concentration of PVP to 1 and 2 mM, more PVP molecules are absorbed on the silver surface, there is a layer of amorphous material adsorbed on the edge of nanodecahedra (Fig. 9e and f), thereby affecting the purity of the silver product. Thus, we found that the best result was obtained when the PVP concentration for synthesis of AgND is 0.5 mM, which represents the standard procedure used in this paper.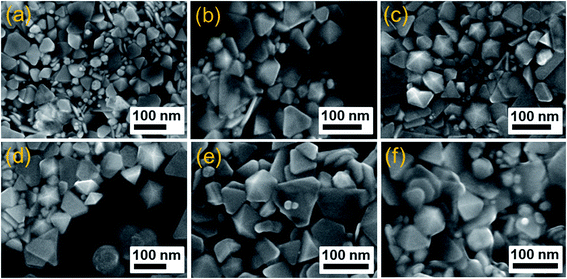 | ||
| Fig. 9 SEM images of products prepared in the presence of various PVP concentrations (a) 0.1 mM, (b) 0.3 mM, (c) 0.5 mM, (d) 0.8 mM, (e) 1 mM, (f) 2 mM after 50 min blue LED irradiation. | ||
We monitored the change in the SPR peak during the nucleation and growth of AgND under the same condition of 50 min blue LED irradiation. Spectra in Fig. 10 show the extinction spectra of silver nanodecahedra colloids synthesized at 50 min blue LED irradiation, corresponding to the SEM images in Fig. 9a–f. The major SPR bands in the spectra are approximately 340, 400 and 480 nm. These peaks hardly changed their positions, which indicates that the position 480 nm peak would not be very sensitive to the PVP concentration. In the case of 0.5 mM PVP, the LSPR peak of 480 nm was broader and stretched out than other cases. The broadening of the surface plasmon resonance peak indicates the existence of a wider range of sizes in the solution.61 A further increase in the PVP concentration (0.8 mM, 1 mM and 2 mM) results in the sharpening and the intensity increasing of the main absorption peak relative to that of the 0.5 mM PVP sample, while the lower wavelength absorbance peak remained the same.62
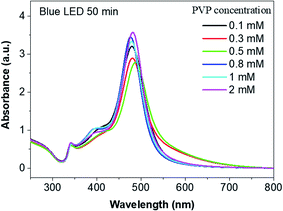 | ||
| Fig. 10 UV-vis spectra of AgND synthesized in different concentrations of PVP after 50 min blue LED irradiation. | ||
3.5. SERS application
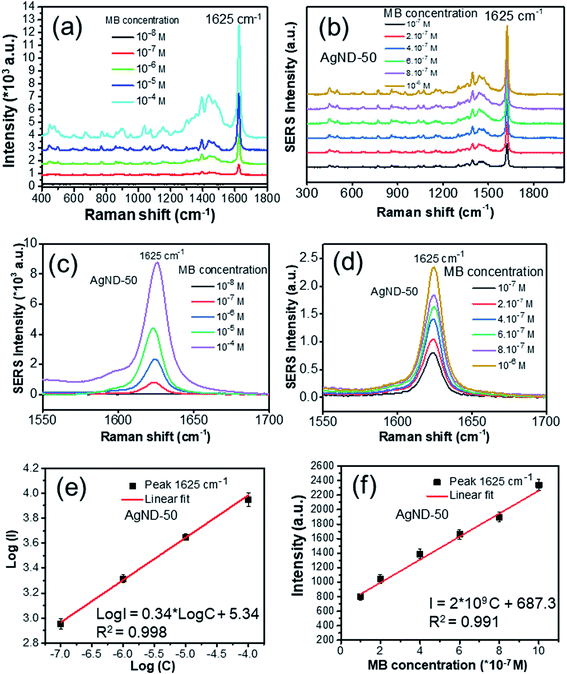
Silver nanodecahedra structures prepared in the presence of PVP with concentration of 0.5 mM reveal strong SERS responses using methylene blue (MB) as the probe molecule, and the detection sensitivity can reach 0.1 ppm level, with an estimated enhancement factor of 106. The AgND possess a nanoscale sharp vertices, which will lead to amplification of the electromagnetic field near the metal surface, so these structures may be used as effective SERS-active tags.63 As shown in Fig. 11, the most intense peak in the SERS spectra can be observed at 1625 cm−1, due to the enhancement of the Raman scattering, which is the main characteristic peak of MB.64 This peak is assigned to C–C ring stretching and C–N ring stretching.29 Raman spectroscopy can be used for quantifying the MB concentration and for calculating the limit of detection (LOD) of MB. The height of a specific Raman peak was considered as the criterion to identify the concentration of MB. Therefore, this peak was determined to evaluate the SERS effect of Ag particles samples. MB in water only exhibits a fluorescence background but no prominent Raman signal in the absence of AgND. The SERS spectra show all the characteristic peaks of MB after different blue LED illuminating times, suggesting that the size of AgND has little influence on the Raman shift of the scattering light. The SERS signal increases intensely when the target molecules are close to tips and sharp edges of AgND due to the lighting rod effect or inside the gaps among AgND called “hot spots”.65 The hot spot is the region with the highest electromagnetic field enhancement and contributes to the SERS enhancement factor.66 The AgND assembled together create abundant interstitial sites, form the nanogaps between adjacent nanodecahedra or in the intercrossed corners in the sub-10 nm region (Fig. 4), providing high density of “hot spots” which confine electromagnetic (EM) field.67 The gaps or void spaces between constituent nanostructures can concentrate laser light into nanosized volumes, drastically increasing the electromagnetic field intensity near the nanoparticles due to the LSPR modes.68 The enhancement of the Raman scattering of molecules in the vicinity of a hot spot can be on the order of E,4 where E is the enhanced E-field near the nanostructure, and thus create Raman signal enhancement.69 SERS measurement does not require labels or other markers and provides a Raman fingerprint of molecule vibrational spectrum. SERS is a direct and sensitive technique to identify molecular structure based on the spectroscopic fingerprint.70 There are enough “hot spots” for MB molecules, so all MB molecules adsorbed on the AgND structures are enhanced adequately. Moreover, the sharp corners of AgND supported the detection of molecules adsorbed onto the surfaces of the particles, leading to high enhancement factor in SERS performance. Martin et al. elucidated that the enhancement factor of the sharp nanocubes was twice higher than that of the truncated counterparts.71 Kamalesh Nehra et al. achieved the enhancement factor (EF) of 3.9 × 10⁸ for 25 pM of methylene blue (MB) in the presence of sharp tips of the star-shaped Au NPs, they found that the SERS performance depended upon the number of tips, tip length and tip sharpness of Au NPs.72 Therefore, the obtained AgND were expected to be utilized as desired substrates for SERS applications. Only a little of analyst solution (0.2 ml) was used during the tests for trace detection. The AgND samples prepared with different irradiation times of blue LED in Fig. 4 were investigated as shown in Fig. 11a. The SERS signals were found to increase with increasing of blue LED irradiation time from 15 to 50 min, and then reduced at longer periods of time. Through comparing the signals of the six products, we found that the AgND with blue LED irradiation time of 50 min demonstrated the SERS signals with highest intensity (Fig. 11b). This sample provided more “hot spots” than other samples in the same area, which induced extremely enhanced Raman signals.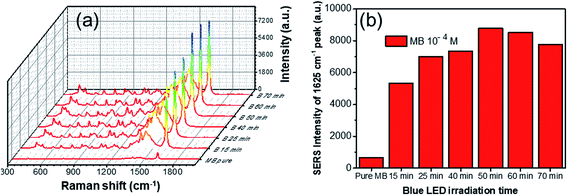 | ||
| Fig. 11 (a) SERS spectra of methylene blue at concentration of 10−4 M adsorbed on different AgND, (b) the relationship between Raman intensity of the 1625 cm−1 band and blue LED irradiation time. | ||
The SERS spectra of MB at different concentrations were further measured by using the AgND prepared with 50 min blue LED light as SERS substrate (AgND-50). The variation of the Raman signal of MB with the concentration (10−8 to 10−4 M) is shown in Fig. 12a. The concentration of the probe molecule is proportional to its Raman peak intensity. The intensity of the SERS signal increases with the increase of the concentration of the target molecules. When the concentration of MB is low as 10−7 M, the Raman characteristic peaks of MB can still be observed with the intensity of 1625 cm−1 peak of about 802, demonstrating the high sensitivity of the AgND-50 sample which could achieve trace detection of MB. It should be noted that the Raman signal cannot be obtained at 10−8 M of MB. It is evident that the limit of detection (LOD) in this case is 10−7 M, where we consider that the LOD of MB corresponds to the LOD of its most intense Raman peak located at a Raman shift of 1625 cm−1. This is attributed to the AgND provides a large number of “hot spots” for SERS detection. When the concentration is increased to 10−6 M, the peak intensity is increased to about 2339. That means, when the number of molecules increased 10 times, the SERS intensity increased approximately 4 times. When the concentration is increased further to 10−4 M, the Raman intensity of the 1625 cm−1 peak is increased to about 8777, which is only about 3.75 times the intensity of the 10−6 M case (Fig. 12c and d). The decrease of the enhancement for the sample of high concentration is due to the crowd of the analysis molecules compared with the “hot spots”.
The intensity change of the Raman peak at 1625 cm−1 with the methylene blue concentration is drawn in Fig. 12e and f. A linear dependence was found between the logarithmic concentration of MB and the intensities of the 1625 cm−1 peak as shown in eqn (3) below:
log![[thin space (1/6-em)]](https://www.rsc.org/images/entities/char_2009.gif) I = 0.34 I = 0.34![[thin space (1/6-em)]](https://www.rsc.org/images/entities/char_2009.gif) log log![[thin space (1/6-em)]](https://www.rsc.org/images/entities/char_2009.gif) C + 5.34 C + 5.34
| (3) |
| I = 2 × 10⁹C + 687.3 | (4) |
For a linear calibration curve, the MB Raman peak intensity at 1625 cm−1 (I) is linearly related to the MB concentration (C) for a limited range of concentrations as following equation:73
| I = aC + b | (5) |
The enhancement factor (EF) of the AgND-50 as SERS substrate was estimated by the following equation:4
 | (6) |
Beside the high enhancement and sensitivity of SERS substrate, the producibility is also important parameter to evaluate the quality of AgND-50. The SERS spectra of MB were collected from randomly selected ten points in the center area of the Ag/Si substrate to estimate the reproducibility of SERS signals. Fig. 13a shows the Raman spectra of 10−7 M MB obtained from 10 different points on the AgND-50 substrate. The intensity of Raman signals on these points display no shift and nearly similar to each other. The relative standard deviation of the Raman signal at 1625 cm−1 was calculated to be about 2.7% which depicted the reproducibility of the measurements. The sensitivity and reproducibility of SERS detection is attributed to the uniform distribution of the AgND on the surface of Si substrate. Therefore, these results illustrate that the SERS substrate with AgND-50 possesses optimum SERS activity which could be a good candidate for an improved SERS substrate in detecting MB.
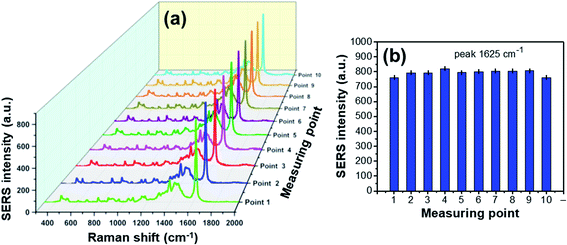 | ||
| Fig. 13 SERS spectra of 10−7 M MB modified from 10 different points on AgND-50 substrate (a) with the relative standard deviation of the Raman signals at 1625 cm−1 peak (b). | ||
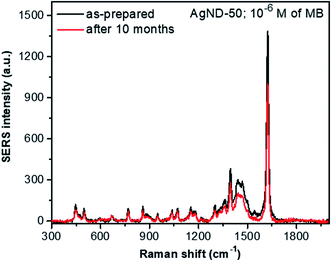
Fig. 14 shows the stability of SERS substrate based on AgND-50 sample. The Raman spectra exhibits nearly the same trend after 10 months of storage. The SERS intensity decreases after 10 months but the sample is still SERS active. These results indicate that the AgND have high SERS stability. AgND were also studied to detect 4-mercaptobenzoic acid (4-MBA)7 or Rhodamine 6G (R6G)10 using the SERS effect. SERS substrates are ubiquitous in diverse real-life applications, such as in water pollution management, food safety, and chemical manufacturing.75 The analysis involving real samples will be more complicated compared to a single analyte, because the analyte extracted from the sample is dissolved in a complex matrix. Other compounds can competitively bind to the surface of the SERS substrate and interfere the Raman signal of the analyte of interest.76 Chunying Li et al. have analyzed the trace methylene blue in fish muscles using Au NPs.77 It is also important to employ the principal component analysis to accurately identify vibrational signatures of target analytes from other molecular interferences. It is difficult to decipher the individual molecular fingerprints in a biological matrix with myriad biomolecules. We will continue this interesting subject in the next paper.
4. Conclusion
In conclusion, we have presented a facile strategy for synthesis of AgND as SERS-active substrate in detecting the trace amount of MB, where AgND were synthesized by salt reduction through the introduction of TSC and NaBH4 as reductive and directing agents, and the growth process was controlled by blue LED light. The synthesized silver nanoparticles were found to be single crystals with a decahedral shape. The successful fabrication of AgND has been proven by the morphology and structure characterizations. The density and size of AgND could be tuned by adjusting the concentration of PVP and blue LED irradiation time. AgND can be formed at high density with the size about 50 to 80 nm when the PVP concentration was 0.5 mM and the blue LED irradiation time was 50 min. These systematic studies identified the specific roles of each reagent in the photo-chemical reduction route to prepare silver nanodecahedra. Silver salt can be directly converted to silver nanoparticles with the assistance of an appropriate capping ligand (PVP). As a hydroxyl group-containing compound, PVP possesses the stability against oxidation and ripening of Ag nanoparticles due to the sorption of polymer molecules on metal surfaces. This work provides highly reproducible recipe for synthesis of AgND and helps us understand the growth mechanism behind the experimental phenomena. Most interesting, the as-prepared AgND structures with highly sharp vertices can be sensitive SERS platforms for the detection of methylene blue molecules. The SERS measurement results indicated that the AgND-50 based-substrate exhibited excellent performance, even at a low concentration of 10−7 M (0.1 ppm), the signatures of MB in Raman spectrum were still clearly observed owing to their high density of “hot spots”. The SERS intensity depends linearly on the MB concentration in the narrow range (from 10−7 to 10−6 M) and the linear relationship between logarithm of SERS intensity and logarithm of MB concentration presented in the wider range (from 10−7 to 10−4 M). The EF factor reaches to above 1.6 × 10⁶ with MB concentration of 10−7 M. In addition, the SERS signals of MB molecule were similar after the sample had been stored for 10 months, proving the high SERS stability of AgND. Our work suggested that the AgND can be used as a highly sensitivity, reproducibility, stability, rapid and effective substrate for practical SERS detection. These results may open up a new avenue for fabricating facile architectures as well as exploring emerging properties of metal nanoparticles.Conflicts of interest
There are no conflicts to declare.Acknowledgements
This work has been funded by Vietnam Ministry of Education and Training on the project number B2019-TNA-02.VL.References
- T. T. H. Pham, N. D. Dien, X. H. Vu, T. T. Tran, N. X. Ca, N. V. Truong, P. M. Tan, H. T. Van and P. V. Do, J. Electron. Mater., 2020, 49, 5009–5027 CrossRef CAS.
- T. T. H. Pham, X. H. Vu, N. D. Dien, T. T. Trang, N. V. Truong, T. D. Thanh, P. M. Tan and N. X. Ca, RSC Adv., 2020, 10, 24577–24594 RSC.
- K. H. Sodha, J. K. Jadav, H. P. Gajera and K. J. Rathod, Int. J. Pharma Bio Sci., 2015, 6, 199–208 CAS.
- Q. Zhang, N. Li, J. Goebl, Z. Lu and Y. Yin, J. Am. Chem. Soc., 2011, 133, 18931–18939 CrossRef CAS.
- M. Rycenga, C. M. Cobley, J. Zeng, W. Li, C. H. Moran, Q. Zhang, D. Qin and Y. Xia, Chem. Rev., 2011, 111, 3669–3712 CrossRef CAS.
- S.-W. Lee, S.-H. Chang, Y.-S. Lai, C.-C. Lin, C.-M. Tsai, Y.-C. Lee, J.-C. Chen and C.-L. Huang, Materials, 2014, 7, 7781–7798 CrossRef.
- M. N. T. Anh, D. T. D. Nguyen, N. V. K. Thanh, N. T. P. Phong, D. H. Nguyen and M.-T. Nguyen-Le, Process, 2020, 8, 1–7 Search PubMed.
- H. Wang, X. Zheng, J. Chen, D. Wang, Q. Wang, T. Xue, C. Liu, Z. Jin, X. Cui and W. Zheng, J. Phys. Chem. C, 2012, 116, 24268–24272 CrossRef CAS.
- Y.-C. Lee, S.-J. Chen and C.-L. Huang, J. Chin. Chem. Soc., 2010, 57, 325–331 CrossRef CAS.
- L.-C. Yang, Y.-S. Lai, C.-M. Tsai, Y.-T. Kong, C.-I. Lee and C.-L. Huang, J. Phys. Chem. C, 2012, 116, 24292–24300 CrossRef CAS.
- P. E. Cardoso-Avila, J. L. Pichardo-Molina, C. M. Krishna and R. Castro-Beltran, J. Nanopart. Res., 2015, 17, 1–10 CrossRef CAS.
- H. Lu, H. Zhang, X. Yu, S. Zeng, K.-T. Yong and H.-P. Ho, Plasmonics, 2012, 7, 167–173 CrossRef CAS.
- M. Tsuji, N. Nakamura, X. Tang, K. Uto and M. Matsunaga, J. Cryst. Growth, 2014, 406, 94–103 CrossRef CAS.
- K. Wang, Z. Liu, T. Zhang, Y. Qin and X. Yang, Colloids Surf., A, 2019, 570, 89–95 CrossRef CAS.
- B. Viswanath, P. Kundu, A. Halder and N. Ravishankar, J. Phys. Chem. C, 2009, 113, 16866–16883 CrossRef CAS.
- C. Xue, G. S. Metraux, J. E. Millstone and C. A. Mirkin, J. Am. Chem. Soc., 2008, 130, 8337–8344 CrossRef CAS.
- K. G. Stamplecoskie and J. C. Scaiano, J. Am. Chem. Soc., 2010, 132, 1825–1827 CrossRef CAS.
- M. R. Langille, J. Zhang and C. A. Mirkin, Angew. Chem., Int. Ed., 2011, 50, 3543–3547 CrossRef CAS.
- A. Tao, P. Sinsermsuksakul and P. Yang, Angew. Chem., Int. Ed., 2006, 45, 4597–4601 CrossRef CAS.
- Q. Zhang, Y. Hu, S. Guo, J. Goebl and Y. Yin, Nano Lett., 2010, 10, 5037–5042 CrossRef CAS.
- B. T. Huy, Q.-T. Pham, N. T. T. An, E. Conte and Y.-I. Lee, J. Lumin., 2017, 188, 436–440 CrossRef CAS.
- B. Ma, P. Li, L. Yang and J. Liu, Talanta, 2015, 141, 1–7 CrossRef CAS.
- I. Yoon, T. Kang, W. Choi, J. Kim, Y. Yoo, S.-W. Joo, Q.-H. Park, H. Ihee and B. Kim, J. Am. Chem. Soc., 2009, 131, 758–762 CrossRef CAS.
- A. D'Agostino, D. M. Giovannozzi, L. Mandrile, A. Sacco, A. M. Rossi and A. Taglietti, Talanta, 2020, 216, 1–8 CrossRef.
- M. F. Cardinal, E. V. Ende, R. A. Hackler, M. O. McAnally, P. C. Stair, G. C. Schatz and R. P. V. Duyne, Chem. Soc. Rev., 2017, 46, 3886–3903 RSC.
- M. Kahraman, E. R. Mullen, A. Korkmaz and S. Wachsmann-Hogiu, Nanophotonics, 2017, 6, 831–852 CAS.
- J. Chen, Y. Huang, P. Kannan, L. Zhang, Z. Lin, J. Zhang, T. Chen and L. Guo, Anal. Chem., 2016, 88, 2149–2155 CrossRef CAS.
- X. He, X. Wu, K. Wang, B. Shi and L. Hai, Biomaterials, 2009, 30, 5601–5609 CrossRef CAS.
- M. D. Moghari, Optimized methylene-blue detection and quantification utilising conventional Raman spectroscopy, Physics Master thesis, Macquarie University, Sydney, Australia, 2016.
- S. D. Roy, M. Ghosh and J. Chowdhury, J. Raman Spectrosc., 2015, 46, 451–461 CrossRef.
- P. Matousek and M. D. Morris, Emerging Raman applications and techniques in biomedical and pharmaceutical fields, Springer, 2010 Search PubMed.
- X. Wu, P. L. Redmond, H. Liu, Y. Chen, M. Steigerwald and L. Brus, J. Am. Chem. Soc., 2008, 130, 9500–9506 CrossRef CAS.
- J. Junaidi, K. Triyana, H. Sosiati, E. Suharyadi and H. Harsojo, Adv. Mater. Res., 2015, 1123, 256–259 Search PubMed.
- Q. Zhang, W. Li, C. Moran, J. Zeng, J. Chen, L.-P. Wen and Y. Xia, J. Am. Chem. Soc., 2010, 132, 11372–11378 CrossRef CAS.
- H. Mao, J. Feng, X. Ma, C. Wu and X. Zhao, J. Nanopart. Res., 2012, 14, 1–15 CrossRef.
- M. R. Johan, N. A. K. Aznan, S. T. Yee, I. H. Ho, S. W. Ooi, N. D. Singho and F. Aplop, J. Nanomater., 2014, 105454, 1–7 Search PubMed.
- S. K. Balavandy, K. Shameli, D. R. B. A. Biak and Z. Z. Abidin, Chem. Cent. J., 2014, 8, 1–10 CrossRef.
- J.-Y. Lin, Y.-L. Hsueh and J.-J. Huang, J. Solid State Chem., 2014, 214, 2–6 CrossRef CAS.
- Q. Zhang, Y. Yang, J. Li, R. Iurilli, S. Xie and D. Qin, ACS Appl. Mater. Interfaces, 2013, 5, 6333–6345 CrossRef CAS.
- V. Amendola, O. M. Bakr and F. Stellacci, Plasmonics, 2010, 5, 85–97 CrossRef CAS.
- B. Kumar, K. Smita, L. Cumbal, A. Debut and R. Pathak, Bioinorg. Chem. Appl., 2014, 784268, 1–8 Search PubMed.
- D. K. Gramotnev and S. I. Bozhevolnyl, Nat. Photonics, 2010, 4, 83–91 CrossRef CAS.
- M. L. Brongersma and V. M. Shalaev, Science, 2010, 328, 440–441 CrossRef CAS.
- X. Zheng, X. Zhao, D. Guo, B. Tang, S. Xu, B. Zhao and W. Xu, Langmuir, 2009, 25, 3802–3807 CrossRef CAS.
- Q. Zhang, J. Ge, T. Pham, J. Goebl, Y. Hu, Z. Lu and Y. Yin, Angew. Chem., Int. Ed., 2009, 48, 3516–3519 CrossRef CAS.
- J. Zeng, S. Roberts and Y. Xia, Chem.–Eur. J., 2010, 16, 12559–12563 CrossRef CAS.
- Y.-J. Song, M. Wang, X.-Y. Zhang, J.-Y. Wu and T. Zhang, Nanoscale Res. Lett., 2014, 9, 1–8 CrossRef CAS.
- X. Yang and Y. Lu, Mater. Lett., 2005, 59, 2484–2487 CrossRef CAS.
- F. Baletto and R. Ferrando, Rev. Mod. Phys., 2005, 77, 371–423 CrossRef CAS.
- D. Cheng, M. He, J. Ran, G. Cai, J. Wu and X. Wang, Sens. Actuators, B, 2018, 270, 508–517 CrossRef CAS.
- Q. Zhang, C. Cobley, L. Au, M. McKiernan, A. Schwartz, L.-P. Wen, J. Chen and Y. Xia, ACS Appl. Mater. Interfaces, 2009, 1, 2044–2048 CrossRef CAS.
- Y. Xia, Y. Xiong, B. Lim and S. E. Skrabalak, Angew. Chem., Int. Ed., 2009, 48, 60–103 CrossRef CAS.
- A. V. Kabashin, P. Delaporte, A. Pereira, D. Grojo, R. Torres, T. Sarnet and M. Sentis, Nanoscale Res. Lett., 2010, 5, 454–463 CrossRef CAS.
- J. Saade and C. B. d. Araujo, Mater. Chem. Phys., 2014, 148, 1184–1193 CrossRef CAS.
- D. S. Kilin, O. V. Prezhdo and Y. Xia, Chem. Phys. Lett., 2008, 458, 113–116 CrossRef CAS.
- P. L. Redmond and L. E. Brus, J. Phys. Chem. C, 2007, 111, 14849–14854 CrossRef CAS.
- B. Pietrobon, M. McEachran and V. Kitaev, ACS Nano, 2009, 3, 21–26 CrossRef CAS.
- B. Pietrobon and V. Kitaev, Chem. Mater., 2008, 20, 5186–5190 CrossRef CAS.
- J. Zhang, S. Li, J. Wu, G. C. Schatz and C. A. Mirkin, Angew. Chem., Int. Ed., 2009, 48, 7787–7791 CrossRef CAS.
- J. Zhou, J. An, B. Tang, S. Xu, Y. Cao, B. Zhao, W. Xu, J. Chang and J. R. Lombardi, Langmuir, 2008, 24, 10407–10413 CrossRef CAS.
- M. K. Alqadi, O. A. A. Noqtah, F. Y. Alzoubi, J. Alzouby and K. Aljarrah, Mater. Sci. Polym., 2014, 31, 107–111 CrossRef.
- K. Nehra, S. K. Pandian, M. S. S. Bharati and V. R. Soma, New J. Chem., 2019, 43, 3835–3847 RSC.
- G. Goddard, L. O. Brown, R. Habbersett, C. I. Brady, J. C. Martin, S. W. Graves, J. P. Freyer and S. K. Doorn, J. Am. Chem. Soc., 2010, 132, 6081–6090 CrossRef CAS.
- M. Zannotti, A. Rossi and R. Giovannetti, Coatings, 2020, 10, 1–11 CrossRef.
- A. Shiohara, Y. Wang and L. M. Liz-Marzan, J. Photochem. Photobiol., C, 2014, 21, 2–25 CrossRef CAS.
- M. Rycenga, P. H. C. Camargo, W. Li, C. H. Moran and Y. Xia, J. Phys. Chem. Lett., 2010, 1, 696–703 CrossRef CAS.
- C. Zhu, G. Meng, Q. Huang, Z. Li, Z. Huang, M. Wang and J. Yuan, J. Mater. Chem., 2012, 22, 2271–2278 RSC.
- L. Jensen, C. M. Aikens and G. C. Schatz, Chem. Soc. Rev., 2008, 37, 1061–1073 RSC.
- Z. Nie, A. Petukhova and E. Kumacheva, Nat. Nanotechnol., 2010, 5, 15–25 CrossRef CAS.
- M. J. Banholzer, J. E. Millstone, L. Qin and C. A. Mirkin, Chem. Soc. Rev., 2008, 37, 885–897 RSC.
- M. J. Mulvihill, X. Y. Ling, J. Henzie and P. Yang, J. Am. Chem. Soc., 2010, 132, 268–274 CrossRef CAS.
- K. Nehra, S. K. Pandian, C. Byram, S. S. B. Moram and V. R. Soma, J. Phys. Chem. C, 2019, 123, 16210–16222 CrossRef CAS.
- A. Shrivastava and V. B. Gupta, Chron. Young Sci., 2011, 2, 21–25 CrossRef.
- S. S. B. Moram, A. K. Shaik, C. Byram, S. Hamad and V. R. Soma, Anal. Chim. Acta, 2020, 1101, 157–168 CrossRef CAS.
- H. K. Lee, Y. H. Lee, C. S. L. Koh, G. C. Phan-Quang, X. Han, C. L. Lay, H. Y. F. Sim, Y.-C. Kao, Q. An and X. Y. Ling, Chem. Soc. Rev., 2019, 48, 731–756 RSC.
- R. Pilot, R. Signorini, C. Durante, L. Orian, M. Bhamidipati and L. Fabris, Biosensors, 2019, 9, 1–100 CrossRef.
- C. Li, Y. Huang, K. Lai, B. A. Rasco and Y. Fan, Food Control, 2016, 65, 99–105 CrossRef CAS.
| This journal is © The Royal Society of Chemistry 2020 |

