
 Open Access Article
 This Open Access Article is licensed under a Creative Commons Attribution-Non Commercial 3.0 Unported Licence
In situ high pressure neutron diffraction and Raman spectroscopy of 20BaO–80TeO2 glass†
Atul Khanna *a,
Amarjot Kaura,
Hirdesha,
Shekhar Tyagib,
Nicholas P. Funnellc and
Craig. L. Bullc
*a,
Amarjot Kaura,
Hirdesha,
Shekhar Tyagib,
Nicholas P. Funnellc and
Craig. L. Bullc
aDepartment of Physics, Guru Nanak Dev University, Amritsar-143005, Punjab, India. E-mail: atul.phy@gndu.ac.in; Fax: +91-183-225-8820; Tel: +91-183-225-8802 ext. 3568
bUGC-DAE-Consortium of Scientific Research, University Campus, Khandwa Road, Indore-452001, India
cISIS Neutron and Muon Facility, Rutherford Appleton Laboratory, Chilton, Didcot, Oxon OX11 0QX, UK
First published on 22nd November 2020
Abstract
The short-range structure of 20BaO–80TeO2 glass was studied in situ by high pressure neutron diffraction and high pressure Raman spectroscopy. Neutron diffraction measurements were performed at the PEARL instrument of the ISIS spallation neutron source up to a maximum pressure of 9.0 ± 0.5 GPa. The diffraction data was analysed via reverse Monte Carlo simulations and the changes in the glass short-range structural properties, Ba–O, Te–O and O–O bond lengths and speciation were studied as a function of pressure. Te–O co-ordination increases from 3.51 ± 0.05 to 3.73 ± 0.05, Ba–O coordination from 6.24 ± 0.19 to 6.99 ± 0.34 and O–O coordination from 6.00 ± 0.05 to 6.69 ± 0.06 with an increase in pressure from ambient to 9.0 GPa. In situ high pressure Raman studies found that the ratio of intensities of the two bands at 668 cm−1 and 724 cm−1 increases from 0.99 to 1.18 on applying pressure up to 19.28 ± 0.01 GPa, and that these changes are due to the conversion of TeO3 into TeO4 structural units in the tellurite network. It is found that pressure causes densification of the tellurite network by the enhancement of co-ordination of cations, and an increase in distribution of Te–O and Ba–O bond lengths. The original glass structure is restored upon the release of pressure.
1 Introduction
The structural changes in glasses induced by pressure can substantially modify their mechanical, optical, electrical and thermal properties.1–7 The structures of silicate,8 borate,9,10 borosilicate11 and germanate12,13 glasses have been investigated in situ by high pressure X-ray and neutron diffraction and Raman spectroscopy and it is reported that Si–O, B–O and Ge–O coordination in the glass network increases significantly on compression. Glasses usually recover completely from high pressure conditions, and this helps to make fracture-resistant materials.14,15 From an industrial point of view, high-pressure and high temperature treatment of melts can produce permanent changes in glass properties on quenching to ambient conditions.16 The pressure-induced structural transformations produce changes in the bond lengths, concentration of non-bridging oxygen (NBO) and coordination number of network-former and modifier cations.8–13,17Mackenzie18 conducted studies on vitreous SiO2 at 8 GPa and 848 K by infrared (IR) spectroscopy to investigate the effects of compression on the glass structure and reported an increase in the glass density of ∼18% without any significant changes in the silica network. Chason19 studied the pressure-induced structural changes in vitreous-B2O3 compressed at 1 to 1.5 GPa and 573 K, resulting in ∼10% densification. Based on X-ray diffraction studies, the enhancement in the density was attributed to the changes in B–O–B bond angles. Velde and Kushiro20 using infrared and X-ray spectroscopy found an increase in the Al coordination from 4-fold to 6-fold in Na2O–Al2O3–SiO2 glasses upon pressure quenching their melts from 3 GPa. Inamura et al.21 studied the structure of glassy SiO2 compressed up to 7.4 GPa and found changes in the middle range order caused by deformation of 6-fold ring structure. Similar changes in the MRO have been detected by Guerette et al.22 in glassy-SiO2 compressed up to 8 GPa.
Tellurite glasses based on TeO2 as a network forming material, are technologically important materials and find applications in optical fibres, photoluminescence, lasers and non-linear optical devices due to their high linear and nonlinear refractive indices,23–28 photosensitivity and high transparency in the infrared region.26,29,30 It is known from neutron diffraction and high energy X-ray diffraction studies31,32 that the structure of TeO2 glass consists of predominantly corner sharing TeO4 trigonal bipyramidal (tbp) units along with small concentrations of TeO3 trigonal pyramidal (tp) units. TeO2 has poor glass forming ability and it forms glassy phase at high melt quenching rates or by intermittent melt cooling technique.30,33 However upon adding alkali, alkaline-earth and transition metal oxides, the glass forming ability (GFA) of TeO2 gets significantly enhanced and several binary and multi-component tellurite glasses can be easily prepared in the bulk form at moderate quenching rates of 102–103 K s−1.30 It is well known from the ambient pressure X-ray diffraction, neutron diffraction and Raman spectroscopy studies that the average Te–O co-ordination number in the tellurite network decreases steadily upon adding network modifier oxides due to the structural transformation: TeO4 → TeO3 + NBO.34–39 Neutron and X-ray diffraction, infrared and Raman spectroscopy are excellent techniques for investigating in situ changes in the glass short-range structure under extreme conditions of high pressures and high temperatures.13,40–42
The binary xBaO–(100 − x)TeO2 glasses are of interest due to their positive, negative and zero-stress optical coefficients.43,44 Barium tellurite glasses have applications in optical devices and in flat panel displays where even small amounts of birefringence due to external stress are an undesirable effect.45–47 Earlier, we had studied the short-range structure of xBaO–(100 − x)TeO2 (x = 10, 15 and 20 mol%) glasses by neutron diffraction and Raman spectroscopy at ambient pressure and its correlation with stress–optic properties.34 In the present study, the effects of pressure on the short range structure of 20BaO–80TeO2 glass have been studied in situ by high pressure neutron diffraction up to a maximum pressure of 9.0 ± 0.5 GPa. High pressure Raman spectroscopy studies up to a maximum pressure of 19.28 ± 0.01 GPa were also carried out under compression and decompression cycles.
2 Experimental
2.1 Glass preparation and density measurement
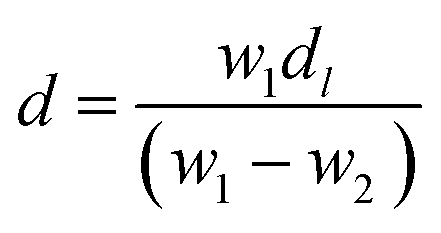
Barium tellurite glass of composition: xBaO–(100 − x)TeO2 (x = 20 mol%) was prepared by melt quenching using TeO2 (Aldrich India, 99%), BaCO3 (Central Drug House (CDH), India, 99.9%). Powders of TeO2 and BaCO3 were weighed to get the required composition and ground thoroughly in an agate mortar pestle for about 30 min and then transferred to a platinum (Pt) crucible. The batch mixture were melted in the Pt crucible at temperature of 800 °C for about 40 min in an electric furnace and the glass sample was prepared by normal quenching method in which the melt was poured on a heavy brass plate and disk shaped glass was prepared. The sample was annealed at 250 °C for 30 min immediately after its preparation to reduce thermal stresses, and then slowly cooled down to room temperature. Clear, bubble free dark brown colour glass sample was prepared.The density, d of glass was determined at ambient pressure (1 atmosphere) and laboratory temperature (25 °C) by Archimedes principle48 using dibutyl phthalate (DBP) as the immersion fluid. The weight of the sample in air, W1 and, its weight inside DBP, W2, were measured on an electronic balance with a precision of ±0.0001 g, density was calculated using the following relationship:
 | (1) |
2.2 High pressure neutron diffraction
The time-of-flight diffractometer PEARL at the ISIS pulsed neutron source was used to measure the high pressure neutron diffraction data up to a maximum pressure of 9.0 ± 0.5 GPa. The Paris–Edinburgh (PE) press along with sample container was mounted at the centre of instrument; the load was applied by a press. No pressure transmitting medium was used during in situ high pressure neutron diffraction studies and the pressure was directly applied on the sample. This was done in order the avoid background scattering peaks of the pressure transmitting material which makes the pair distribution function analysis difficult.49A standard annular Ti–Zr gasket assembly made from null alloy, TiZr (67![[thin space (1/6-em)]](https://www.rsc.org/images/entities/char_2009.gif) :33 molar ratio) was chosen as a sample container because of having negligible elastic neutron scattering cross-section.50 Neutron diffraction data was measured at ambient pressure, 3.0 ± 0.5 GPa, 6.5 ± 0.5 GPa and 9.0 ± 0.5 GPa under the compression cycle.
:33 molar ratio) was chosen as a sample container because of having negligible elastic neutron scattering cross-section.50 Neutron diffraction data was measured at ambient pressure, 3.0 ± 0.5 GPa, 6.5 ± 0.5 GPa and 9.0 ± 0.5 GPa under the compression cycle.
2.3 Reverse Monto Carlo (RMC) modelling
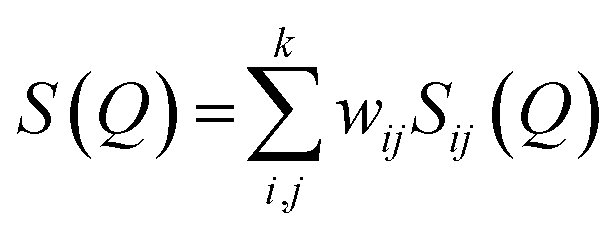
The experimental neutron structure factor, S(Q) at each pressure value was simulated by the RMC++ software package version 1.5.1 and the partial atomic pair correlation functions, coordination numbers and the bond-angle distributions were determined.51–53 The RMC method minimizes the squared difference between the experimental S(Q) and the calculated S(Q). The total neutron structure factor, S(Q) is given as:
 | (2) |
The neutron scattering weight factors, wij of the six atomic pairs (Table 1) in the glass structure were calculated as:34,35,54
 | (3) |
 | (4) |
| Atom pairs | Ba–Ba | Ba–Te | Ba–O | Te–Te | Te–O | O–O |
| Weighting factors, wij (%) | 0.39 | 3.54 | 8.13 | 8.10 | 37.19 | 42.65 |
The following RMC simulations steps were used to generate partial atomic pair correlation functions, bond lengths, co-ordination numbers and bond angle distributions:
000 atoms of Ba, Te and O in a box. The RMC model cubic box lengths at ambient pressure, and at pressure values of 3.0, 6.5 and 9.0 GPa were 55.248 Å, 54.904 Å, 54.346 Å, and 53.418 Å respectively.| Pressure | Cut-off values (Å) | |||||
|---|---|---|---|---|---|---|
| Ba–Ba | Ba–Te | Ba–O | Te–Te | Te–O | O–O | |
| Ambient | 3.12 | 2.95 | 2.45 | 2.85 | 1.61 | 2.35 |
| 3 ± 0.5 GPa | 3.12 | 2.95 | 2.45 | 2.85 | 1.59 | 2.35 |
| 6.5 ± 0.5 GPa | 3.12 | 2.95 | 2.45 | 2.85 | 1.58 | 2.35 |
| 9 ± 0.5 GPa | 3.12 | 2.95 | 2.45 | 2.85 | 1.62 | 2.35 |
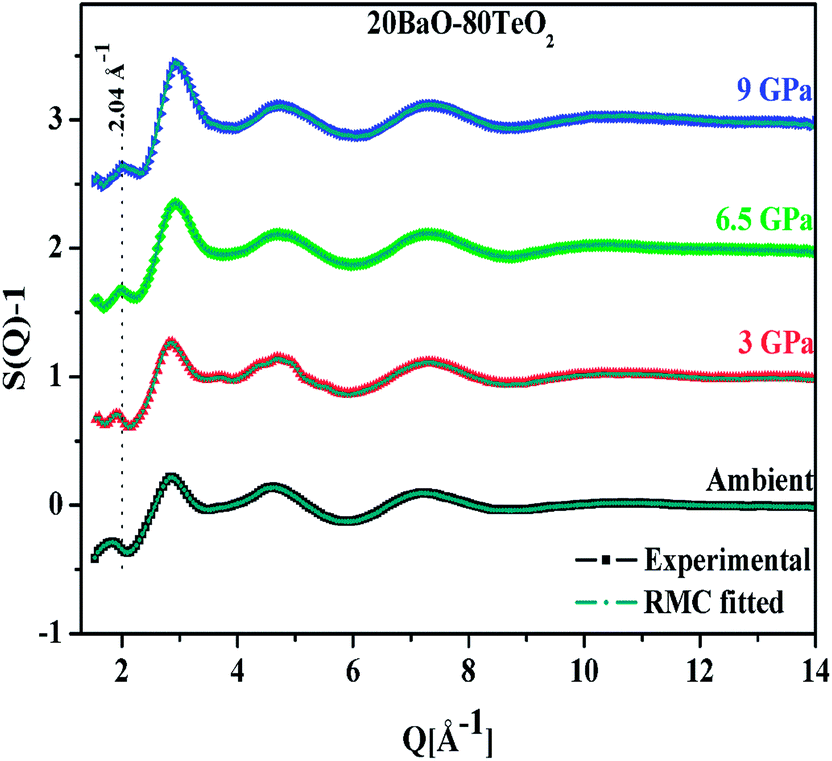 | ||
| Fig. 1 Experimental neutron diffraction and RMC calculated structure factors (S(Q) − 1) of 20BaO–80TeO2 glass at ambient and high pressures. The plots for pressures of 3.0, 6.5 and 9.0 GPa are shifted successively by 1 unit for clarity. The dotted line marks the FSDP position (2.04 Å−1) at the highest pressure of 9.0 GPa. | ||
2.4 In situ high pressure Raman spectroscopy
In situ high pressure Raman studies were carried out on the 20BaO–80TeO2 glass sample up to 19.28 ± 0.01 GPa in diamond-anvil cell (DAC). A small piece of glass sample was loaded between the two diamond culets along with small chip of ruby and pressure was applied. For complete hydrostatic compression, the sample was immersed in a 4:1 mixture of methanol and ethanol (pressure-transmitting medium).
The pressure inside the DAC was measured by the ruby fluorescence technique.58 Raman spectra were measured on LABRAM HR-800 micro-Raman spectrometer using He–Ne laser (633 nm) as an excitation source at a spectral resolution of 1 cm−1.
3 Results and discussion
3.1 High pressure glass atomic number density
An important characteristic feature of X-ray and neutron diffraction patterns of glasses is the position of the first sharp diffraction peak (FSDP) position, Q, which is closely related to the interatomic distances in the first co-ordination shell and the shift in FSDP has been used in the literature to calculate the atomic number density, ρ as a functions of pressure by certain empirical formula reported in the literature.59The position of the FSDP shifts towards higher Q-values with an increase in pressure from ambient to 9.0 ± 0.5 GPa [Fig. 2]. The ambient pressure atomic number density, ρo was calculated from the mass density (5.521 ± 0.004 g cm−3), measured by Archimedes method.34 Atomic number density of the 20BaO–80TeO2 glass at higher pressures was calculated from the position (Q-value) of FSDP by using the universal fractional power-law empirical relation59
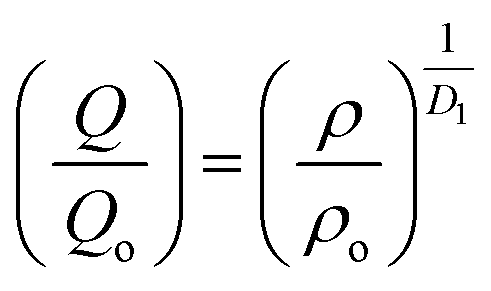 | (5) |
 | ||
| Fig. 2 Correlation between the First Sharp Diffraction Peak (FSDP) position, Q and atomic number density, ρ determined from an empirical formula [ref. 53] as a function of pressure in 20BaO–80TeO2 glass. | ||
Atomic number density increases from 0.0593 to 0.0656 Å−3 with increase in pressure from ambient to 9.0 GPa [Fig. 2]. The enhancement in the atomic density with pressure is due to the compression of glass structure by the modifications in the short-range and intermediate-range order, which produces changes in the intensity and position of FSDP in S(Q).
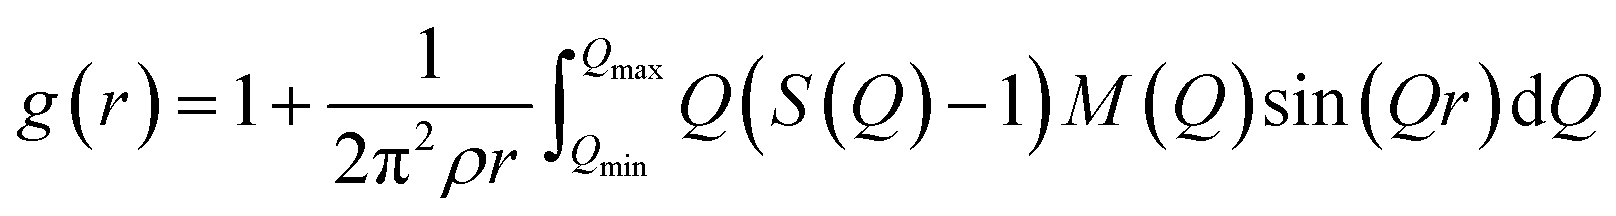
3.2 Atomic pair correlation functions by Fourier transformation
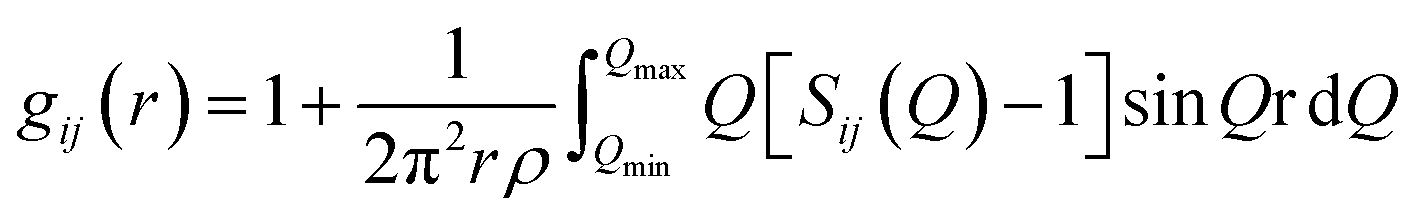
The atomic pair correlation functions, g(r) were calculated by the Fourier transformation of the reduced neutron structure factors, Q(S(Q) − 1) multiplied with the Lorch modification function:
 | (6) |
 | (7) |
 | (8) |
The first peak in the g(r) is due to the shorter Te–O equatorial bond lengths of 1.90 Å and the second peak at ∼2.7 Å is due to Ba–O and O–O pair correlations [Fig. 3].34 There is strong overlapping of Ba–O, Te–O and O–O pair correlations in g(r), which makes structural analysis by deconvolution difficult, therefore in order to get the structural property data at the atomic level, RMC simulations were performed to obtain the partial atomic pair correlations which directly give the values of Te–O, Ba–O and O–O bond lengths, cation–oxygen coordination numbers and bond angles distributions.
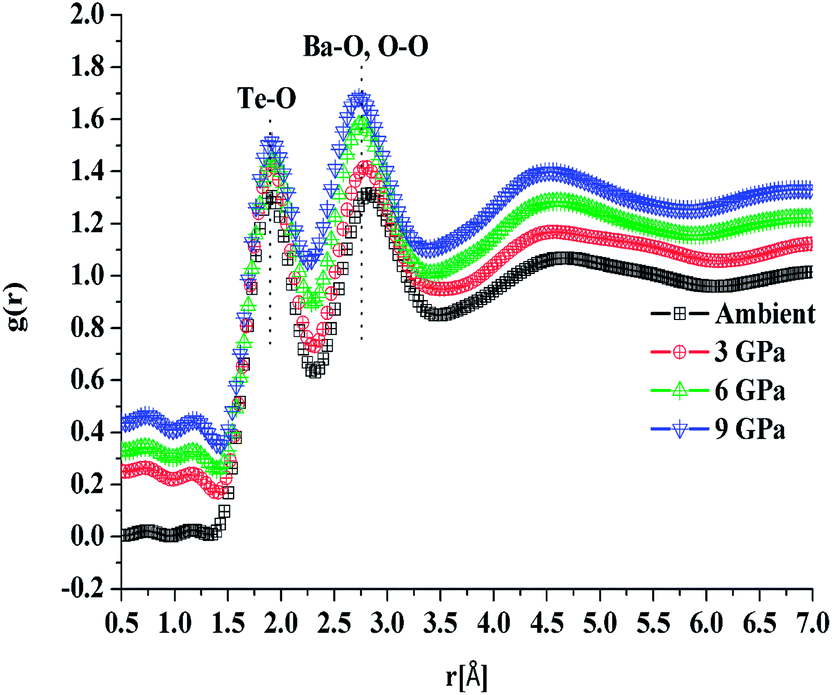 | ||
| Fig. 3 Atomic pair correlation function, g(r) of 20BaO–80TeO2 glass calculated from Fourier transformation. The curves for 3.0, 6.5 and 9.0 GPa are shifted by 0.05 units successively for clarity. | ||
3.3 Partial atomic pair correlations
Fig. 4a, b and c shows the atomic pair correlation functions of Ba–O, Te–O and O–O respectively as obtained from RMC simulations of the neutron diffraction datasets as a function of pressure. RMC analysis generates the six partial atomic pair correlation functions: gBa–Ba(r), gBa–Te(r), gBa–O(r), gTe–Te(r), gTe–O(r) and gO–O(r).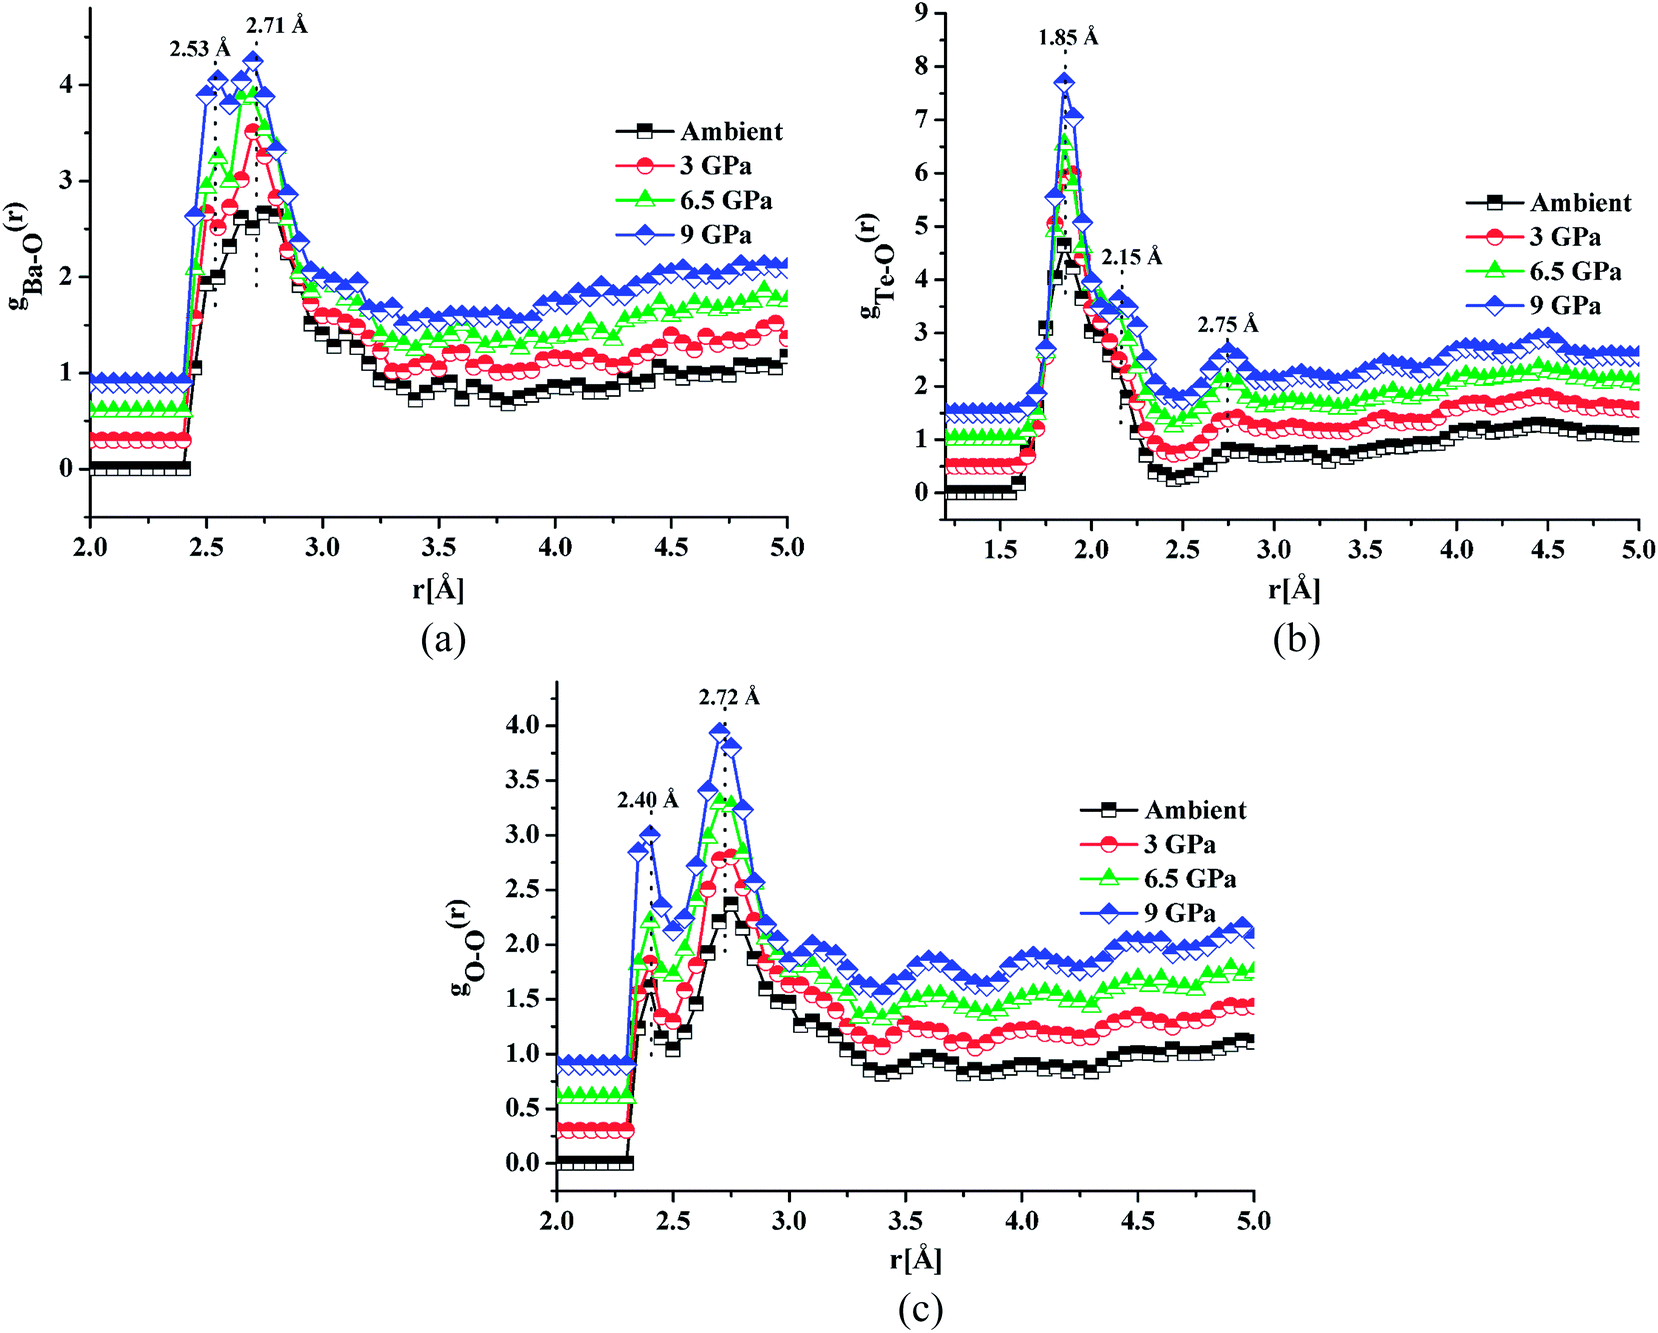 | ||
| Fig. 4 (a) Ba–O atomic pair correlation functions in 20BaO–80TeO2 glass as function of pressure (the curves for 3.0, 6.5 and 9.0 GPa are displaced by 0.3 units successively for clarity). (b) Te–O atomic pair correlation functions in 20BaO–80TeO2 glass as function of pressure (the curves for 3.0, 6.5 and 9.0 GPa are displaced by 0.5 units successively for clarity). (c) O–O atomic pair correlation functions in 20BaO–80TeO2 glass as function of pressure (the curves for 3.0, 6.5, and 9.0 GPa are displaced by 0.3 units successively for clarity). | ||
The partial atomic pair correlation functions gij(r) of 20BaO–80TeO2 glass at ambient pressure and at high pressures of 3.0 GPa, shows peaks of Ba–O, Te–O and O–O atomic pairs centred at 2.69 ± 0.02–2.73 ± 0.01 Å, 1.83 ± 0.02–1.88 ± 0.01 Å and 2.72 ± 0.01–2.74 ± 0.01 Å, respectively [Table 3]. In case of Ba–O pair correlation function, gBa–O(r), the peak at 2.69 ± 0.02 Å, becomes sharper and more prominent at the highest pressure of 9.0 ± 0.5 GPa [Fig. 4a], while in case of gTe–O(r), the first peak at 1.86 Å splits into two peaks at high pressures [Fig. 4b]. The partial atomic pair correlation functions for Ba–O and Te–O shows the shifting of the first peak towards smaller distances. However, compression also causes the formation of longer Te–O bonds and a decrease in the O–Te–O bond angles in the corner-sharing tbp units. A new peak at 2.55 ± 0.02 Å grows under compression due to the increase of Te–O coordination and formation of longer Te–O bonds. The Te–O pair partial correlation function shows at least two co-ordination shells, the first shell ends at 2.52 Å and the second at 2.99 Å.
| Pressure | Ambient | 3.0 ± 0.5 GPa | 6.0 ± 0.5 GPa | 9.0 ± 0.5 GPa | |
| Bond length, rij (Å) | Ba–O | 2.55, 2.73 | 2.50, 2.70 | 2.55, 2.69 | 2.53, 2.71 |
| Te–O | 1.86, 2.14, 2.75 | 1.88, 2.15, 2.76 | 1.83, 2.14, 2.74 | 1.85, 2.15, 2.75 | |
| O–O | 2.40, 2.74 | 2.40, 2.73 | 2.39, 2.73 | 2.40, 2.72 | |
3.4 Cation–oxygen co-ordinations
The values of coordination numbers, CNi–j that were obtained from the RMC simulations within a certain range of distances are summarized in Table 4 and co-ordination number distributions are shown in Fig. S1(a)–(c).† The average Ba–O co-ordination is in the range: 6.24 ± 0.48 (ambient pressure) to 6.99 ± 0.34 (9.0 ± 0.5 GPa) while the O–O co-ordination is in the range: 6.00 ± 0.05 (ambient pressure) to 6.69 ± 0.06 (9.0 ± 0.5 GPa) [Table 4].| Pressure | Co-ordination numbers from RMC simulations | ||
|---|---|---|---|
| NBa–O (2.33–3.36) | NTe–O (1.40–2.52, 2.99)a | NO–O (2.27–3.40) | |
| a Te–O coordination values CN1Te–O (rmin = 1.40 Å and rmax = 2.52 Å), CN2Te–O (rmin = 2.52 Å and rmax = 2.99 Å). CN1+2Te–O is the total Te–O coordination number(1.40–2.99 Å). | |||
| Ambient | 6.24 ± 0.48 | CN1Te–O = 3.51 ± 0.05 | 6.00 ± 0.05 |
| CN2Te–O = 1.13 ± 0.01 | |||
| CN1+2Te–O = 4.64 ± 0.06 | |||
| 3.0 ± 0.5 GPa | 6.49 ± 0.35 | CN1Te–O = 3.54 ± 0.01 | 6.09 ± 0.04 |
| CN2Te–O = 1.24 ± 0.02 | |||
| CN1+2Te–O = 4.78 ± 0.03 | |||
| 6.5 ± 0.5 GPa | 6.80 ± 0.29 | CN1Te–O = 3.61 ± 0.04 | 6.28 ± 0.06 |
| CN2Te–O = 1.43 ± 0.02 | |||
| CN1+2Te–O = 5.04 ± 0.06 | |||
| 9.0 ± 0.5 GPa | 6.99 ± 0.34 | CN1Te–O = 3.73 ± 0.01 | 6.69 ± 0.06 |
| CN2Te–O = 1.45 ± 0.04 | |||
| CN1+2Te–O = 5.18 ± 0.05 | |||
Te–O co-ordination number (CNTe–O) was calculated as follows: for CN1Te–O, rmin = 1.40 Å and rmax = 2.52 Å was used, while for CN2Te–O, rmin = 2.52 Å and rmax = 2.99 Å were used. CN1+2Te–O gives the total Te–O coordination number in the full distance range: 1.40–2.99 Å (CN1+2Te–O = CN1Te–O and CN2Te–O). The values of CN1Te–O and CN2Te–O at high pressure are in the ranges: 3.51 ± 0.05–3.73 ± 0.01 and 1.13 ± 0.01–1.45 ± 0.04 respectively. The total Te–O coordination i.e. CNTe–O1+2 varies with pressure as follow: 4.64 ± 0.06 for ambient pressure, 4.78 ± 0.03 at 3.0 GPa, 5.04 ± 0.06 at 6.5 GPa and 5.18 ± 0.05 at 9.0 GPa [Table 4 and Fig. S1(b)].†
The increase in Te–O coordination is consistent with the formation of longer Te–O bonds (i.e. axial bonds) in the tellurite glass network. The application of pressure produces densification by two mechanisms; the first one is the distortion of TeO4 structural units and second is the gradual increase in the average coordination number (CNBa–O, CNTe–O and CNO–O) which produces an increase in the atomic number density. An increase in Te–O coordination with pressure up to 9.0 GPa is also supported by in situ high pressure Raman studies that were performed up to a maximum pressure of 19.28 ± 0.01 GPa (discussed below).
The bond lengths [Table 3] and changes in Te–O coordination [Table 4] are similar to the findings of high pressure studies on silicate and borate glasses.65–67 It is reported that in aluminium silicate glasses quenched from high pressure melts, the average Si and Al co-ordination number with oxygens increases steadily to values greater than four with increase in pressure.67 Bista et al.65 studied changes in the short-range structure of calcium aluminium borosilicate glasses prepared by quenching its melt near the glass transition temperatures at in situ pressures of 1.5–3.0 GPa. It was found that with the increase in pressure, both aluminium and boron coordination numbers increased significantly. Aluminosilicate glasses and melts quenched from high pressure (12 GPa) show similar enhancement in the Al–O coordination number with pressure. Lee et al.66 carried out inelastic X-ray scattering studies on glassy B2O3 under compression and decompression cycles and found a continuous transformation from tri-coordinated (3B) to tetra-coordinated (4B) boron units with pressure. John et al.68 simulations suggested that a change in Si–O coordination in glassy SiO2 occurs at pressures higher than 14–17 GPa, and that at pressure of 30 GPa, the Si–O coordination number is 6 as compared to the value of 4 under ambient conditions. Lee et al.69 studied the structure of lithium borate glasses up to 30 GPa by in situ boron K-edge inelastic X-ray scattering and by 11B MAS-NMR studies up to 6 GPa (ref. 70) and found that boron–oxygen coordination transforms from three to four on applying pressure.
3.5 Bond angle distributions
The bond angle distribution is defined as the number of angles between the two vectors joining a central atom. The possible angles between the chemical linkages in the 20BaO–80TeO2 glass structure were calculated by the RMC simulations and the results are given in Table 5. The bond angle distributions of θO–Ba–O, θO–Te–O and θO–O–O, were obtained from the final atomic configuration files of the RMC runs.| Pressure | Ambient | 3.0 ± 0.5 | 6.0 ± 0.5 | 9 ± 0.5 (GPa) | |
| Bond angle, θij (o) | O–Ba–O | 57.4 ± 0.7° | 57.9 ± 0.7° | 56.1 ± 0.9° | 56.4 ± 0.9° |
| O–Te–O | 87.0 ± 0.4° | 86.2 ± 0.1° | 85.4 ± 0.3° | 83.6 ± 0.1° | |
| O–O–O | 56.1 ± 0.9° | 58.6 ± 0.9° | 56.1 ± 0.6° | 56.8 ± 0.3° | |
For θO–Ba–O, the peak is centred at 57.4 ± 0.7°, 57.9 ± 0.7°, 56.1 ± 0.9° and 56.4 ± 0.9° for ambient, 3.0 ± 0.5 GPa, 6.5 ± 0.5 GPa and 9 ± 0.5 GPa pressures respectively [Table 5 and Fig. S2(a)†]. Similarly, θO–Te–O bond-angle distribution shows the decreasing trend with pressure i.e. peak shifts towards lower angles with maxima at 87.0 ± 0.4°, 86.2 ± 0.1°, 85.4 ± 0.3° and 83.6 ± 0.1° for ambient, 3.0, 6.5 and 9.0 GPa pressures respectively [Fig. S2(b)†]. θO–O–O bond angle distributions are centered at 56.1 ± 0.9°, 58.6 ± 0.9°, 56.1 ± 0.6° and 56.8 ± 0.3° for ambient, 3.0, 6.5 and 9.0 GPa pressures respectively [Table 5 and Fig. S2(c)].†
According to molecular dynamics simulations, there are two different peaks of θO–Te–O bond angle distribution; the first peak lies in the range: 70° to 105° and is attributed to both Oeq–Te–Oax (equatorial and axial) and Oeq–Te–Oeq (equatorial) linkages while the second weaker peak in the higher angle range: 150–170° is due to Oax–Te–Oax (axial) linkages.71 The maxima at 83.6 ± 0.1° in θO–Te–O distribution [Fig. S2(b)†], indicates that the majority of the linkages are of the types: Oeq–Te–Oeq and Oeq–Te–Oax in the TeO4 and TeO3 structural units.32
The O–O–O bond angle has both intra-polyhedral and inter-polyhedral contributions; the peak at 56–60° is due to three O atoms in the same tetrahedra and/or due to three O atoms in the same penta coordinated polyhedral and the peak at 110° could arise either due to oxygen atoms on either the same or adjacent penta or hexa coordinated polyhedra; and the peak at 120° can arise due to inter-polyhedral contributions from tetra or penta coordinated Te–O polyhedral units. The RMC configuration files were used to generate three dimensional models of the cubic cell containing 500 atoms on Ba, Te and O and these are shown in at ambient pressure in Fig. 5a and at 9.0 GPa in Fig. 5b. It is clear from these models that the network connectivity of Te and B with oxygen enhances considerably under compression.
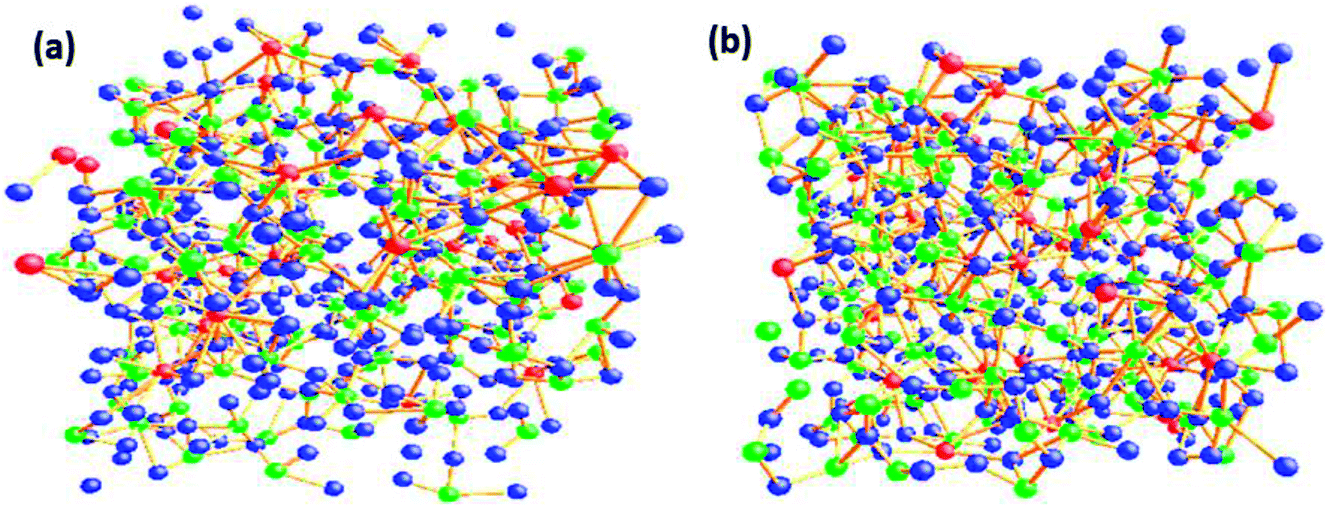 | ||
| Fig. 5 RMC models of the structure of barium tellurite glass cubic cell (a) ambient pressure-cell parameter 20.34 Å (b) 9.0 GPa-cell parameter 19.83 Å. The cubic cell consists of 500 atoms of Te (green), Ba (red) and oxygen (blue). | ||
3.6 Te–O speciation by high pressure in situ Raman spectroscopy
In situ high pressure Raman studies of 20BaO–80TeO2 glass were carried out in a DAC up to maximum pressure of 19.28 ± 0.01 GPa under both the compression and decompression cycles. Fig. 6 shows the Raman spectra of 20BaO–80TeO2 glass at different pressures up to maximum pressure of 19.28 ± 0.01 GPa in the Raman shift range: 100 and 900 cm−1. In situ high pressure Raman spectra of barium tellurite glass shows three broad bands in the Raman shift ranges: 560 to 685 cm−1 due to the asymmetric Te–O bond vibrations in TeO4 units,67 while the band from 685 to 820 cm−1 is due to Te–O stretching vibrations in TeO3/TeO3+1 units. The Raman bands at 410 to 560 cm−1 are due to the bending modes of O–Te–O and Te–O–Te linkages.72,73 The 4:1 methanol–ethanol mixture vibration band at ∼820 cm−1 is also clearly seen in Raman spectra up to a pressure of 4.05 ± 0.01 GPa.74 The band around 410–560 cm−1 is assigned to symmetrical vibrations of Te–O–Te bonds at the corner-sharing sites of TeO3+1, TeO3 and TeO4 polyhedra. Fig. 6 shows that the low frequency band at ∼286 cm−1, and the Raman band of 410–560 cm−1 gets significantly suppressed with increase in pressure, this band is completely suppressed at the highest pressure of 19.28 GPa. The suppression of this band arises due to the breakage of the tellurite network with pressure.
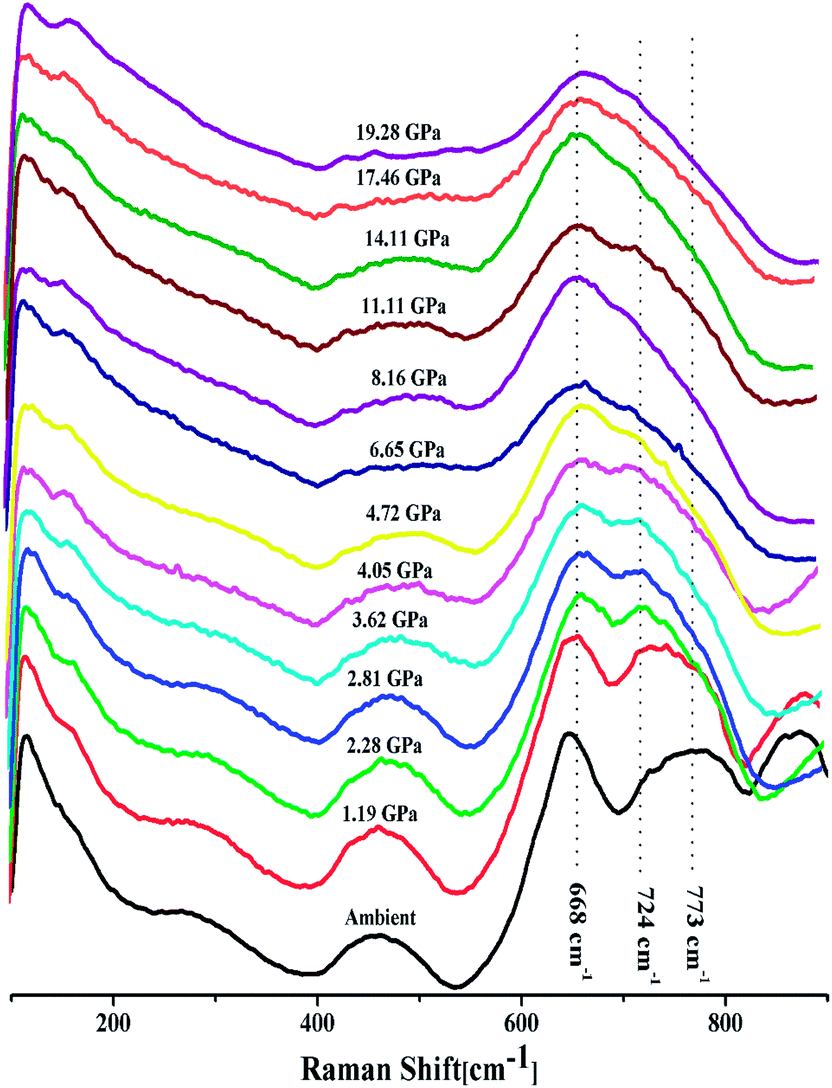 | ||
| Fig. 6 In situ high pressure Raman spectra of 20BaO–80TeO2 glass up to a maximum pressure of 19.28 GPa during compression cycle. | ||
Further on increasing the pressure up to 19.28 GPa, the intensity of bands at ∼724 cm−1 due to Te–O bond vibrations in TeO3 units decreases significantly relative to the intensity of the band at ∼660 cm−1, these changes confirm the structural transformation: TeO3 + NBO → TeO4 and it is similar to the structural transformations in borate glasses; BO3 + NBO → BO4 with pressure.66,69,70
Fig. 7 shows the Raman spectra of 20BaO–80TeO2 glass in the decompression cycle: 19.28 GPa → 6.06 GPa → 2.73 GPa → 0.08 GPa → ambient pressure. Under the decompression cycle, the Raman spectra restores back to the original spectra. The band of 344 cm−1 and 450–550 cm−1 reappears, and the high frequency band in the range: 560 to 820 cm−1 splits again into two distinct bands. The abrupt increase in the main Raman bands intensity and high frequency shoulder shows that the most dramatic change in the vibrational spectra takes place during the decompression cycle.
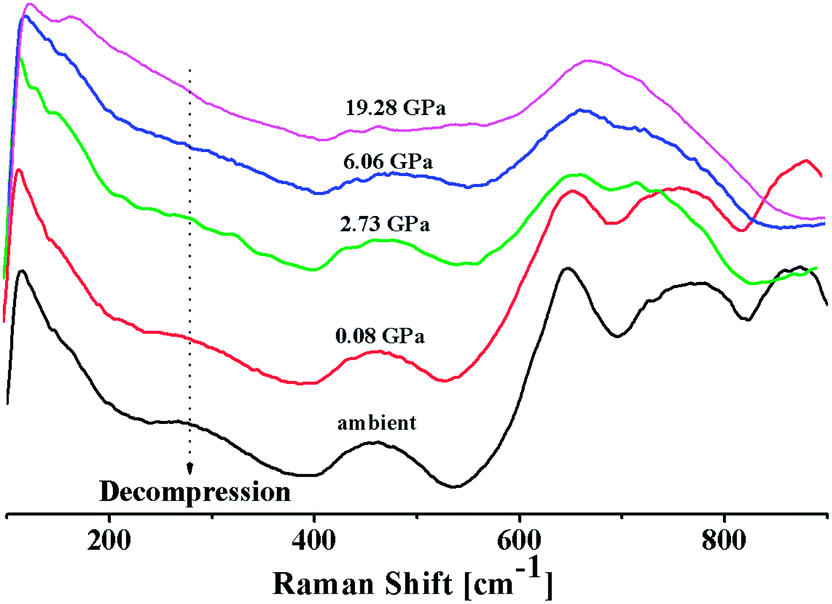 | ||
| Fig. 7 In situ high pressure Raman spectra of 20BaO–80TeO2 glass in the decompression cycle. | ||
The intensity ratio  of two main Raman peaks at ∼668 cm−1 (due to TeO4) and 724 cm−1 (due to TeO3) were calculated to determine the short-range structural transformations with pressure in both the compression and decompression cycles. The increase in Raman intensity ratio
 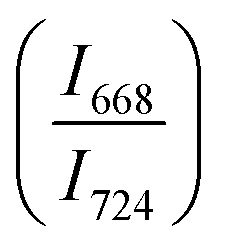 confirms that there is significant conversion of TeO3/TeO3+1 into TeO4 units [Table 6] on compression. The Raman intensity ratio
  increases from 0.99 to 1.18 when the glass sample is compressed up to 19.28 ± 0.01 GPa, and during the decompression cycle the intensity ratio shows the reverse trend [Table 6 & Fig. 7]. The decrease in the intensity ratio
  with pressure confirms that there is continued loss of the oxygen environment around Te ions on decompression.
 in 20BaO–80TeO2 glass under compression and decompression cycles
| Compression cycle pressure (GPa) (±0.01) | Raman peaks' intensity ratio I668/I724 | Decompression cycle pressure (GPa) (±0.01) | Raman peaks' intensity ratio I668/I724 (±0.01) |
|---|---|---|---|
| Ambient | 0.99 | 6.06 | 1.18 |
| 1.19 | 1.01 | 2.73 | 1.08 |
| 2.28 | 1.05 | 0.08 | 1.03 |
| 2.81 | 1.07 | Ambient | 0.99 |
| 3.62 | 1.09 | ||
| 4.05 | 1.05 | ||
| 4.72 | 1.17 | ||
| 6.65 | 1.22 | ||
| 8.16 | 1.23 | ||
| 11.11 | 1.16 | ||
| 14.11 | 1.23 | ||
| 17.46 | 1.18 | ||
| 19.28 | 1.18 |
4 Conclusions
The modification in the short-range structure of 20BaO–80TeO2 glass was studied in situ by high pressure neutron diffraction and high pressure Raman spectroscopy. Neutron diffraction studies were performed up to a maximum pressure of 9.0 ± 0.5 GPa on a Paris–Edinburg large volume press and it is found that the Te–O coordination number enhances significantly with pressure due to the isomerization reaction: TeO3 + NBO → TeO4. The results of in situ high pressure Raman spectroscopy are consistent with those of neutron diffraction and it is found that the ratio of intensities of Raman bands at 668 cm−1 and 724 cm−1 increases from a value of 0.99 to 1.18, with an increase in pressure up to 19.28 ± 0.01 GPa. Raman studies found that the TeO4 units transform back into TeO3 and the glass structure is restored to its original state at ambient pressure on the release of pressure.
Conflicts of interest
There are no conflicts to declare.Acknowledgements
Atul Khanna gratefully acknowledges the Science and Technology Facilities Council (STFC) for providing access to PEARL instrument beamtime at ISIS Neutron and Muon Facility, Rutherford Appleton Laboratory, Didcot, United Kingdom. Travel support to Atul Khanna and Hirdesh under Newton India program is acknowledged. Vasant G. Sathe of UGC-DAE-Consortium of Scientific Research, University Campus, Indore, India is thanked for his support and encouragement during high pressure Raman studies.References
- S. Kapoor, X. Guo, R. E. Youngman, C. L. Hogue, J. C. Mauro, S. J. Rzoska, M. Bockowski, L. R. Jensen and M. M. Smedskjaer, Phys. Rev. Appl., 2017, 7, 054011 CrossRef.
- K. Ramesh, N. Naresh and E. S. R. Gopal, Key Eng. Mater., 2016, 702, 43–47 Search PubMed.
- S. Kapoor, L. Wondraczek and M. M. Smedskjaer, Front. Mater. Sci., 2017, 4, 1 Search PubMed.
- P. S. Salmon and L. Huang, MRS Bull., 2017, 42, 734–737 CrossRef CAS.
- S. Bista, E. I. Morin and J. F. Stebbins, J. Chem. Phys., 2016, 144, 044502 CrossRef.
- R. M. Waxler and G. Cleek, J. Res. Natl. Bur. Stand., Sect. A, 1973, 77, 755 CrossRef CAS.
- G. Parthasarathy and E. Gopal, Bull. Mater. Sci., 1985, 7, 271–302 CrossRef CAS.
- C. Martinet, A. Kassir-Bodon, T. Deschamps, A. Cornet, S. Le Floch, V. Martinez and B. Champagnon, J. Phys.: Condens. Matter, 2015, 27, 325401 CrossRef CAS.
- M. M. Smedskjaer, R. E. Youngman, S. Striepe, M. Potuzak, U. Bauer, J. Deubener, H. Behrens, J. C. Mauro and Y. Yue, Sci. Rep., 2014, 4, 1–6 Search PubMed.
- M. N. Svenson, M. Guerette, L. Huang and M. M. Smedskjaer, J. Non-Cryst. Solids, 2016, 443, 130–135 CrossRef CAS.
- L. Wondraczek, S. Krolikowski and H. Behrens, J. Non-Cryst. Solids, 2010, 356, 1859–1862 CrossRef CAS.
- O. Ohtaka, A. Yoshiasa, H. Fukui, K. Murai, M. Okube, H. Takebe, Y. Katayama and W. Utsumi, J. Phys.: Condens. Matter, 2002, 14, 10521 CrossRef CAS.
- M. Guthrie, C. Tulk, C. Benmore, J. Xu, J. Yarger, D. Klug, J. Tse, H. Mao and R. Hemley, Phys. Rev. Lett., 2004, 93, 115502 CrossRef CAS.
- F. Yuan and L. Huang, Sci. Rep., 2014, 4, 5035 CrossRef CAS.
- S. Yoshida, J.-C. Sanglebœuf and T. Rouxel, J. Mater. Res., 2005, 20, 3404–3412 CrossRef CAS.
- M. M. Smedskjaer, S. J. Rzoska, M. Bockowski and J. C. Mauro, J. Chem. Phys., 2014, 140, 054511 CrossRef.
- S. Bista and J. F. Stebbins, Am. Mineral., 2017, 102, 1657–1666 CrossRef.
- J. Mackenzie, J. Am. Ceram. Soc., 1963, 46, 461–470 CrossRef.
- E. Chason and F. Spaepen, J. Appl. Phys., 1988, 64, 4435–4449 CrossRef.
- B. Velde and I. Kushiro, Earth Planet. Sci. Lett., 1978, 40, 137–140 CrossRef.
- Y. Inamura, M. Arai, M. Nakamura, T. Otomo, N. Kitamura, S. Bennington, A. Hannon and U. Buchenau, J. Non-Cryst. Solids, 2001, 293, 389–393 CrossRef.
- M. Guerette, M. R. Ackerson, J. Thomas, F. Yuan, E. B. Watson, D. Walker and L. Huang, Sci. Rep., 2015, 5, 1–10 Search PubMed.
- G. S. Murugan, E. Fargin, V. Rodriguez, F. Adamietz, M. Couzi, T. Buffeteau and P. Le Coustumer, J. Non-Cryst. Solids, 2004, 344, 158–166 CrossRef.
- R. F. Souza, M. A. Alencar, J. M. Hickmann, R. Kobayashi and L. R. Kassab, Appl. Phys. Lett., 2006, 89, 171917 CrossRef.
- Y. Chen, Q. Nie, T. Xu, S. Dai, X. Wang and X. Shen, J. Non-Cryst. Solids, 2008, 354, 3468–3472 CrossRef CAS.
- T. T. Fernandez, S. Eaton, G. Della Valle, R. M. Vazquez, M. Irannejad, G. Jose, A. Jha, G. Cerullo, R. Osellame and P. Laporta, Opt. Express, 2010, 18, 20289–20297 CrossRef.
- Hirdesh and A. Khanna, J. Lumin., 2018, 204, 319–326 CrossRef CAS.
- N. Kaur, A. Khanna, M. Fábián and S. Dutt, J. Non-Cryst. Solids, 2020, 119884 CrossRef CAS.
- P. Nandi, G. Jose, C. Jayakrishnan, S. Debbarma, K. Chalapathi, K. Alti, A. Dharmadhikari, J. Dharmadhikari and D. Mathur, Opt. Express, 2006, 14, 12145–12150 CrossRef CAS.
- R. A. El-Mallawany, Tellurite Glasses Handbook: Physical properties and data, CRC press, 2011 Search PubMed.
- E. R. Barney, A. C. Hannon, D. Holland, N. Umesaki, M. Tatsumisago, R. G. Orman and S. Feller, J. Phys. Chem. Lett., 2013, 4, 2312–2316 CrossRef CAS.
- A. Gulenko, O. Masson, A. Berghout, D. Hamani and P. Thomas, Phys. Chem. Chem. Phys., 2014, 16, 14150–14160 RSC.
- N. Tagiara, D. Palles, E. Simandiras, V. Psycharis, A. Kyritsis and E. Kamitsos, J. Non-Cryst. Solids, 2017, 457, 116–125 CrossRef.
- A. Kaur, A. Khanna and M. Fábián, Mater. Res. Express, 2018, 5, 065203 CrossRef.
- A. Kaur, Hirdesh, A. Khanna, M. Fábián, P. Krishna and A. Shinde, Mater. Res. Bull., 2019, 110, 239–246 CrossRef.
- R. Kaur, A. Khanna, Hirdesh, A.-C. Dippel, O. Gutowski, F. González and M. González-Barriuso, Acta Crystallographica, Section B: Structural Science, Crystal Engineering and Materials, 2020, 76, 108–121 CrossRef.
- A. Khanna, A. Kaur, M. Fábián, P. S. R. Krishna and A. B. Shinde, Mater. Res. Express, 2019, 6, 075211 CrossRef.
- N. Gupta, A. Khanna, Hirdesh, A.-C. Dippel and O. Gutowski, RSC Adv., 2020, 10, 13237–13251 RSC.
- V. Kozhukharov, S. Neov, I. Gerasimova and P. Mikula, J. Mater. Sci., 1986, 21, 1707–1714 CrossRef CAS.
- H. E. Fischer, A. C. Barnes and P. S. Salmon, Rep. Prog. Phys., 2005, 69, 233 CrossRef.
- S. K. Sharma, T. F. Cooney, Z. Wang and S. van der Laan, J. Raman Spectrosc., 1997, 28, 697–709 CrossRef CAS.
- O. L. Alderman, C. J. Benmore, S. Feller, E. I. Kamitsos, E. Simandiras, D. G. Liakos, M. Jesuit, M. Boyd, M. Packard and R. Weber, J. Phys. Chem. Lett., 2019, 11, 427–431 CrossRef.
- M. Guignard and J. Zwanziger, J. Non-Cryst. Solids, 2007, 353, 1662–1664 CrossRef CAS.
- M. Guignard, L. Albrecht and J. Zwanziger, Chem. Mater., 2007, 19, 286–290 CrossRef CAS.
- K. Kurosawa, K. Yamashita, T. Sowa and Y. Yamada, IEICE Trans. Electron., 2000, 83, 326–330 Search PubMed.
- K. Kusama, T. Matano, Y. Ohashi, M. Kobayashi and K. Nagamoto, Symposium Digest of Technical Papers, Blackwell Publishing Ltd., 2008, Oxford, UK, 39, pp. 1457–14600 Search PubMed.
- Y. S. Choi, J. U. Yun and S. E. Park, J. Non-Cryst. Solids, 2016, 431, 2–7 CrossRef CAS.
- M. Affatigato, Modern Glass Characterization, John Wiley & Sons, 2015, pp. 1–31 Search PubMed.
- P. S. Salmon and A. Zeidler, J. Phys.: Condens. Matter, 2015, 27, 133201 CrossRef.
- C. Bull, N. Funnell, M. Tucker, S. Hull, D. Francis and W. Marshall, High Pressure Res., 2016, 36, 493–511 CrossRef.
- G. Evrard and L. Pusztai, J. Phys.: Condens. Matter, 2005, 17, S1 CrossRef CAS.
- C. R. Müller, V. Kathriarachchi, M. Schuch, P. Maass and V. G. Petkov, Phys. Chem. Chem. Phys., 2010, 12, 10444–10451 RSC.
- O. Gereben, P. Jóvári, L. Temleitner and L. Pusztai, J. Optoelectron. Adv. Mater., 2007, 9, 3021 CAS.
- M. Fabian, P. Jovari, E. Svab, G. Mészáros, T. Proffen and E. Veress, J. Phys.: Condens. Matter, 2007, 19, 335209 CrossRef CAS.
- I. Kaban, P. Jóvári, W. Hoyer and E. Welter, J. Non-Cryst. Solids, 2007, 353, 2474–2478 CrossRef CAS.
- T. Egami and S. J. Billinge, Underneath the Bragg peaks: Structural analysis of complex materials, Elsevier, 2003 Search PubMed.
- V. Petkov and G. Yunchov, J. Phys.: Condens. Matter, 1996, 8, 1869 CrossRef CAS.
- K. Syassen, High Pressure Res., 2008, 28, 75–126 CrossRef CAS.
- Q. Zeng, Y. Kono, Y. Lin, Z. Zeng, J. Wang, S. V. Sinogeikin, C. Park, Y. Meng, W. Yang and H.-K. Mao, Phys. Rev. Lett., 2014, 112, 185502 CrossRef.
- D. Ma, A. D. Stoica and X.-L. Wang, Nat. Mater., 2009, 8, 30–34 CrossRef CAS.
- P. S. Salmon, Proc. R. Soc. London, Ser. A, 1994, 445, 351–365 CrossRef CAS.
- Y. Katayama and Y. Inamura, Nucl. Instrum. Methods Phys. Res., Sect. B, 2005, 238, 154–159 CrossRef CAS.
- E. Lorch, J. Phys. C: Solid State Phys., 1969, 2, 229 CrossRef.
- A. K. Soper and E. R. Barney, J. Appl. Crystallogr., 2012, 45, 1314–1317 CrossRef.
- S. Bista, J. F. Stebbins, J. Wu and T. M. Gross, J. Non-Cryst. Solids, 2017, 478, 50–57 CrossRef.
- S. K. Lee, P. J. Eng, H.-k. Mao, Y. Meng, M. Newville, M. Y. Hu and J. Shu, Nat. Mater., 2005, 4, 851 CrossRef.
- X. Xue, J. F. Stebbins, M. Kanzaki, P. F. McMillan and B. Poe, Am. Mineral., 1991, 76, 8–26 Search PubMed.
- S. T. John, D. D. Klug and Y. Le Page, Phys. Rev. B: Condens. Matter Mater. Phys., 1992, 46, 5933 CrossRef.
- S. K. Lee, P. J. Eng, H.-k. Mao, Y. Meng and J. Shu, Phys. Rev. Lett., 2007, 98, 105502 CrossRef.
- S. K. Lee, K. Mibe, Y. Fei, G. D. Cody and B. O. Mysen, Phys. Rev. Lett., 2005, 94, 165507 CrossRef.
- F. Pietrucci, S. Caravati and M. Bernasconi, Phys. Rev. B: Condens. Matter Mater. Phys., 2008, 78, 064203 CrossRef.
- J. Jackson, C. Smith, J. Massera, C. Rivero-Baleine, C. Bungay, L. Petit and K. Richardson, Opt. Express, 2009, 17, 9071–9079 CrossRef.
- V. Sokolov, V. Plotnichenko, V. Koltashev and I. Grishin, J. Non-Cryst. Solids, 2009, 355, 239–251 CrossRef.
- X. Wang, Z. Shen, S. Tang and M. Kuok, J. Appl. Phys., 1999, 85, 8011–8017 CrossRef.
Footnote |
| † Electronic supplementary information (ESI) available. See DOI: 10.1039/d0ra07867k |
| This journal is © The Royal Society of Chemistry 2020 |