
 Open Access Article
 This Open Access Article is licensed under a
 Creative Commons Attribution 3.0 Unported Licence
Possible dissolution mechanism of alkali lignin in lactic acid-choline chloride under mild conditions†
Zhuang Liu a,
Yi Hou*a,
Songqing Hub and
Youming Lia
a,
Yi Hou*a,
Songqing Hub and
Youming Lia
aState Key Laboratory of Pulp and Paper Engineering, South China University of Technology, Guangzhou 510640, P. R. China. E-mail: ceyhou@scut.edu.cn
bSchool of Food Science and Engineering, South China University of Technology, Guangzhou 510640, P. R. China
First published on 9th November 2020
Abstract
In this study, several representative deep eutectic solvents (DESs) were designed to evaluate the solubility for alkali lignin (AL). It was found that DESs with lactic acid (LA) as hydrogen bond donors (HBDs) had good solubility for AL, in which lactic acid(LA)![[thin space (1/6-em)]](https://www.rsc.org/images/entities/char_2009.gif) :choline chloride(ChCl) 10:1 showed excellent solubility with more than 17 wt% under a relatively mild condition of 60 °C. The results of gel permeation chromatography (GPC), FTIR and 1H and HSQC NMR spectroscopies revealed an important possible dissolution mechanism of AL in LA-ChCl, that is, AL could be depolymerized under the action of LA when dissolved in LA-ChCl. Then, a new connection would form between the phenolic groups on the lignin fragments and ChCl, which is similar to that between ChCl and LA in DES, leading to an increase in the molecule weight of lignin. The new connections could be easily broken under the action of heat (150 °C) or microwave to the redispersion of lignin fragments. The results would provide a theoretic base for the high-value application of lignin in bioresources.
:choline chloride(ChCl) 10:1 showed excellent solubility with more than 17 wt% under a relatively mild condition of 60 °C. The results of gel permeation chromatography (GPC), FTIR and 1H and HSQC NMR spectroscopies revealed an important possible dissolution mechanism of AL in LA-ChCl, that is, AL could be depolymerized under the action of LA when dissolved in LA-ChCl. Then, a new connection would form between the phenolic groups on the lignin fragments and ChCl, which is similar to that between ChCl and LA in DES, leading to an increase in the molecule weight of lignin. The new connections could be easily broken under the action of heat (150 °C) or microwave to the redispersion of lignin fragments. The results would provide a theoretic base for the high-value application of lignin in bioresources.
Introduction
Lignin, one of the three main components of lignocellulose, has continuously generated increasing interests.1 Despite its great potential to produce a wide range of chemicals, lignin remains severely underutilized because of weak solubility in most existing solvents.2 Therefore, it is critical to develop effective solvent systems for lignin dissolution. Several solvent systems such as ionic liquids (ILs)3–5 and organic solvent6 have been designed and used; however, some drawbacks, such as high cost, high viscosity and complex synthesis process of ILs, environmentally unfriendly and toxicity of organic solvents, still restrict the practical applications of these solvent systems.As an alternative to ionic liquids, deep eutectic solvents (DESs), which are composed of two or more hydrogen bond donors (HBDs) and hydrogen bond acceptors (HBAs), were designed by Abbott et al.7 The key properties of DESs are their low vapour pressure, high tunability and biodegradability based on their starting constituents. In addition, DESs can be prepared by simply heating a suitable HBD and HBA mixture, thus avoiding the use of expensive and toxic reagents and organic solvents in the preparation of ILs. Therefore, DESs have attracted increasing attention in various fields such as electrochemistry, separation, catalysis and extraction.8–10
In recent years, increasing attention has been paid to the application of DESs in biomass pretreatment;11–14 however, there are few studies on the application and mechanism of DESs in lignin dissolution.15 Maria et al.16 tested the solubility of lignin in more than 25 DESs, but none of them could be more than 15 wt%. J. G. Lynam et al.17 tested the solubility of AL in 5 DESs at 60 °C with the best solubility of 14 wt%. Therefore, it is necessary to find out a good DES suitable for alkali lignin and clarify its dissolution mechanism.
In this study, several representative deep eutectic solvents (DESs) were designed, and the solubility of these solvents for alkali lignin was tested. A microscope was used to observe the real state of the alkali lignin dissolving in these DESs. The composition analysis of lignin was assessed via gel permeation chromatography (GPC), and the structural characteristics were fully investigated via Fourier transform infrared spectroscopy (FT-IR) and 1H and 1H–13C correlation two dimensional (2D) heteronuclear single-quantum coherence (HSQC) nuclear magnetic resonance (NMR).
Experimental
Materials and methods
| HBD | HBA | Molar ratio |
|---|---|---|
| LA | ChCl | 2:1 |
| LA | ChCl | 10:1 |
| LA | Urea (U) | 2:1 |
| LA | U | 10:1 |
| Butanoic acid (BA) | ChCl | 2:1 |
| BA | ChCl | 10:1 |
| BA | U | 2:1 |
| BA | U | 10:1 |
 :ethanol, 9:1) into the solution of DES. Then, the DESL and DES were separated by centrifugation (6000 rpm). The segregated lignin was freeze-dried, while the separated liquid could be recycled after removing the water and ethanol at a low temperature of 50 °C for 24–48 h.
Characterization of AL and DESL
:1, v/v), and the mixture was stirred in dark at room temperature for 72 h. Ethanol (1 mL) was then added to the mixture, and most of the pyridine–acetic anhydride was removed by a rotary evaporator. The dried samples were washed with water and collected on a 10 μm Nylon membrane filter. The acetylated materials were dissolved in tetrahydrofuran (THF) and analyzed by GPC using a Waters (USA) instrument under the following chromatographic conditions: column, Waters HR5E; column temperature, 40 °C; eluent, THF; flow rate, 0.22 mL min−1; detector, 2414 refractive index detector.Results and discussion
The solubility of alkali lignin
The solubility of alkali lignin in various DESs is shown in Table 2. It can be seen from Table 2 that the solubility of AL was excellent with LA as HBD in DESs. It may be due to the fact that LA itself contains hydroxyl groups (Fig. 1a), which would increase the polarity of the solution system.20 Therefore, the solubility of alkali lignin in LA itself was good (16.48%). However, a pulping trial with lactic acid alone, which aimed to treat wood chips, had been implemented with a prolonged time of 48 h compared to another trial of 8 h with ChCl-LA DES.21 Besides, the boiling point of LA:ChCl in the ratio of 10:1 DES (more than 150 °C) was higher than that of LA (122 °C), which would be safer to benefit the application. LA-based DESs would be more suitable than LA to be a solvent for dissolving lignin and biomass pretreatment.
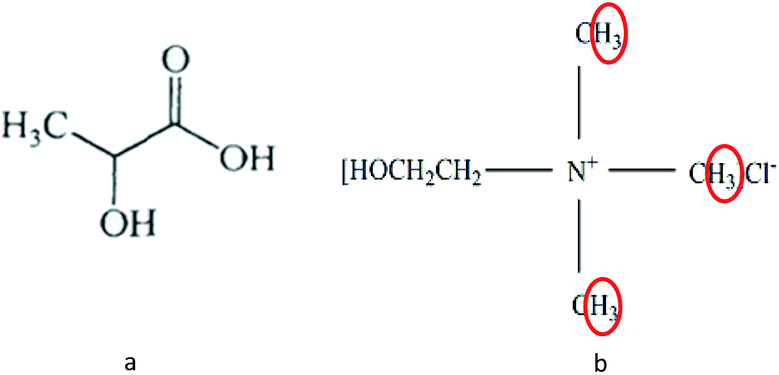 | ||
| Fig. 1 Structure of LA (a) and ChCl (b). | ||
It can be seen from Table 2 that among the tested and reported DESs,17 LA:ChCl in the ratio of 10:1 was an excellent solvent for AL and a commonly used DES for biomass pretreatment.12,22–24 Therefore, LA-ChCl (LA:ChCl 10:1) was chosen as the DES to dissolve AL.
Due to the dark color and high viscosity of the mixture, it was difficult for the naked eye to identify whether it was a suspension or a solution. Therefore, a sample was observed under a polarizing microscope to determine the real state of AL in DES. Fig. 2 shows the actual state of the alkali lignin in LA-ChCl, where we can see that AL completely dissolved in LA-ChCl.
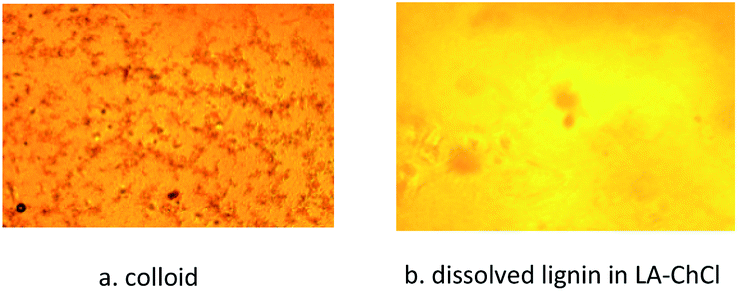 | ||
| Fig. 2 Colloidal and dissolved lignin in DESs under a microscope. | ||
Characterization and analysis of AL and various DESL
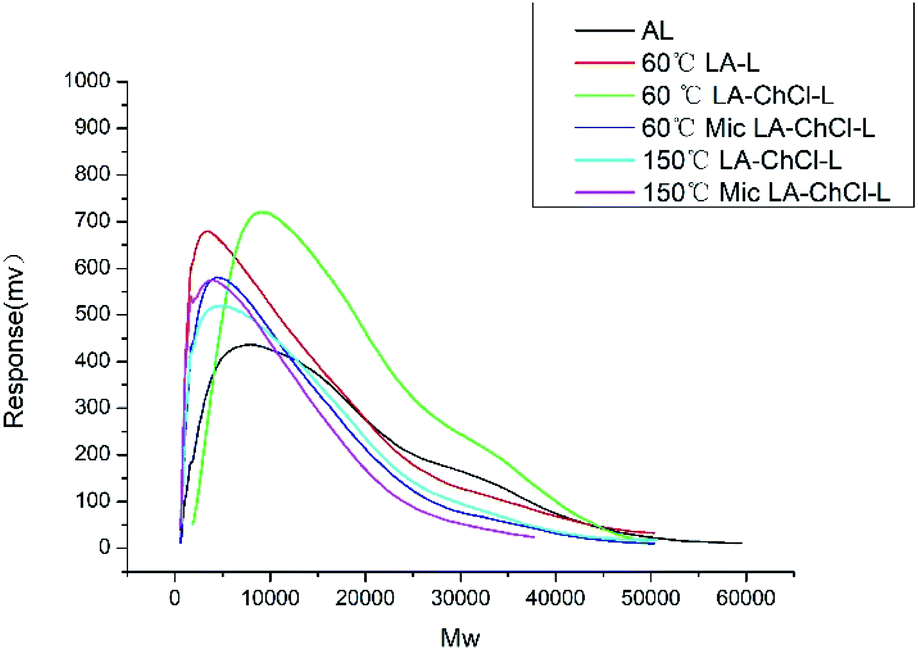 | ||
| Fig. 3 The Mw distribution of AL, 60 °C LA-L and lignin isolated from LA-ChCl on the condition of 60 °C, 60 °C with microwave, 150 °C and 150 °C with microwave. | ||
| Sample | 0–2000 | 2000–5000 | 5000–10000 |
10000+ |
Mn | Mw | PD |
|---|---|---|---|---|---|---|---|
| AL | 11.50 | 25.29 | 26.90 | 35.70 | 4328 | 9819 | 2.2687 |
| 60 °C LA-L | 23.60 | 31.80 | 23.00 | 21.60 | 2917 | 6879 | 2.3500 |
| 60 °C LA-ChCl-L | 0.270 | 17.21 | 34.25 | 48.30 | 7780 | 12053 |
1.5400 |
| 60 °C Mic LA-ChCl-L | 19.69 | 32.62 | 26.09 | 21.61 | 3200 | 6842 | 2.1381 |
| 150 °C LA-ChCl-L | 20.25 | 30.89 | 24.97 | 23.88 | 3233 | 7200 | 2.2270 |
| 150 °C Mic LA-ChCl-L | 26.448 | 32.37 | 23.96 | 17.306 | 2710 | 5823 | 2.1487 |
It can be see from Table 3 and Fig. 3 that the Mw distribution in the range of above 10000 and 5000–10000 of 60 °C LA-L decreased compared with AL, and on the contrary, the Mw distribution in the range below 2000 and 2000–5000 increased significantly, resulting in the significant decrease in the average Mw for 60 °C LA-L. This result suggested that the AL was depolymerized under the action of LA.
It was interesting to find that the Mw distribution of 60 °C LA-ChCl-L in the range of 5000–10000 and above increased significantly compared with 60 °C LA-L. On the contrary, the Mw distribution in the range below 2000 and 2000–5000 decreased, and the average Mw of 60 °C LA-ChCl-L increased. Besides, the polydispersity (PD) index values decreased clearly in 60 °C LA-ChCl-L, indicating more homogeneous molecular weight distribution in it.
Moreover, it is interesting to note that the Mw distribution of 60 °C Mic LA-ChCl-L and 150 °C LA-ChCl-L were found to be almost the same as that of 60 °C LA-L, and the average Mw of 150 °C Mic LA-ChCl-L was the smallest in the six researched lignin, indicating that the dissolution mechanism of AL in LA and LA-ChCl systems was different. ChCl played a special role in the dissolution process of AL in LA-ChCl, but this special effect was not stable and can be disintegrated by heating and external physical field.
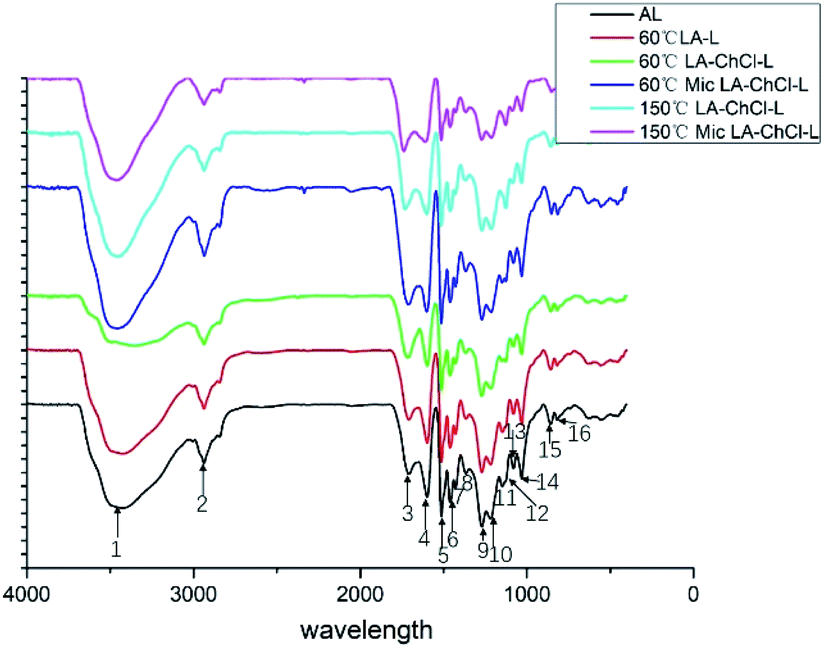 | ||
| Fig. 4 FTIR analysis of AL, 60 °C LA-L and lignin isolated from LA-ChCl on the condition of 60 °C, 60 °C with microwave, 150 °C and 150 °C with microwave. | ||
The absorption band at around 1712 cm−1 mainly correspond to the C![[double bond, length as m-dash]](https://www.rsc.org/images/entities/char_e001.gif) O stretching vibrations in non-conjugated ketones, carbonyls, and ester of lignin groups. The typical signals at 1600 cm−1, 1513 cm−1 and 1429 cm−1, which represent that aromatic skeleton vibrations all appeared. This indicated that the aromatic skeleton had been kept well in the dissolution process. It was found that the peaks at 1148 cm−1, 1032 cm−1, 855 cm−1 and 819 cm−1 corresponded to the signals G-unit that appeared evidently in all lignin, indicating that the G-unit was relatively stable.
O stretching vibrations in non-conjugated ketones, carbonyls, and ester of lignin groups. The typical signals at 1600 cm−1, 1513 cm−1 and 1429 cm−1, which represent that aromatic skeleton vibrations all appeared. This indicated that the aromatic skeleton had been kept well in the dissolution process. It was found that the peaks at 1148 cm−1, 1032 cm−1, 855 cm−1 and 819 cm−1 corresponded to the signals G-unit that appeared evidently in all lignin, indicating that the G-unit was relatively stable.
The peak at around 1259 cm−1, corresponding the C–O, C–O–C stretching vibration of lignin phenol and ether bond is mainly from the H-unit. The results suggested that all of the lignin showed the G- and H- units, and the signal of the S-unit did not show up, which was in line with the feature of softwood. The results showed that the main aromatic ring structure of lignin was effectively retained during the lignin dissolution process, which is conducive to the modification and high-value application of lignin in the later stage (Table 4).
| Number | Band cm−1 | Assignment |
|---|---|---|
| 1 | 3410 | O–H stretching vibration in hydroxyl |
| 2 | 2929 | C–H stretching vibration in methyl and methylene |
| 3 | 1712 | CO stretching (unconjugated) |
| 4 | 1602 | Aromatic skeletal vibration breathing with CO stretching |
| 5 | 1513 | Aromatic skeletal vibration |
| 6 | 1462 | C–H deformation asymmetric |
| 7 | 1429 | Aromatic skeletal vibrations combined with C–H in-plane deformation |
| 8 | 1367 | Phenolic OH and aliphatic C–H in methyl groups |
| 9 | 1259 | C–O, C–O–C stretching vibration of lignin phenol and ether bond |
| 10 | 1214 | C–C plus C–O plus CO stretch; G condensed > G etherified |
| 11 | 1148 | C–H in-plane deformation of G ring plus secondary alcohols plus CO stretch |
| 12 | 1126 | Ether-O- |
| 13 | 1081 | C–O deformation in secondary alcohols and aliphatic esters |
| 14 | 1032 | Aromatic C–H in-plane deformation (G > S) plus C–O deformation in primary alcohols plus CO stretch (unconjugated) |
| 15 | 855 | C–H out-of-plane in positions 2, 5 and 6 of G rings |
| 16 | 819 | C–H out-of-plane in positions 2, 5 and 6 of G rings |
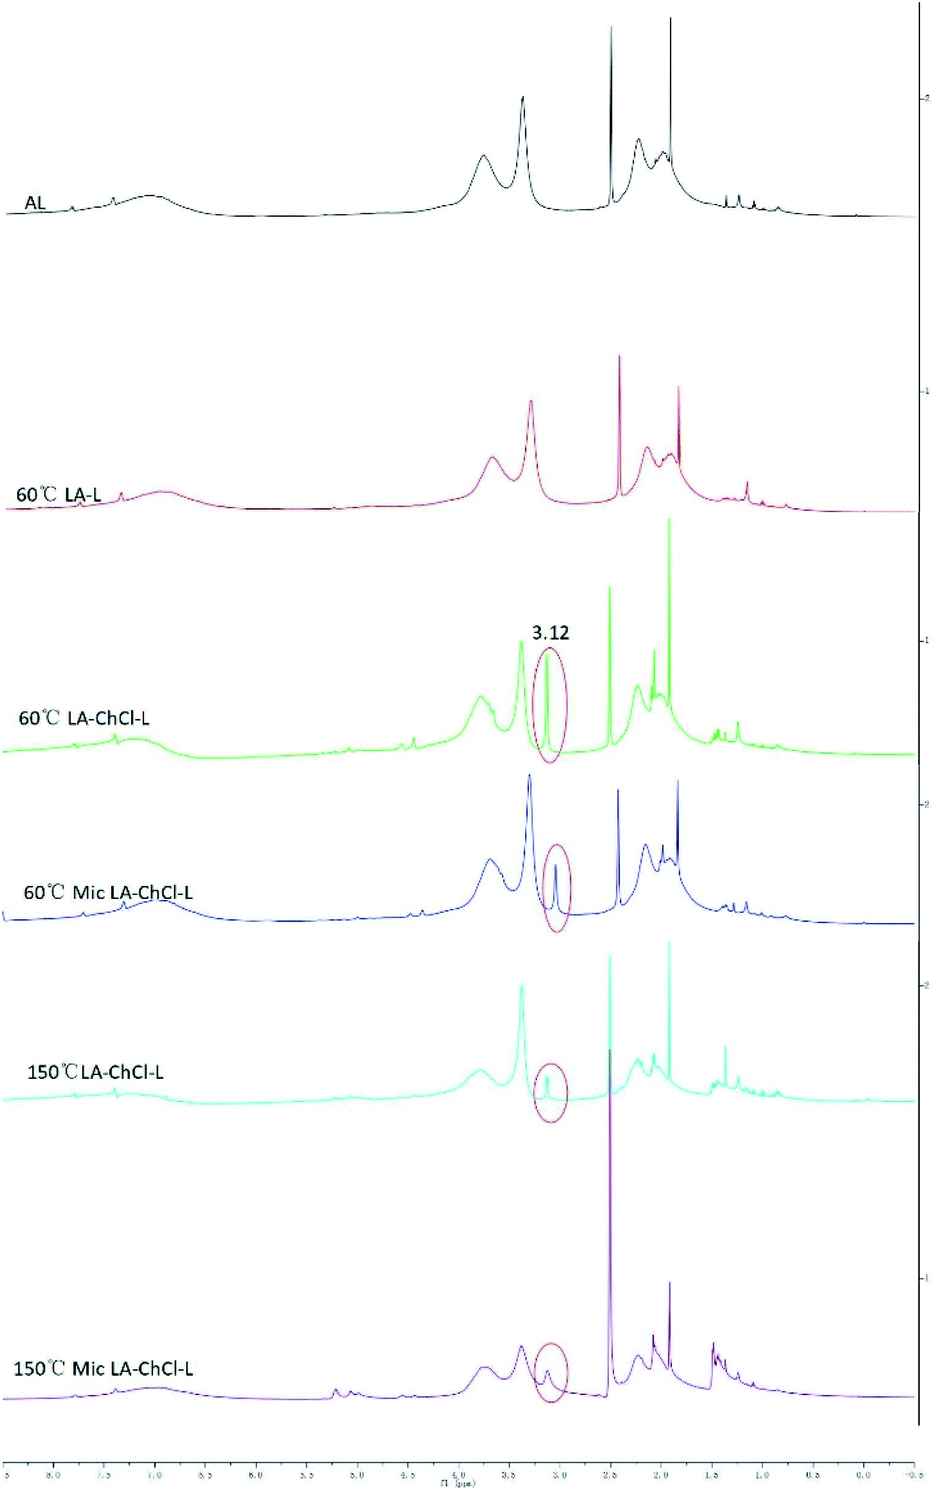 | ||
| Fig. 5 1H NMR spectra of AL, 60 °C LA-L and lignin isolated from LA-ChCl on the condition of 60 °C, 60 °C with microwave, 150 °C and 150 °C with microwave. | ||
| ppm | Proton type |
|---|---|
| 0.10–3.61 | Aliphatic side chain protons linked to benzene rings |
| 0.79–0.84 | Aliphatic protons |
| 1.21 | Protons on the alcohol hydroxyl group |
| 2.50 | DMSO-d6 |
| 3.12 | Protons on the nitromethyl group of ChCl |
| 3.51 | Protons in CH2 of side chain |
| 3.63–3.91 | Methoxy protons |
| 4.01–4.51 | Hydrogen proton at γ site (Hγ) in the structure of β-O-4 |
| 4.18–4.23 | Protons on the side chain (Cγ) of benzene rings |
| 4.56–4.61 | Hydrogen proton of α site (Hα) in β–β structure |
| 4.62–4.91 | Hydrogen proton of β site (Hβ) in β-O-4 structure |
| 4.88 | Protons on the side chain (Cβ) of benzene rings |
| 4.97 | Hydrogen proton of α site (Hα) in the β-O-4 structure |
| 4.99–5.33 | Protons in the structure of β-5 |
| 5.31 | Hydrogen proton of α site (Hα) in the β-5 structure |
| 5.71 | β-vinyl proton in β-O-4, β-1 structure |
| 6.05 | Protons on the side chain (Cα) in the β-O-4, β-1 structure |
| 6.10–8.00 | Protons on aromatic rings |
| 6.64–7.08 | Protons on guaiacyl aromatic rings |
| 7.25–7.62 | Protons on p-hydroxyphenyl aromatic rings |
| 8.00–11.50 | Protons on carboxyl and aldehyde groups |
The most important information shown in the 1H NMR spectra in Fig. 5 is the clear cut appearance of a new signal (3.12 ppm) at 60 °C LA-ChCl-L. Combined with the structure of ChCl (Fig. 1b) and the signal of nitromethyl in 1H NMR spectra (about 3.0 ppm), we can infer that the new signal was due to nitromethyl in ChCl with 9 equivalent hydrogens, and these results suggested that AL might be attached to ChCl when it dissolved in LA-ChCl at 60 °C. However, with the increase in the temperature or the addition of microwave, the connections became weaker, which indicates that the bonding strength between AL and ChCl was not strong, and that heat or microwave can break these connections.
2D-HSQC NMR shows an essential structure characterization of the lignin, including unit linkages and unit types. Fig. 6 and 7 shows the spectra of studied lignin in aliphatic regions (δC/δH 50 to 90/2.5 to 6.0) and aromatic regions (δC/δH 100 to 135/5.5 to 8.5). The detailed cross signal assignments in the HSQC NMR spectra are shown in Table 6, and the substructures are observed in the HSQC NMR spectra in Fig. 8.
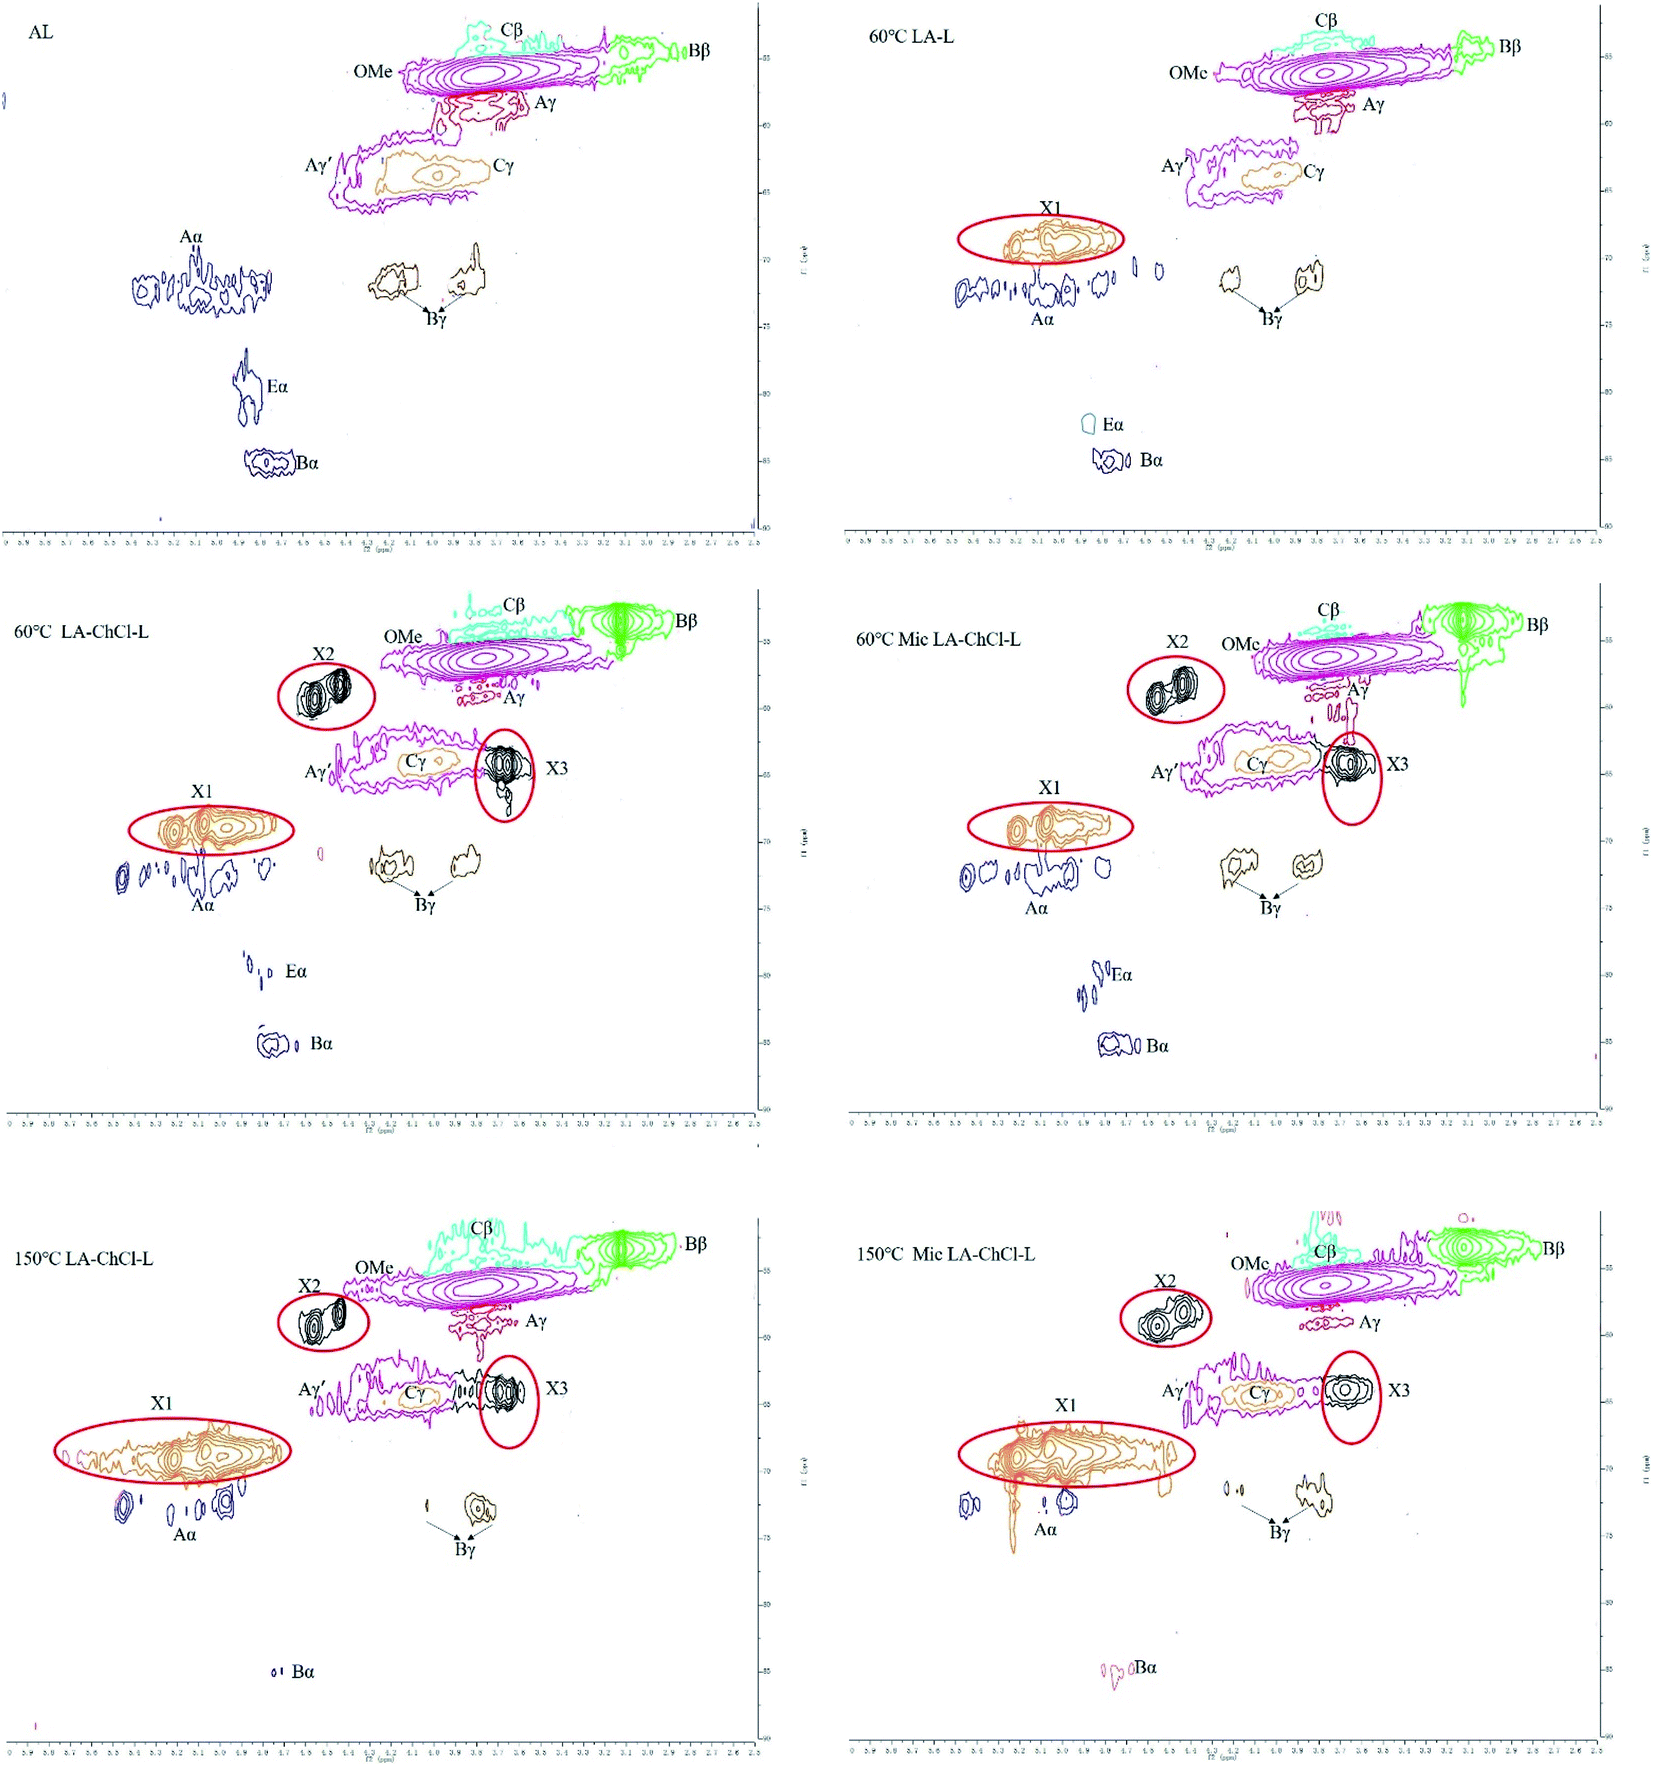 | ||
| Fig. 6 HSQC spectra of AL and various lignin treated on the condition of 60 °C, 60 °C with microwave, 150 °C and 150 °C with microwave, aliphatic regions (δC/δH 50 to 90/2.5 to 6.0). | ||
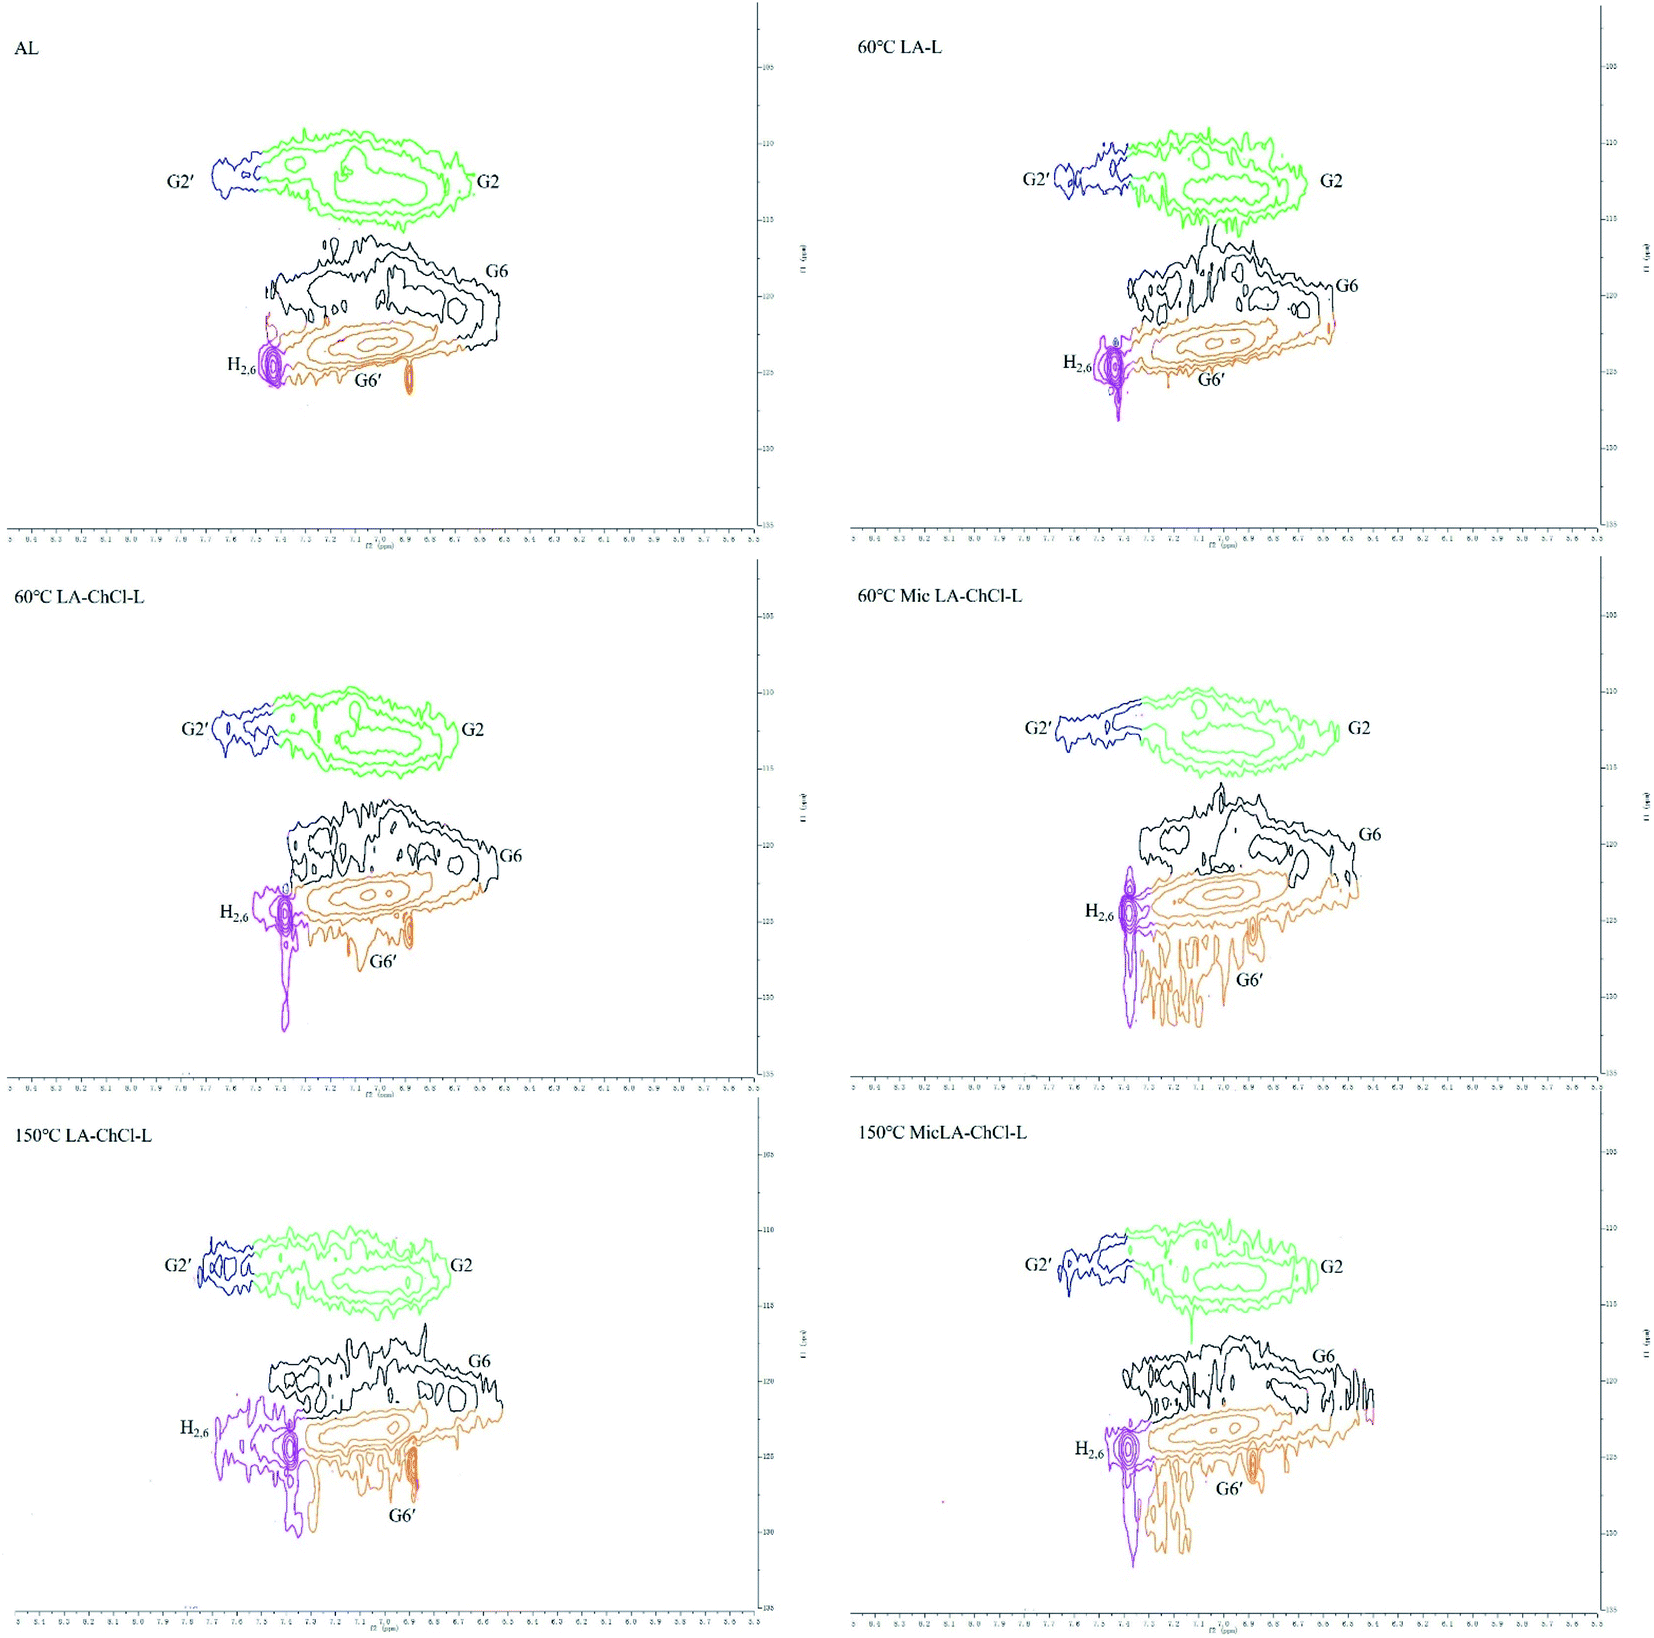 | ||
| Fig. 7 HSQC spectra of AL and various lignin treated on the condition of 60 °C, 60 °C with microwave, 150 °C and 150 °C with microwave, aromatic regions (δC/δH 100 to 135/5.5 to 8.5). | ||
| Labels | δC/δH (ppm) | Assignment |
|---|---|---|
| MeO | 56.23/3.77 | C–H, methoxyls (MeO) |
| Aα | 72.43/4.99 | Cα–Hα, β-O-4′(A) |
| Aγ | 58.49/3.79 | Cγ–Hγ, β-O-4′(A) |
| Aγ′ | 63.11/4.33 | Cγ–Hγ, of γ acylated β-O-4′(A) |
| Bα | 85.25/4.77 | Cα–Hα, resinol (B) |
| Bβ | 53.48/3.13 | Cβ–Hβ, resinol (B) |
| Bγ | (71.93/3.86) (71.86/4.20) | Cγ–Hγ, resinol (B) |
| Cβ | 53.92/3.66 | Cβ–Hβ, phenylcoumaran (C) |
| Cγ | 63.83/3.98 | Cγ–Hγ, phenylcoumaran (C) |
| Eα | 80.12/4.88 | Cα–Hα, spirodienone (E) |
| G2 | 111.9/6.99 | C2–H2, G units (G) |
| G2′ | 112.69/7.61 | C2–H2, oxidized (CαO) G units (G′) |
| G6 | 120.06/6.93 | C6–H6, G units (G) |
| G6′ | 123.07/7.01 | C6–H6, oxidized (CαO) G units (G′) |
| H2,6 | 124.69/7.43 | C2,6–H2,6, p-hydroxyphenyl (H) |
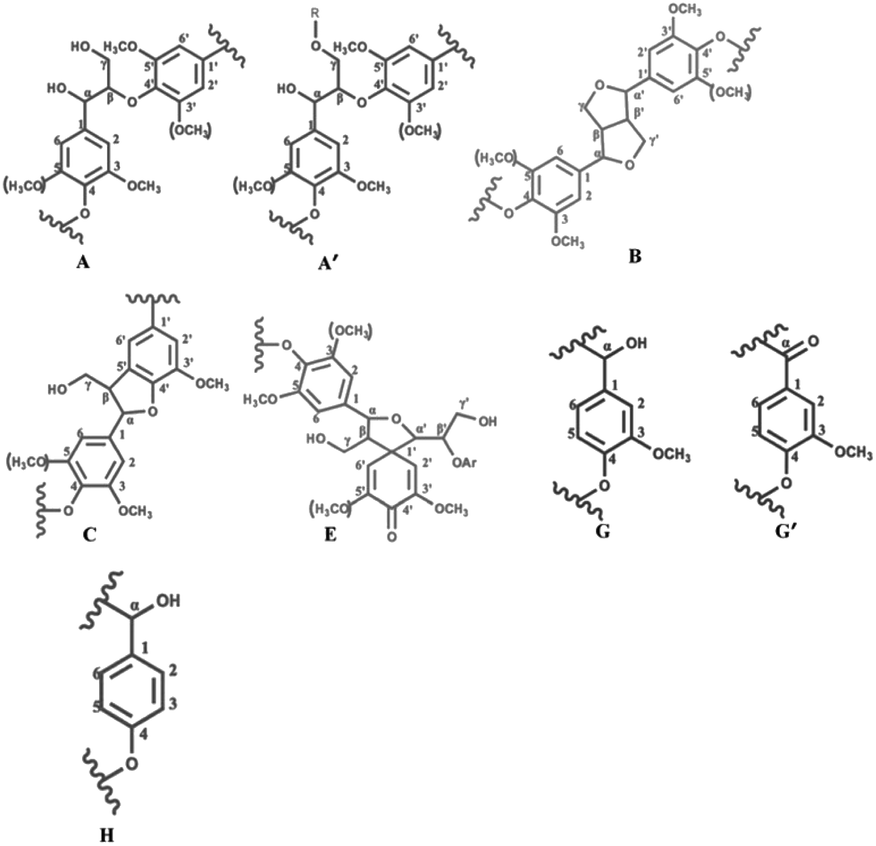 | ||
| Fig. 8 Main structure found in the lignin studied: (A) β-O-4′ aryl ether linkages with free –OH at the γ-carbon; (A′) β-O-4′ aryl ether linkages with acetylated and/or p-hydroxybenzoated-OH at γ-carbon; (B) resinol substructure formed by β–β′, α-O-β′ and γ-O-α′ linkages; (C) phenylcoumarane substructures formed by β-5′ and α-O-4 linkages; (E) spirodienone substructures formed by β-1′ and α-O-α′ linkages. | ||
The HSQC NMR spectra of the aromatic regions in AL, 60 °C LA-L and 60 °C LA-ChCl-L are almost the same, indicating that the structure of lignin in aromatic regions was not influenced. The typical signals of the G and H unit appeared clearly, whereas the signal of S unit did not appear, which is in line with the FT-IR analysis and the feature of softwood.
In aliphatic regions, compared with AL, a new signal (X1, δC/δH 69.08/5.20,68.54/5.07 and 68.84/4.97) appeared in 60 °C LA-L, which may belong to the C–H in LA. Moreover, it is interesting to note that two new signals (X2, δC/δH 59.35/4.55 and 58.26/4.44; X3,64.01/3.69 and 64.13/3.65) appeared, which may belong to the C–H in ChCl, indicating that AL was attached by ChCl and LA when dissolved in LA-ChCl at 60 °C, which is in line with the 1H NMR analysis.
In addition, it also can be seen from Fig. 6 that the signal strength of the signal, which represented the β-O-4 bond (Aα, Aγ and Aγ′), became weaker in 60 °C LA-L and 60 °C LA-ChCl-L, particularly in 60 °C LA-ChCl-L, which indicated that the β-O-4 bond in 60 °C LA-L and 60 °C LA-ChCl-L was partly broken and that the lignin was depolymerized in the LA solvent, which was in line with the result of the GPC analysis for the decrease of Mw.
As for the 60 °C LA-ChCl-L, when AL was dissolved in LA-ChCl at 60 °C, it was depolymerized under the action of LA, thus leading to more cleavage of the β-O-4 bond in acidic DES (Fig. 9),13 and the ChCl in DES may have bonded with phenolic groups on the lignin,13,27 as previous researches reported. Therefore, the depolymerized lignin fragments would gather again under the action of ChCl, as shown in Fig. 10. This is a good explanation for the results of the GPC analysis that the average Mw of 60 °C LA-ChCl-L increased obviously, and the lignin content of small components decreased, while the whole Mw distribution became more concentrated.
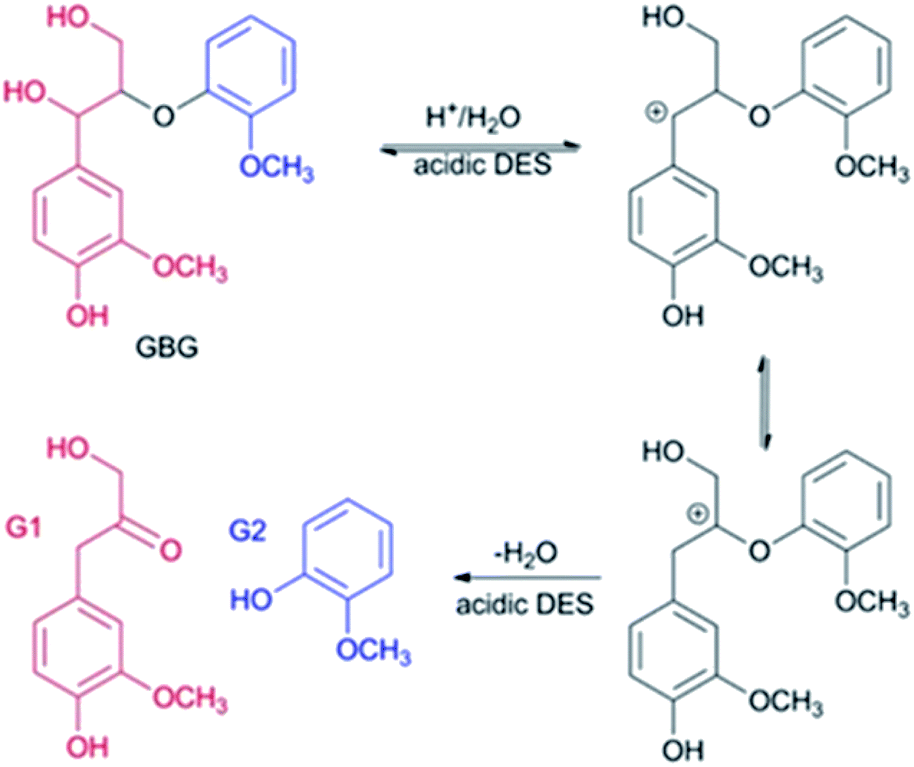 | ||
| Fig. 9 Possible mechanism of the selective cleavage of β-O-4 bond of lignin model compounds in acidic DES. GBG: guaiacylglycerol-β-guaiacyl ether. | ||
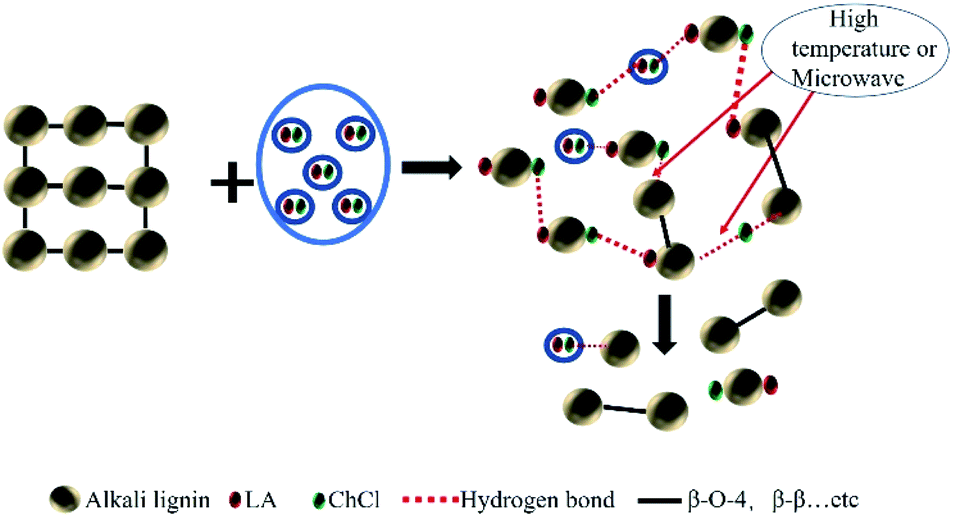 | ||
| Fig. 10 Possible dissolution mechanism of alkali lignin in LA-ChCl. | ||
It can be seen from the GPC analysis that the Mw distribution of 60 °C Mic LA-ChCl-L, 150 °C LA-ChCl-L and 150 °C Mic LA-ChCl-L decreased significantly compared with that of 60 °C LA-ChCl-L. The new signal (3.12 ppm) in 1H spectra, which appeared in the 60 °C LA-ChCl-L, appeared and became weaker in 60 °C Mic LA-ChCl-L, 150 °C LA-ChCl-L and 150 °C Mic LA-ChCl-L. As for the HSQC NMR analysis, the new signals (X2, X3) that appeared after the addition of ChCl, also appeared and became weaker in 60 °C Mic LA-ChCl-L, 150 °C LA-ChCl-L and 150 °C Mic LA-ChCl-L. All these results suggested that the connection between ChCl and phenolic groups on lignin was broken in parts, and the accumulated lignin fragments were redistributed under the action of heat and microwave, as shown in Fig. 10. In addition, the aromatic regions were nearly not influenced under the effect of high temperature and microwave based on the fact that all six lignin showed the same HSQC spectra in the aromatic regions.
Conclusions
1. Compared with others tested and reported DESs, LA:ChCl in the ratio of 10:1 was an excellent solvent for AL, in which the solubility of AL was more than 17 wt% under a mild condition (60 °C).
2. By analyzing the structure of dissolved lignin, it was found that the AL was depolymerized due to the breakage of the β-O-4 bond, and the main structure of the aromatic regions of dissolved lignin was not changed.
3. The hydroxyl group of LA in DES could improve the polarity of the system and facilitate the depolymerization of lignin. ChCl could form a new connection with the dissolved lignin fragments, which made the molecular weight and homogeneity of lignin increase after dissolution and regeneration.
4. The bonding strength between ChCl and lignin was weak, which could be easily destroyed by using microwave and heating (150 °C).
An expanded form of all the abbreviations
| DESs | Deep eutectic solvents |
| AL | Alkali lignin |
| LA | Lactic acid |
| HBDs | Hydrogen bond donors |
| ChCl | Choline chloride |
| GPC | Gel permeation chromatography |
| FTIR | Fourier transform infrared spectrometer |
| 1H and HSQC NMR | 1H and 1H–13C correlation two dimensional (2D) heteronuclear single-quantum coherence (HSQC) nuclear magnetic resonance (NMR) |
| LA-ChCl | Lactic acid:choline chloride 10:1(molar ratio) |
| HBAs | Hydrogen bond acceptors |
| DESL | Lignin isolated from DES |
| U | Urea |
| BA | Butanoic acid |
| 60 °C LA-L | Lignin isolated from LA on the condition of 60 °C |
| 60 °C LA-ChCl-L | Lignin isolated from LA-ChCl on the condition of 60 °C |
| 60 °C Mic LA-ChCl-L | Lignin isolated from LA-ChCl on the condition of 60 °C with microwaves |
| 150 °C LA-ChCl-L | Lignin isolated from LA-ChCl on the condition of 150 °C |
| 150 °C Mic LA-ChCl-L | Lignin isolated from LA-ChCl on the condition of 150 °C with microwaves |
| Mw | Molecular weight |
| PD | Polydispersity |
Conflicts of interest
There are no conflicts of interest to declareAcknowledgements
The authors are grateful for the support of the National key R & D project of China (grant number 2017YFB0307901), the Science and Technology Planning Project of Guangzhou City, China (201803010080), and the Science and Technology Planning Project of Guangdong Province (2019A0103008).Notes and references
- W. Schutyser, T. Renders, S. Van den Bosch, S. F. Koelewijn, G. T. Beckham and B. F. Sels, Chem. Soc. Rev., 2018, 47, 852–908 RSC.
- D. Chen, A. Gao, K. Cen, J. Zhang, X. Cao and Z. Ma, Energy Convers. Manage., 2018, 169, 228–237 CrossRef CAS.
- K. Staerk, N. Taccardi, A. Boesmann and P. Wasserscheid, Chemsuschem, 2010, 3, 719–723 CrossRef CAS.
- S. Liu, Z. Shi, L. Li, S. Yu, C. Xie and Z. Song, RSC Adv., 2013, 3, 5789–5793 RSC.
- M. M. Hossain and L. Aldous, Aust. J. Chem., 2012, 65, 1465–1477 CrossRef CAS.
- A. Dastpak, T. V. Lourencon, M. Balakshin, S. F. Hashmi, M. Lundstrom and B. P. Wilson, Ind. Crops Prod., 2020, 148, 112310 CrossRef CAS.
- A. P. Abbott, G. Capper, D. L. Davies, R. K. Rasheed and V. Tambyrajah, Chem. Commun., 2003, 70–71, 10.1039/b210714g.
- G. Garcia, S. Aparicio, R. Ullah and M. Atilhan, Energy Fuels, 2015, 29, 2616–2644 CrossRef CAS.
- E. L. Smith, A. P. Abbott and K. S. Ryder, Chem. Rev., 2014, 114, 11060–11082 CrossRef CAS.
- Q. Zhang, K. D. O. Vigier, S. Royer and F. Jerome, Chem. Soc. Rev., 2012, 41, 7108–7146 RSC.
- X.-D. Hou, K.-P. Lin, A.-L. Li, L.-M. Yang and M.-H. Fu, Ind. Crops Prod., 2018, 120, 322–329 CrossRef CAS.
- X.-D. Hou, A.-L. Li, K.-P. Lin, Y.-Y. Wang, Z.-Y. Kuang and S.-L. Cao, Bioresour. Technol., 2018, 249, 261–267 CrossRef CAS.
- C. Alvarez-Vasco, R. Ma, M. Quintero, M. Guo, S. Geleynse, K. K. Ramasamy, M. Wolcott and X. Zhang, Green Chem., 2016, 18, 5133–5141 RSC.
- Z. Guo, Q. Zhang, T. You, X. Zhang, F. Xu and Y. Wu, Green Chem., 2019, 21, 3099–3108 RSC.
- H. Jia and P. Lv, Green Chem., 2020, 22, 1378–1387 RSC.
- M. Francisco, A. van den Bruinhorst and M. C. Kroon, Green Chem., 2012, 14, 2153–2157 RSC.
- J. G. Lynam, N. Kumar and M. J. Wong, Bioresour. Technol., 2017, 238, 684–689 CrossRef CAS.
- E. Billes, K. N. Onwukamike, V. Coma, S. Grelier and F. Peruch, Carbohydr. Polym., 2016, 154, 121–128 CrossRef CAS.
- X. Pan, J. F. Kadla, K. Ehara, N. Gilkes and J. N. Saddler, J. Agric. Food Chem., 2006, 54, 5806–5813 CrossRef CAS.
- Y. T. Tan, G. C. Ngoh and A. S. M. Chua, Bioresour. Technol., 2019, 281, 359–366 CrossRef CAS.
- D. Smink, A. Juan, B. Schuur and S. R. A. Kersten, Ind. Eng. Chem. Res., 2019, 58, 16348–16357 CrossRef CAS.
- T. Li, G. Lyu, Y. Liu, R. Lou, L. A. Lucia, G. Yang, J. Chen and H. A. M. Saeed, Int. J. Mol. Sci., 2017, 18, 2266 CrossRef.
- N. Li, C. Cao, L. Shao, C. Wang, Y. Liu, L. Sun and L. A. Lucia, Bioresources, 2020, 15, 4362–4372 CAS.
- F. H. B. Sosa, R. M. Dias, A. M. da Costa Lopes, J. A. P. Coutinho and M. C. da Costa, Sustainability, 2020, 12, 3358 CrossRef CAS.
- A. Casas, M. Virginia Alonso, M. Oliet, E. Rojo and F. Rodriguez, J. Chem. Technol. Biotechnol., 2012, 87, 472–480 CrossRef CAS.
- X. Liu, T. F. Li, S. B. Wu, H. Ma and Y. H. Yin, Bioresour. Technol., 2020, 310, 123460 CrossRef CAS.
- W. Guo, Y. Hou, S. Ren, S. Tian and W. Wu, J. Chem. Eng. Data, 2013, 58, 866–872 CrossRef CAS.
Footnote |
| † Electronic supplementary information (ESI) available. See DOI: 10.1039/d0ra07808e |
| This journal is © The Royal Society of Chemistry 2020 |