 Open Access Article
Nanoscale insight on the durability of magnesium phosphate cement: a molecular dynamics study
Yue Li a,
Guosheng Zhang
 a,
Dongshuai Hou
 *b and
Zigeng Wanga
aKey Laboratory of Urban Security and Disaster Engineering of Ministry of Education, Beijing Key Laboratory of Earthquake Engineering and Structural Retrofit, Beijing University of Technology, Beijing, 100124, China
bDepartment of Civil Engineering, Qingdao University of Technology, Qingdao, China 266033. E-mail: dshou@outlook.com
First published on 4th November 2020
Abstract
The sustainable green building material magnesium phosphate cement (MPC) is widely used in the fields of solidifying heavy metals and nuclear waste and repair and reinforcement. Magnesium potassium phosphate hexahydrate (MKP) is the main hydration product of MPC. The transport of water and ions in MKP nanochannels determines the mechanical properties and durability of MPC materials. Herein, the interface models of MKP crystals with sodium chloride solution in the [001], [010] and [100] direction were established by molecular dynamics. The interaction of the MKP interface with water and ions was studied and the durability of MPC in sodium chloride solution was explained at the molecular level. The results show that a large number of water molecules are adsorbed on the MKP crystal surface through hydrogen bonds and Coulomb interactions; the surface water molecules have the bigger dipole moment and the dipole vector of most of the water molecules points to the solid matrix, when the crystal surfaces of the three models all show hydrophilicity. In addition, plenty of sodium ions are adsorbed at the MKP interface, and some potassium ions are desorbed from the matrix. In the MKP[001] model, the amount of potassium ions separated from the matrix and diffused into the solution is the highest and the interface crystal is the most disordered. Due to the attack of water and ions, the K–Os bond loses its chemical stability and the order of the MKP crystal is destroyed, which explains the decline of MPC performance after the erosion of sodium chloride solution at the molecular level. Besides, in the three models, the Na–Cl ion bond is more unstable than the K–Cl ion bond due to the smaller radius of the sodium atom. The stability of ionic bonds in the models is as follows: MKP[010] > MKP[100] > MKP[001].
1 Introduction
The production of Portland cement consumes huge amounts of energy and produces billions of tons of solid waste, even contributing 6–8% of the global anthropogenic carbon dioxide emissions.1–3 Therefore, it is urgent to develop sustainable green building materials that can replace Portland cement. Magnesium phosphate cement (MPC) is considered as a new type of environmentally friendly cementitious material, which is one of the most promising green building materials and can partially replace Portland cement.4 In addition, MPC is a new type of gas-hardening inorganic cementitious material with viscous properties, produced by an acid–base chemical reaction and physical interaction between water, magnesium oxide (MgO) and phosphate at room temperature. Magnesium potassium phosphate hexahydrate (MgKPO4·6H2O, MKP) is the main hydration product of MPC. In addition, industrial by-products are one of the important sources of MPC raw material magnesium oxide. For example, the magnesium oxide used by some scholars to make MPC was a by-product from the calcination process of natural magnesite and the production of Li2CO3 from salt lakes. The production of MPC using industrial by-products as raw materials has positive significance for the environment and sustainability.5–7 MPC is not only environmentally friendly but also has the advantages of fast hardening, early strength and high viscosity. Hence, it is widely used in the fields of repair and reinforcement, biomedicine, curing toxic substances and nuclear waste, which is of great significance to improve the environment. MPC has attracted many scholars to conduct a lot of research on its hydration mechanism, mechanical properties, durability, etc.8–14MPC was often used to solidify toxic substances and nuclear waste.15,16 Wang et al. comprehensively studied the effects of original Pb concentration, water-to-solid (W/S) ratio, MPC dosage and curing age on the leaching behavior of Pb-contaminated soil treated by the MPC. It was found that leachate Pb concentration increased with the increase of initial lead concentration in the contaminated soil and W/S ratio, while the leachate pH changed oppositely. The optimal W/S ratio of the MPC was 0.5 for stabilizing lead-contaminated soil, resulting in the lowest cumulative leaching amount of lead. The main mechanism that controlled Pb leaching from the MPC treated stabilization/solidification (S/S) samples appeared to be diffusion.17,18 Cadmium pollution was also a heavy metal pollution which endangers human health and the environment. He et al. studied the effect of Cd2+ on the early hydration process of the MPC. The results showed that MPC had good potential in stabilizing/solidifying cadmium pollutants and rapidly reducing the environmental toxicity of cadmium ions.19 Liquid radioactive waste (LRW) was the product of nuclear industry activities and has significant environmental hazards. The application of MPC matrix solidified LRW was one of the most promising treatment methods, providing maximum radioecological safety for the environment. Compared with Portland cement, the MPC matrix to leaching of 137Cs, 90Sr, 239Pu and 241Am had higher hydrolytic stability and high LRW salt filling.20,21 The MPC matrix were also feasible for curing radioactive waste containing actinide and rare earth elements.22 Josep et al. studied the leaching behavior of nickel containing wastes stabilized/solidified with MPC and proved the effectiveness of MPC for nickel inertization. Mg2+ and K+ were found in the leachant and the leaching mechanism of K+ was determined as diffusion.23 The migration, transport and adsorption of water and ions in MPC determine the effectiveness and safety of the solidification of toxic substances and nuclear waste by MPC.
MPC has the characteristics of fast hardening and early strength, which is widely used in the repair and reinforcement of roads, airports and concrete structures.24–26 The infrastructure of the MPC application is unavoidably served in harsh environments, such as the erosion of rainwater, the corrosion of seawater and deicing salts. When water and harmful ions enter into MPC, it may reduce the bond strength of MPC, destroy the microstructure of materials, even harmful ions penetrate into the reinforced concrete structure through MPC, resulting in corrosion of steel bars, affecting the safety and durability of infrastructure. The durability of MPC will directly affect the effect of MPC on solidifying heavy metals and nuclear waste, as well as repair and reinforcement. Hence, the durability of MPC is a common concern.27,28 Rouzic et al. studied the effect of the magnesia to phosphate molar ratio (Mg/P) on the performance of MPC. The results showed that excess potassium dihydrogen phosphate (KH2PO4) had a negative impact on the overall performance. High content of KH2PO4 resulted in poor water resistance because anhydrous phosphates do not react completely in the microstructure and were highly soluble. When the sample was immersed in water, it produced a large porosity.29 Yang et al. studied the corrosion resistance of MPC to seawater. It was found that the strength deteriorated after seawater immersion, the molar ratio of potassium to phosphorus measured by EDS was less than 1, the potassium ions with poor stability were partially hydrolyzed.10,30,31 MPC was immersed in water, Na2SO4 solution and NaCl solution for one year. It was found that the strength of MPC decreased, the quality of the hydration product MKP decreased, which indicated that the invasion of water and ions resulted in the degradation of mechanical properties and microstructure of MPC.8 Hou et al.32 studied the water resistance of MPC. It was also found that the MPC had hydrolysis effect with the decrease of the mechanical properties. The structure and dynamic properties of the MKP, the main hydration product of the MPC, were simulated by molecular dynamics (MD) method. The hydrolysis weakening effect and failure mechanism were revealed.
MKP is the main hydration product of MPC. The transport of water and ions in MKP nanochannels determines the mechanical properties and durability of MPC materials. The invasive water and harmful ions react with hydration products, destroy the microstructure of materials, reduce the bond strength of cement-based materials, induce the corrosion of steel bars, adversely affect the durability of structures. This directly affects the effectiveness of MPC on solidifying heavy metals and nuclear waste, as well as repair and reinforcement. It is challenging to study the structure and dynamics of water and ions only through experiments, because there are some limitations, such as the purity of materials and the measurement accuracy of relevant length and time scale. In order to explain the diffusion mechanism of water and ions at different scales, it is necessary to study the origin of their properties at the molecular level. Computational methods can help to explain the experimental results and play a complementary role in understanding the structure and dynamic characteristics at the molecular level. MD is a calculation method that can quantitatively explain the structure, dynamics and energy of solid–liquid interface. The characteristics of the interface between silicate hydration products and ionic solutions were studied by molecular dynamics methods. The durability of C–S–H gel has been understood at molecular level, while there is no relevant research about MKP.33–36
Therefore, the interfacial model between sodium chloride solution and MKP, the main hydration product of MPC, was established by molecular dynamics method. The interaction of water, ions and MKP interface was analyzed and the following characteristics of the interface model are obtained: (1) the structural characteristics of water molecules at solid–liquid interface, (2) the adsorption of ions by the MKP crystal surface, (3) the dynamic properties of ions. Firstly, the interface models of MKP crystal with sodium chloride solution were established in the [001] direction, [010] direction and [100] direction of MKP crystal respectively. Subsequently, the structure characteristics of water molecules at solid–liquid interface zone were analyzed by the density distribution, dipole moment distribution, dipole angle distribution and hydrogen bond evolution of water molecules. Then the adsorption of ions on the MKP crystal surface was discussed by molecular configuration, ion density distribution and coordination number. Finally, the dynamic properties of ions were studied by time correlation function (TCF) and mean square displacement (MSD).
2 Simulation method
2.1 Model construction
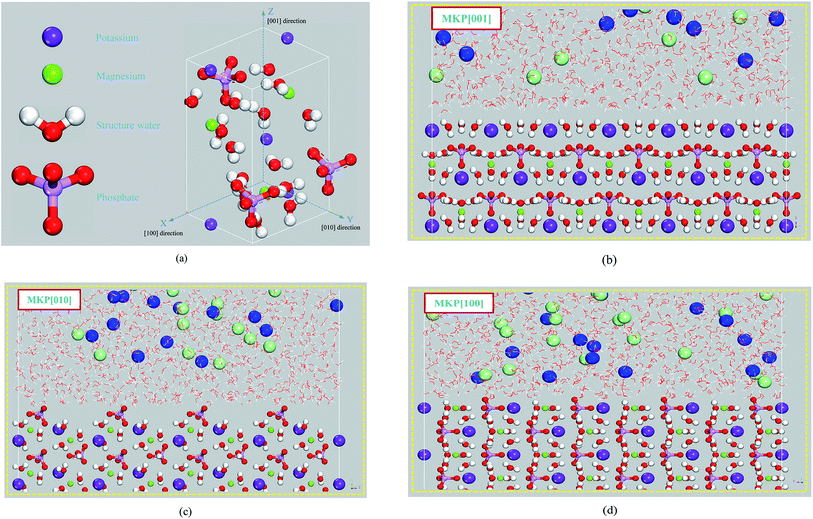
The simulation of the MKP crystal structure was based on the MKP unit cell provided by Graeser.37 The MKP original crystal cell is shown in Fig. 1(a). The MKP crystal is orthorhombic with the space group Pmn21, the crystal parameters of a = 6.903 Å, b = 6.174 Å, c = 11.146 Å. In addition, it can be seen from Fig. 1(a) that the MKP crystal has an asymmetric structure with different spatial distributions of atoms in the X direction ([100] direction), the Y direction ([010] direction) and the Z direction ([001] direction), respectively. The migration and adsorption behavior of chloride ions near the surface of the MKP crystals in different directions may be different. Therefore, the interface models of MKP crystal with sodium chloride solution were established in the [001] direction, [010] direction and [100] direction respectively, investigating the adsorption behavior of ions.The interfacial model of MKP crystal with sodium chloride solution in the [001] direction of MKP crystal (MKP[001] model) was built as follows: the MKP supercell containing 6 × 7 × 9 crystallographic unit cells was first established. The size of the supercell was a = 41.238 Å, b = 43.12 Å, c = 99.783 Å and α = 90°, β = 90°, γ = 90°. Secondly, the MKP supercell was cut along the [001] plane to obtain a crystal matrix with a thickness of 2.1 nm and a vacuum region with a thickness of 6.9 nm in the Z direction. Subsequently, 2495 water molecules were randomly distributed in the vacuum region with a thickness of 4.2 nm above the MKP crystal, while 38 Na and 38 Cl ions were randomly distributed in the aqueous solution to obtain the NaCl solution with the concentration of 0.85 mol L−1. That is, in the MKP[001] model, the thickness of the MKP matrix was 2.1 nm, the thickness of the NaCl solution was 4.2 nm, the thickness of the vacuum region was 3.7 nm. The initial configuration of the interfacial zone for the MKP[001] model is shown in Fig. 1(b).
Similarly, for the MKP[010] model, the MKP supercell containing 6 × 16 × 4 crystallographic unit cells was first established with the size of a = 41.238 Å, b = 98.56 Å, c = 44.348 Å, α = 90°, β = 90°, γ = 90°. Then, the crystal matrix with the thickness of 2 nm and the vacuum region with the thickness of 6.7 nm in the Y direction were obtained by cleaving the MKP supercell along the [010] plane. Subsequently, 2627 water molecules were randomly distributed in the vacuum zone with the thickness of 4.3 nm above the MKP crystal and 40 Na and 40 Cl ions were randomly distributed in the aqueous solution, acquiring the NaCl solution with the concentration of 0.85 mol L−1. Thus, the MKP[010] model was composed of the MKP matrix with the thickness 2 nm, the NaCl solution with the thickness 4.3 nm and the vacuum region with the thickness 3.6 nm. Fig. 1(c) shows the initial configuration of the interfacial zone for the MKP[010] model.
Similarly, for the MKP[100] model, the MKP supercell including 15 × 7 × 4 crystallographic unit cells was first established. The size of the supercell was a = 103.95 Å, b = 43.12 Å, c = 44.348 Å, α = 90°, β = 90°, γ = 90°. Secondly, the MKP supercell model was cut along the [100] plane to obtain the crystal matrix with the thickness of 2.2 nm in the X direction and the vacuum region with the thickness of 8.2 nm. Thirdly, 2811 water molecules were randomly distributed in the vacuum region with a thickness of 4.4 nm above the MKP crystal and 43 Na and 43 Cl ions were randomly distributed in the aqueous solution to obtain the NaCl solution with the concentration of 0.85 mol L−1. That is, in the MKP[100] model, the thickness of the MKP matrix was 2.2 nm, the thickness of the NaCl solution was 4.4 nm, the thickness of the vacuum zone was 3.8 nm. The initial configuration of the interfacial zone for the MKP[100] model is shown in Fig. 1(d).
2.2 Force field and molecular dynamics procedure
Randall T. et al. developed a general force field ClayFF for simulating hydration and multi-component mineral systems and their interfaces with aqueous solutions.38 With good transferability and reliability, the ClayFF force field has been widely used in the simulation of mineral–solution interfaces, the molecular structure of various cement hydration products, the adsorption of cations and anions on the hydroxide surface.39–45 In particular, the ClayFF force field was successfully applied to simulate the structure, dynamics and mechanical properties of the MKP, verifying the rationality of the ClayFF force field for the MKP system.32The interface model of the MKP and sodium chloride solution was simulated by the software LAMMPS, which stood for large-scale atomic/molecular massively parallel simulator. The entire simulation process used the NVT ensemble with the temperature of 300 K. The Nosé–Hoover (NH) thermostat was applied in MD simulations.1–5 The Verlet algorithm with the time step of 1 fs was used to integrate the atomic motion equation. The MD process consisted of three stages: first, the MKP crystal matrix was set as rigid body, when the solution system was free to move for 1000 ps. Secondly, the rigid body was loosened and both the substrate and the solution were subjected to a balanced free motion of 3000 ps. Finally, the NVT simulation of 3000 ps was continued. The three models recorded trajectory information every 0.1 ps, including atomic coordinates and velocities. The structural and dynamic analysis was based on the data generated by the last 3000 ps simulation. Then based on the MATLAB program, the various properties of the model were analyzed: (1) the structural characteristics of the water molecules at the solid–liquid interface, (2) the adsorption of ions by the MKP crystal interface, (3) the dynamic properties of water molecules and ions.
3 Results and discussion
3.1 The interfacial structure of water molecules
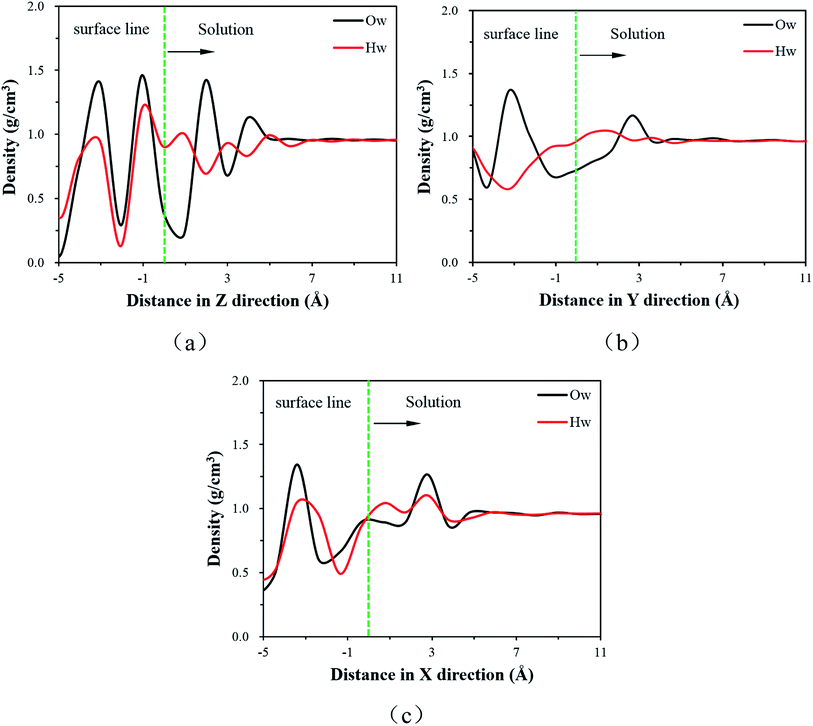 | ||
| Fig. 2 The density distribution of water molecules (a) along Z direction in MKP[001] model, (b) along Y direction in MKP[010] model, (c) along X direction in MKP[100] model. | ||
It can be seen from Fig. 2(a) that the water molecular density of MKP[001] model fluctuates significantly in the interface region and the Ow atomic density distribution has two peaks at 1.95 Å and 3.87 Å. The density oscillation gradually disappears and tends to be 1 g cm−3 away from the matrix 7 Å. The H atom density distribution has three peaks at 0.94 Å, 2.97 Å and 4.88 Å, respectively. The peaks of atomic density indicate the stratification for the interfacial water molecules. It should be noted that the first peak of Hw is closer to the matrix 1 Å than that of the Ow density peak. This means that the hydrogen atoms are distributed closer to the solid matrix in the first layer of water molecules approximating the MKP[001] surface. The affinity of the hydrogen atom implies the hydrophilicity of the MKP surface, which mainly due to the fact that the phosphate tetrahedrons on the [001] surface of the MKP crystal provide many non-bridged oxygen atoms. In the region below the interface line, the sharp water peaks with high intensity indicate that the water molecules in MKP crystals are arranged regularly in layers.
Fig. 2(b) and (c) show that the water molecular density also fluctuates significantly in the interface region of MKP[010] and MKP[100] models. The maximum water molecular density is 1.3 g cm−3 and the minimum is 0.5 g cm−3, the difference is relatively large. The density oscillation gradually disappears during the process away from the matrix, tending to 1 g cm−3. In addition, in the MKP[010] and MKP[100] models, the Hw distributions in the first water molecule layer are closer to the solid matrix, indicating the hydrophilicity of the MKP[010] and [100]surface.
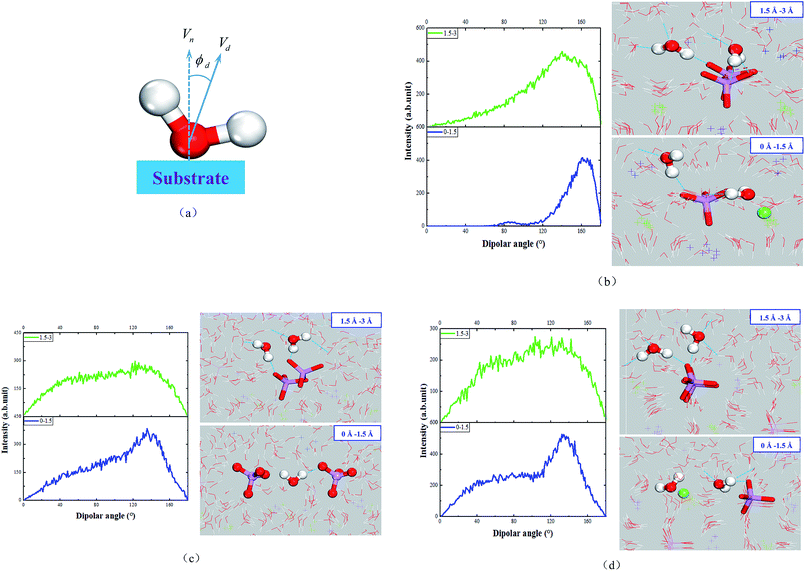
As shown in Fig. 6(c), the dipole angles of water molecules in the range of 1.5 Å from solid matrix are mainly distributed between 80° and 160° in the MKP[010] model. It's mainly because the negative charges of the phosphate attract water molecules, resulting in the large dipole angle of some water molecules. In the range of 1.5–3 Å from solid matrix, the dipole angle of water molecules only has a weak peak near 130°, and the overall distribution is relatively uniform.
Fig. 6(d) shows that the MKP[100] model has two peaks in the dipole angle distribution of water molecules in the range of 1.5 Å from the solid matrix, which are distributed between 40–70° and 120–170°, respectively. When the distance from the solid matrix is 1.5–3 Å, the dipole angle distribution is relatively uniform and there is no obvious peak. It can be seen that within the range of 1.5 Å from the solid matrix, the dipole angles of water molecules in the three models are mainly more than 90°, and even the majority of MKP[001] model's dipole angles of water molecules are more than 120°. In addition, within the range of 1.5–3 Å from the solid matrix, most of the water molecules with dipole angle greater than 90° still occupy the majority in the MKP[001] model. However, the MKP[010] model and the MKP[100] model have uniform dipole angle distribution in this range and there are no obvious peaks. This is because there is only one oxygen protruding into the solution in the later two models, and the negative charge at the interface is weak, so the range of water molecules affected is limited. The dipole angle distributions of the three models are different, mainly due to the difference in atomic distribution characteristics and charges distribution at the interface.
| Type | −3 to 0 Å | 0–3 Å | 3–6 Å | 18–21 Å |
|---|---|---|---|---|
| Ow-d-Ow | 0.17 | 0.78 | 1.47 | 1.56 |
| Ow-a-Ow | 0.49 | 1.04 | 1.33 | 1.61 |
| Ow-d-Os | 1.85 | 1.07 | 0.11 | 0.00 |
| Total | 2.51 | 2.89 | 2.91 | 3.17 |
| Type | −3 to 0 Å | 0–3 Å | 3–6 Å | 18–21 Å |
|---|---|---|---|---|
| Ow-d-Ow | 0.71 | 0.98 | 1.42 | 1.51 |
| Ow-a-Ow | 0.45 | 1.54 | 1.53 | 1.62 |
| Ow-d-Os | 0.98 | 0.60 | 0.15 | 0.00 |
| Total | 2.14 | 3.12 | 3.10 | 3.13 |
| Type | −3 to 0 Å | 0–3 Å | 3–6 Å | 18–21 Å |
|---|---|---|---|---|
| Ow-d-Ow | 0.67 | 1.16 | 1.53 | 1.52 |
| Ow-a-Ow | 0.57 | 1.39 | 1.50 | 1.59 |
| Ow-d-Os | 1.01 | 0.49 | 0.00 | 0.00 |
| Total | 2.25 | 3.04 | 3.03 | 3.11 |
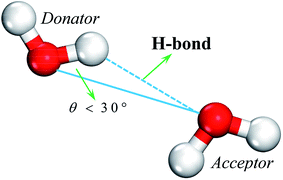
From Table 1, the numbers of H-bonds of the Ow-d-Ow and Ow-a-Ow types at the interface, the transition of the matrix to the solution, increases sharply for the MKP[001] model. It is noteworthy that the number of H-bonds accepted by water molecules is more than that of H-bonds contributed in the region of 3 Å above the interface line. It is consistent with that water molecules in this region prefer to point their OH vectors toward the matrix and accept H-bonds from the upper water layer. Therefore, the average number of hydrogen bonds contributed is more than that of hydrogen bonds accepted for water molecules in the region of 3–6 Å away from matrix. In the region above 6 Å from the interface, the water molecule contributes roughly 1.6 H-bonds and accept 1.6 H-bonds from the surrounding water molecules (close to the bulk water value). Besides, from 0 Å to 6 Å away from the crystal surface, the number of H-bonds (Ow-d-Os) contributed by the water molecules to the phosphate gradually decreases from 1.1 to 0. From the substrate to the solution, the total number of H-bonds increases from 2.5 and stabilizes at around 3.17 in the process from matrix to solution.
As exhibited in Tables 2 and 3, the MKP[010] and MKP[100] models have the same trend as the MKP[001] model for the number of H-bonds of the Ow-d-Ow and Ow-a-Ow types at the interface: sharp increase. In the solution far away from the substrate, the amount of H-bonds contributed by the water molecules is almost the same as that received from the surrounding water molecules, all of which are about 1.6. Moreover, from 0 Å to 6 Å away from the crystal surface, the number of the Ow-d-Os H-bonds in the MKP[010] and MKP[100] models gradually decreased from 0.60 and 0.49 to 0, respectively. The total numbers of H-bonds for three models increase from about 2.1 in the substrate to about 3.1 in the solution.
3.2 Adsorption of Na and Cl ions on the MKP surface
In Section 3.1, the molecular structure of the interfacial water molecules was analyzed by the density distribution, the orientation preference and the hydrogen bond. In addition to water molecules, potassium, sodium and chloride ions also exhibit local structural characteristics near the surface of MKP.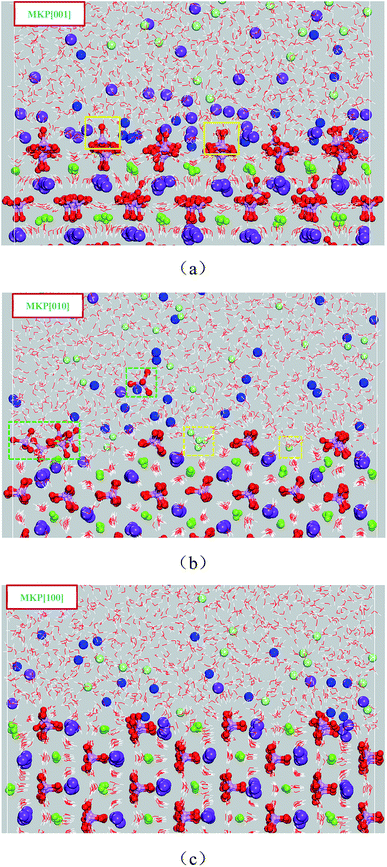 | ||
| Fig. 8 The molecular configuration at 2000 ps (a) for MKP[001] model, (b) for MKP[010] model, (c) for MKP[100] model. | ||
Very few potassium ions are separated from the MKP surface and diffused into solution at 2000 ps for MKP[010] model, as shown in Fig. 8(b). Meanwhile, many sodium ions are gradually adsorbed on the surface region and accumulated in this region. Interestingly, a small amount of the phosphate tetrahedrons have large vibration and rotation and even individual tetrahedrons are pulled out of the crystal matrix, as shown in Fig. 8(b) with phosphate tetrahedron in the blue dotted box. In addition, some chloride ions diffuse into the vacant region between the uppermost phosphate tetrahedrons and combine with the inner potassium and magnesium ions. The above phenomena indicates significant differences in the ion adsorption and desorption between MKP[001] model and MKP[010] model. It is mainly because the phosphoric acid tetrahedron in MKP[010] model is in the outermost layer, which can restrict the diffusion of potassium ions in the inner layer, when the larger space between the uppermost phosphate tetrahedron gives the opportunity for chloride ions to diffuse here.
As exhibited in Fig. 8(c), trace of potassium ions separate from the surface of MKP and diffuse into the solution at 2000 ps for the MKP[100] model, while plenty of sodium ions are gradually adsorbed on the surface area. The phosphate tetrahedrons only vibrate near the in situ and have not been pulled out of the crystal matrix. This is due to the very small amount of potassium ion desorption, which does not perturb the originally ordered atomic arrangement on the MKP crystal surface. Thus, a large number of sodium ions are adsorbed at the interface of all three models, and some potassium ions are desorbed from the matrix. In the MKP[001] model, the amount of potassium ions separated from the matrix and diffused into the solution is the most, and a small amount of phosphate tetrahedron is pulled out from the crystal matrix, the interface crystal is the most disordered, and the repulsion to chloride ion is the strongest. In MKP[010] model, the amount of potassium ion desorption is the least, and chloride ions can enter into the vacancy area between phosphate tetrahedrons. The interface crystal of MKP[100] model is the most ordered. The atomic spatial structure distribution characteristics of the three models are different, resulting in three models exhibiting different ion desorption, adsorption, and crystal disorder.
In conclusion, some potassium ions at MKP interface were separated from connection of K–Os bonds and diffused into the solution. A small amount of phosphate tetrahedron had large vibration and rotation, and even individual phosphate tetrahedron was pulled out from the crystal matrix. Under the attack of water and ions, the chemical stability of MKP crystal decreased and the crystal order was destroyed. From a molecular perspective, this explains the degradation of mechanical properties and microstructure of MPC after immersion in NaCl solution.8,10
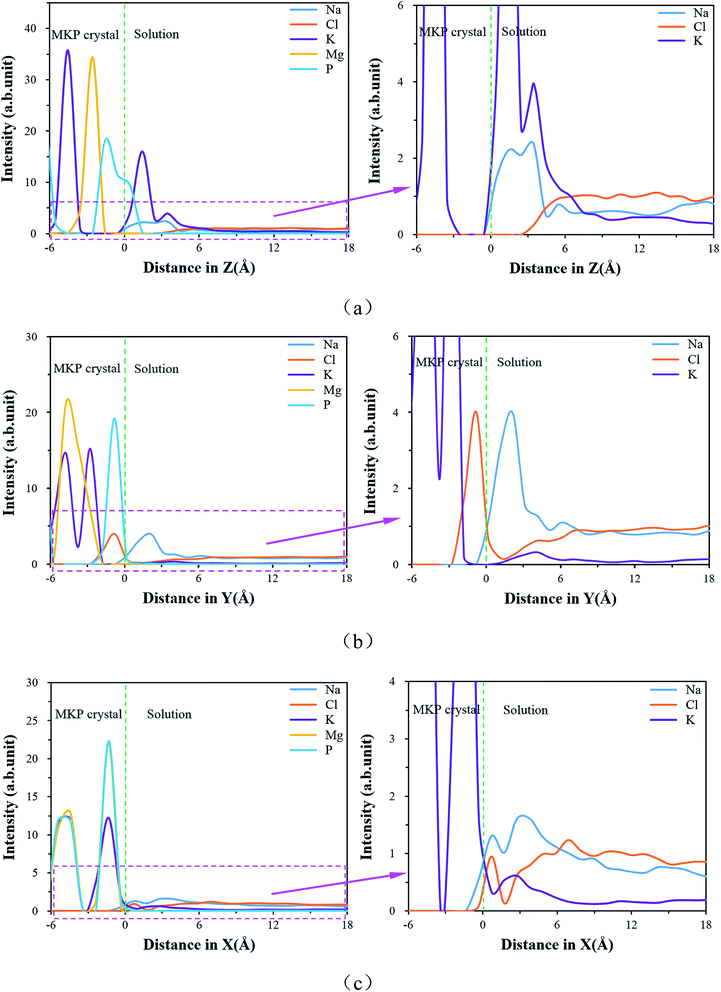 | ||
| Fig. 9 The ion density distributions (a) for MKP[001] model, (b) for MKP[010] model, (c) for MKP[100] model. | ||
On the other hand, chloride ions do not distribute in the range of 3 Å above the MKP crystal, which indicates that the interface of MKP[001] model has a strong repellency to anions. Magnesium ions have high intensity peaks in the crystal region, meaning that magnesium ions are orderly arranged in the crystal region. The phosphorus atoms also have a high intensity peak in the crystal region, but a slow peak is branched at the boundary, implying that part of the phosphorus atoms at the interface move into the solution. This is consistent with the phenomenon observed in Fig. 8(a) that a small amount of phosphate tetrahedrons at the interface is pulled out from the crystal matrix. The orderly atomic arrangement on the MKP crystal surface can be disturbed by the desorption of water molecules and potassium ions.
Fig. 9(b) shows that in the MKP[010] model, potassium ions also have high intensity peaks in the crystal region, while surface potassium ions have a small intensity peak with wide distribution. It represents that a small amount of surface potassium ions are desorbed from the MKP substrate. In addition, the MKP surface accumulates more sodium ions with strong attraction by the phosphate tetrahedron. On the other hand, the position of the first peak of the chloride ion density distribution is about 1 Å deep into the crystal. It is due to the diffusion of chloride ions into the vacant region between the tetrahedron and chloride ions combine with the potassium and magnesium ions in the inner layer. The distribution of chloride ions at the interface for the MKP[010] model is significantly different from that of the MKP[001] and MKP[100] models.
Fig. 9(c) shows that in the MKP[100] model, potassium ions are orderly arranged in the crystal region, while surface potassium ions have a small intensity peak, which means that the trace potassium ions are desorbed from the MKP matrix. Plenty of sodium ions also aggregate on the surface of MKP. Nevertheless, the interfacial potassium ion density peak of MKP[001] model is higher than that of sodium ion, while the interfacial potassium ion density peak of MKP[100] model is lower than that of sodium ion. It also certifies that only a few surface potassium ions in MKP[100] model diffuse into solution observed in Fig. 8(c). On the other hand, the position of the first peak of the chloride ions at the interface coincides with that of the sodium ions, because the chloride ions are adsorbed on the surface by numerous magnesium ions and potassium ions at the interface. The second peak of the chloride ions is located further away than the second peak of the sodium ions. The chloride ions at the second peak form ion pairs with the surface cations (including the adsorbed sodium ions and the diffused potassium ions). The distribution of chloride ions at the interface of the MKP[100] model has significant difference from that of the MKP[001] and MKP[010] models. This is due to the weak negative charges at the interface of MKP[100] model and the plentiful magnesium and potassium ions on the surface exposed to the solution.
Table 4 shows the CN of potassium ions for three directional models. In the MKP[001] model, there are 7.23 water molecules, 0.35 phosphate oxygen atoms and 0.04 chloride ions around each potassium ion. In the MKP[010] model, potassium ions have 5.32 coordinating atoms, including 5.10 water molecules and 0.23 chloride ions. 6.94 water molecules, 1.00 Os and 0.05 Cl are distributed around the potassium ion for the MKP[100] model. The number of Os around potassium ion in MKP[100] model is the largest. It is because only a small amount of potassium ions in the MKP[100] model are desorbed from the matrix and diffused to the solution at a relatively close distance, so there are more Os around the potassium ions. In addition, the number of Cl around potassium ion in the MKP[010] model is the largest, which is due to the fact that some chloride ions enter the vacancy region of matrix. The interfaces of MKP[001] model and MKP[100] model have some repulsion to chloride ions. The results of the above coordination numbers are consistent with the observed phenomena in Section 3.2.1.
| Type | MKP[001] | MKP[010] | MKP[100] | |
|---|---|---|---|---|
| K | Ow | 7.23 | 5.09 | 6.94 |
| Os | 0.35 | 0.00 | 1.00 | |
| Cl | 0.04 | 0.23 | 0.05 | |
| Total | 7.62 | 5.32 | 7.99 | |
The CN of sodium ions in the range of 5 Å of the three models are shown in Table 5. The total CN of sodium ions in MKP[001], MKP[010] and MKP[100] models are 5.97, 5.77 and 5.70, respectively. Compared to potassium ions, sodium ions with smaller hydration radius have fewer CN. The coordination number of Ow around ions is called the hydration number of ions. In the MKP interface model, the average hydration number of K+ and Na+ are between 5.09–7.23 and 4.56–5.18, respectively, which are within the range of previous test results and simulation results. The hydration number range of Na+ measured by X-ray and neutron diffraction methods is 4–8. The hydration number range of K+ obtained by simulation calculation is 6.3–7.8. It can be seen that the interaction between ions and water molecules calculated by the models in this paper is accurate.48–50
| Type | MKP[001] | MKP[010] | MKP[100] | |
|---|---|---|---|---|
| Na | Ow | 5.18 | 5.00 | 4.56 |
| Os | 0.77 | 0.67 | 1.07 | |
| Cl | 0.02 | 0.10 | 0.07 | |
| Total | 5.97 | 5.77 | 5.70 | |
Within 5 Å from the MKP crystal surface, the CN of chloride ions for three models is listed in Table 6. The total chloride coordination number of MKP[010] model and MKP[100] model were 6.93 and 8.31, respectively, while that of MKP[001] model was 2.66 and the least. It is because the MKP[001] model interface has the strongest negative charge with the strongest rejection to chloride ions.
| Type | MKP[001] | MKP[010] | MKP[100] | |
|---|---|---|---|---|
| Cl | Ow | 2.14 | 6.60 | 7.72 |
| K | 0.45 | 0.06 | 0.44 | |
| Na | 0.07 | 0.27 | 0.15 | |
| Total | 2.66 | 6.93 | 8.31 | |
3.3 Dynamics properties of water and ions in the interfacial region
 | (1) |
By integrating with eqn (2), the resident time (τres) of an atom around the central atom can be obtained:
 | (2) |
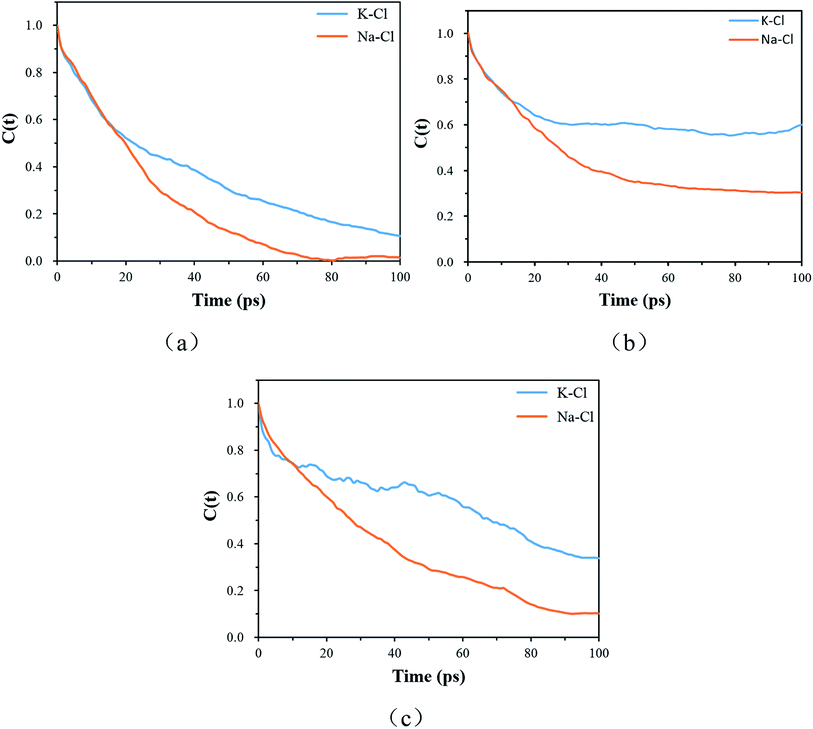
The resident time describes the time required for an atom to escape from the vicinity of a central atom. The resident time of the ion pairs in different models is shown in Table 7. Fig. 10(a), (b) and (c) display the chemical bond TCF of the MKP[001], MKP[010] and MKP[100] models, respectively. As exhibited in Fig. 10, the TCF of K–Cl at 100 ps decreases to 0.11, 0.59 and 0.34 for the MKP[001], MKP[010] and MKP[100] models, respectively, while the TCF of Na–Cl drops rapidly to 0.00, 0.31 and 0.10, respectively. In the three models, the TCF of Na–Cl decreases faster than that of K–Cl, because the radius of the sodium atom is smaller, resulting in the more unstable Na–Cl ion bond. In the three direction models, the TCF curve of K–Cl in the MKP[010] model declined the slowest. Besides, from Table 7, the resident time of K–Cl in MKP[001], MKP[010] and MKP[100] models were 36.78 ps, 63.67 PS and 59.17 ps, respectively. The order of K–Cl bond stability in different models is: MKP[010] > MKP[100] > MKP[001]. This is because in the MKP[010] model, some chloride ions enter the matrix vacancy region with the low mobility and the ionic bond formed with potassium ions is not easy to break, the resident time with sodium ion also is the longest in the three models. The interface in the MKP[001] model has strong repulsion to chloride ions, which leads to weak stability of K–Cl and Na–Cl ion bonds.
| Pair type | MKP[001] | MKP[010] | MKP[100] |
|---|---|---|---|
| K–Cl | 36.78 | 63.67 | 59.17 |
| Na–Cl | 24.46 | 45.01 | 37.62 |
 | (3) |
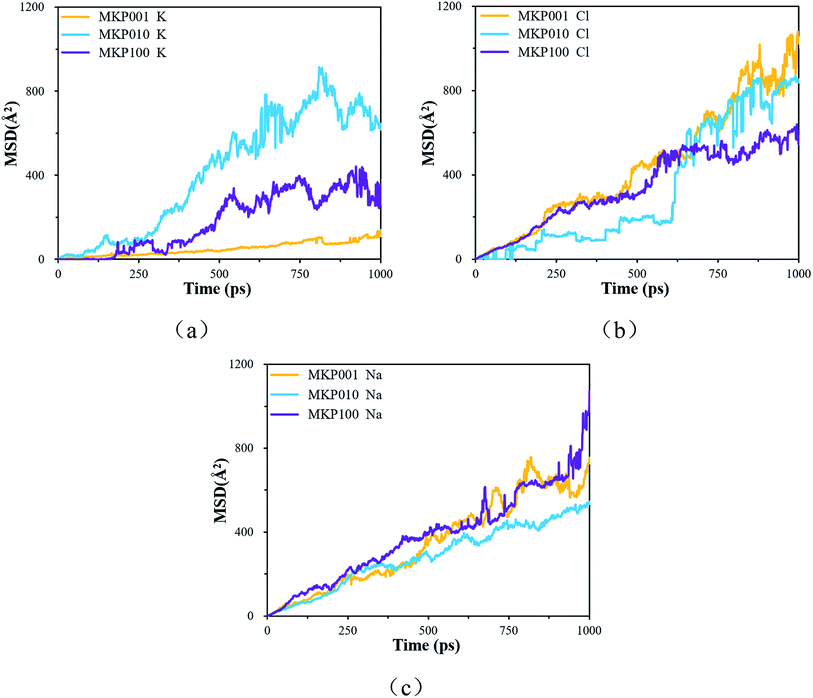
The MSD of the ions in the three direction models is shown in Fig. 11. Fig. 11(a) shows the MSD curve of potassium ion in the three models. The order of potassium ion movement rate in different models is: MKP[010] > MKP[100] > MKP[001]. This is because the MKP[001] model interface has strong negative charge and strong adsorption capacity for potassium ions. At the same time, the amount of potassium ions desorb from the matrix in MKP[001] model is the largest, and a large number of potassium ions hinder the mobility of each other. However, the MKP[010] model interface has weak negative charge and only a few potassium ions are desorbed from the matrix, so the potassium ions can move faster. The MSD curve of chloride ion in the three models is shown in Fig. 11(b). It can be seen that the diffusion of chloride ion in MKP[010] model is very slow at first, This is because the chloride ions move in the vacancy region of the phosphate tetrahedron and are constrained by the surrounding atoms. Until 600 ps, the chloride ions escape from the vacancy area and can move freely, so the MSD curve increases sharply. The MKP[001] model interface has strong negative charge and strong repulsion to chloride ions, so chloride ions can move faster. The MSD of sodium ions in the three models are exhibited in Fig. 11(c). The sodium ions of MKP[010] model move more slowly, which is due to the Coulomb interaction between the sodium ions and the chloride ions in the vacancy region. The results in Section 3.3.1 also show that the Na–Cl resident time of MKP[010] model is the longest, so the sodium ions have weaker mobility due to the influence of chloride ion.
4 Conclusion
In this paper, the interface models of MKP crystal with sodium chloride solution in three directions were established by molecular dynamics. The interaction of MKP interface with water and ions was studied, the durability of MPC in sodium chloride solution was explained at the molecular level. The following conclusions are drawn:(1) A large number of water molecules are adsorbed on the MKP crystal surface through hydrogen bond and Coulomb interaction. Thus, near the interface, water molecule density distribution form a peak, the dipole moment of water molecules in the interface region increases, the dipole angle is distributed at greater than 90° mainly. This means that the dipole vector of most of water molecules points to the solid matrix and the crystal surfaces in all three directions show hydrophilicity. However, in the three-direction model, the atomic distribution characteristics and charge distribution at the interface are different, resulting in slightly different influence on water molecules. Among them, MKP[001] model interface has the most significant effect on the orientation of water molecules nearby.
(2) Plenty of sodium ions are adsorbed at the interface of all three models, and some potassium ions are desorbed from the matrix. In the MKP[001] model, the amount of potassium ions separated from the matrix and diffused into the solution is the most, the interface crystal is the most disordered, and the repulsion to chloride ion is the strongest. In MKP[010] model, the amount of potassium ion desorption is the least, and chloride ions can enter into the vacancy area between phosphate tetrahedrons. The interface crystal of MKP[100] model is the most ordered. Due to the attack of water and ions, the K–Os bond loses its chemical stability and the order of the MKP crystal is destroyed, which explains the reason for the decline of MPC performance after the erosion of sodium chloride solution at the molecular level.
(3) In the three models, the Na–Cl ion bond is more unstable than K–Cl due to the smaller radius of the sodium atom. The stability of ionic bonds in the models is as follows: MKP[010] > MKP[100] > MKP[001]. This is because in the MKP[010] model, some chloride ions enter the matrix vacancy region with the low mobility and the ionic bond formed with cation ions is not easy to break. Therefore, the resident time with cation ion also is the longest in the three models. It is also known from the MSD curve of the ions that the chloride ion mobility of the MKP[010] model is the weakest.
Conflicts of interest
There are no conflicts to declare.Acknowledgements
The authors would like to acknowledge the financial support of National Natural Science Foundation of China (No. 51678011) and Beijing Millions of Talents Project (No. 2018A37).References
- Y. Zhou, et al., The design and evaluation of a smart polymer-based fluids transport inhibitor, J. Cleaner Prod., 2020, 257, 120528 CrossRef CAS.
- S. Ruan and C. Unluer, Influence of supplementary cementitious materials on the performance and environmental impacts of reactive magnesia cement concrete, J. Cleaner Prod., 2017, 159, 62–73 CrossRef CAS.
- S. Ruan and C. Unluer, Comparative life cycle assessment of reactive MgO and Portland cement production, J. Cleaner Prod., 2016, 137, 258–273 CrossRef CAS.
- M. A. Haque and B. Chen, Research progresses on magnesium phosphate cement: a review, Constr. Build. Mater., 2019, 211, 885–898 CrossRef CAS.
- J. Formosa, et al., Magnesium phosphate cements formulated with a low-grade MgO by-product: physico-mechanical and durability aspects, Constr. Build. Mater., 2015, 91, 150–157 CrossRef.
- A. Maldonado-Alameda, et al., Physical, thermal and mechanical study of MPC formulated with LG-MgO incorporating Phase Change Materials as admixture, in IOP Conference Series: Materials Science and Engineering, IOP Publishing, 2017 Search PubMed.
- Y. Tan, et al., Magnesium potassium phosphate cement prepared by the byproduct of magnesium oxide after producing Li2CO3 from salt lakes, Ceram. Int., 2014, 40(8), 13543–13551 CrossRef CAS.
- Y. Li, T. Shi and J. Li, Effects of fly ash and quartz sand on water-resistance and salt-resistance of magnesium phosphate cement, Constr. Build. Mater., 2016, 105, 384–390 CrossRef CAS.
- Y. S. Wang, et al., Influence of lead on stabilization/solidification by ordinary Portland cement and magnesium phosphate cement, Chemosphere, 2018, 190, 90–96 CrossRef CAS.
- Y. Jianming, Z. Jie and Z. Shucong, Experimental research on seawater erosion resistance of magnesium potassium phosphate cement pastes, Constr. Build. Mater., 2018, 183, 534–543 CrossRef.
- M. Le Rouzic, et al., Mechanisms of k-struvite formation in magnesium phosphate cements, Cem. Concr. Res., 2017, 91, 117–122 CrossRef CAS.
- H. Ma, B. Xu and Z. Li, Magnesium potassium phosphate cement paste: degree of reaction, porosity and pore structure, Cem. Concr. Res., 2014, 65, 96–104 CrossRef CAS.
- B. Xu, H. Ma and Z. Li, Influence of magnesia-to-phosphate molar ratio on microstructures, mechanical properties and thermal conductivity of magnesium potassium phosphate cement paste with large water-to-solid ratio, Cem. Concr. Res., 2015, 68, 1–9 CrossRef CAS.
- S. Yu, et al., Magnesium phosphate based cement with improved setting, strength and cytocompatibility properties by adding Ca(H2PO4)2·H2O and citric acid, J. Mech. Behav. Biomed. Mater., 2019, 91, 229–236 CrossRef CAS.
- Z.-h. Qian, et al., Effect of fluorine on stabilization/solidification of radioactive fluoride liquid waste in magnesium potassium phosphate cement, J. Radioanal. Nucl. Chem., 2018, 319(1), 393–399 CrossRef.
- S. E. Vinokurov, S. A. Kulikova and B. F. Myasoedov, Solidification of high level waste using magnesium potassium phosphate compound, Nucl. Eng. Technol., 2019, 51(3), 755–760 CrossRef CAS.
- P. Wang, Q. Xue and Z. Yang, et al., Factors affecting the leaching behaviors of magnesium phosphate cement-stabilized/solidified Pb-contaminated soil, part II: dosage and curing age, Environ. Prog. Sustainable Energy, 2017, 36(5), 1351–1357 CrossRef CAS.
- P. Wang, Q. Xue and J. S. Li, et al., Factors affecting the leaching behaviours of magnesium phosphate cement-stabilised/solidified Pb-contaminated soil, part 1: water-to-solid ratio and Pb concentration, Int. J. Environ. Pollut., 2018, 63(1–2), 89–103 CrossRef CAS.
- Y. He, et al., Effect of Cd2+ on early hydration process of magnesium phosphate cement and its leaching toxicity properties, Constr. Build. Mater., 2019, 209, 32–40 CrossRef CAS.
- S. E. Vinokurov, et al., Investigation of the leaching behavior of components of the magnesium potassium phosphate matrix after high salt radioactive waste immobilization, J. Radioanal. Nucl. Chem., 2018, 315(3), 481–486 CrossRef CAS.
- S. E. Vinokurov, et al., Low-temperature immobilization of actinides and other components of high-level waste in magnesium potassium phosphate matrices, J. Nucl. Mater., 2009, 385(1), 189–192 CrossRef CAS.
- S. E. Vinokurov, S. A. Kulikova and B. F. Myasoedov, Magnesium Potassium Phosphate Compound for Immobilization of Radioactive Waste Containing Actinide and Rare Earth Elements, Materials, 2018, 11(6), 976 CrossRef.
- J. Torras, et al., Semi-dynamic leaching tests of nickel containing wastes stabilized/solidified with magnesium potassium phosphate cements, J. Hazard. Mater., 2011, 186(2–3), 1954–1960 CrossRef CAS.
- B. Chen, et al., Feasibility of Magnesium Phosphate Cement (MPC) as a repair material for ballastless track slab, Constr. Build. Mater., 2017, 154, 270–274 CrossRef CAS.
- Q. Yang and X. Wu, Factors influencing properties of phosphate cement-based binder for rapid repair of concrete, Cem. Concr. Res., 1999, 29(3), 389–396 CrossRef CAS.
- J. Li, W. Zhang and Y. Cao, Laboratory evaluation of magnesium phosphate cement paste and mortar for rapid repair of cement concrete pavement, Constr. Build. Mater., 2014, 58, 122–128 CrossRef.
- C. Shi, et al., Effect of waterglass on water stability of potassium magnesium phosphate cement paste, Cem. Concr. Res., 2014, 53, 83–87 CrossRef CAS.
- L. Chong, J. Yang and C. Shi, Effect of curing regime on water resistance of magnesium–potassium phosphate cement, Constr. Build. Mater., 2017, 151, 43–51 CrossRef CAS.
- M. Le Rouzic, et al., On the influence of Mg/P ratio on the properties and durability of magnesium potassium phosphate cement pastes, Cem. Concr. Res., 2017, 96, 27–41 CrossRef CAS.
- J. Yang, et al., The effect of seawater curing on properties of magnesium potassium phosphate cement, Constr. Build. Mater., 2017, 141, 470–478 CrossRef CAS.
- C. Yu, Q. Wu and J. Yang, Effect of seawater for mixing on properties of potassium magnesium phosphate cement paste, Constr. Build. Mater., 2017, 155, 217–227 CrossRef CAS.
- D. Hou, et al., Experimental and computational investigation of magnesium phosphate cement mortar, Constr. Build. Mater., 2016, 112, 331–342 CrossRef CAS.
- F. Wang, et al., Effect of temperature on the capillary transport of sodium sulfate solution in calcium silicate hydrate nanopore: a molecular dynamics study, Constr. Build. Mater., 2020, 231, 117111 CrossRef CAS.
- Y. Zhou, et al., Chloride ions transport and adsorption in the nano-pores of silicate calcium hydrate: experimental and molecular dynamics studies, Constr. Build. Mater., 2016, 126, 991–1001 CrossRef CAS.
- Y. Zhang, et al., Insights on magnesium and sulfate ions' adsorption on the surface of sodium alumino-silicate hydrate (NASH) gel: a molecular dynamics study, Phys. Chem. Chem. Phys., 2018, 20(27), 18297–18310 RSC.
- Y. Zhang, et al., The effect of water molecules on the structure, dynamics, and mechanical properties of sodium aluminosilicate hydrate (NASH) gel: a molecular dynamics study, Constr. Build. Mater., 2018, 193, 491–500 CrossRef CAS.
- S. Graeser, et al., Struvite-(K), KMgPO46H2O, the potassium equivalent of struvite a new mineral, Eur. J. Mineral., 2008, 20(4), 629–633 CrossRef CAS.
- R. T. Cygan, J. J. Liang and A. G. Kalinichev, Molecular Models of Hydroxide, Oxyhydroxide, and Clay Phases and the Development of a General Force Field, J. Phys. Chem. B, 2004, 108(4), 1255–1266 CrossRef CAS.
- D. Hou and T. Li, Influence of aluminates on the structure and dynamics of water and ions in the nanometer channel of calcium silicate hydrate (C-S-H) gel, Phys. Chem. Chem. Phys., 2018, 20(4), 2373–2387 RSC.
- D. Hou, T. Li and P. Wang, Molecular Dynamics Study on the Structure and Dynamics of NaCl Solution Transport in the Nanometer Channel of CASH Gel, ACS Sustainable Chem. Eng., 2018, 6(7), 9498–9509 CrossRef CAS.
- D. Hou, et al., Molecular structure, dynamics, and mechanical behavior of sodium aluminosilicate hydrate (NASH) gel at elevated temperature: a molecular dynamics study, Phys. Chem. Chem. Phys., 2018, 20(31), 20695–20711 RSC.
- J. Yang, D. Hou and Q. Ding, Ionic hydration structure, dynamics and adsorption mechanism of sulfate and sodium ions in the surface of calcium silicate hydrate gel: a molecular dynamics study, Appl. Surf. Sci., 2018, 448, 559–570 CrossRef CAS.
- Y. Zhang, et al., Insights on magnesium and sulfate ions' adsorption on the surface of sodium alumino-silicate hydrate (NASH) gel: a molecular dynamics study, Phys. Chem. Chem. Phys., 2018, 20(27), 18297–18310 RSC.
- P. Wang, et al., Atomistic insights into cesium chloride solution transport through the ultra-confined calcium-silicate-hydrate channel, Phys. Chem. Chem. Phys., 2019, 21(22), 11892–11902 RSC.
- J. Yang, et al., Na and Cl immobilization by size controlled calcium silicate hydrate nanometer pores, Constr. Build. Mater., 2019, 202, 622–635 CrossRef CAS.
- D. Hou, et al., Structural, dynamic and mechanical evolution of water confined in the nanopores of disordered calcium silicate sheets, Microfluid. Nanofluid., 2015, 19(6), 1309–1323 CrossRef CAS.
- D. Li, et al., Molecular dynamics study on the chemical bound, physical adsorbed and ultra-confined water molecules in the nano-pore of calcium silicate hydrate, Constr. Build. Mater., 2017, 151, 563–574 CrossRef CAS.
- H. Ohtaki and T. Radnai, Structure and dynamics of hydrated ions, Chem. Rev., 1993, 93(3), 1157–1204 CrossRef CAS.
- L. Zhu, et al., Hydronium Ions in Zeolites. 1. Structures of Partially and Fully Dehydrated Na, H3O− X by X-ray and Neutron Diffraction, J. Phys. Chem. B, 1999, 103(47), 10365–10372 CrossRef CAS.
- R. Mancinelli, et al., Hydration of sodium, potassium, and chloride ions in solution and the concept of structure maker/breaker, J. Phys. Chem. B, 2007, 111(48), 13570–13577 CrossRef CAS.
| This journal is © The Royal Society of Chemistry 2020 |

