 Open Access Article
Highly rapid and non-enzymatic detection of cholesterol based on carbon nitride quantum dots as fluorescent nanoprobes†
Ying Chen,
Gege Yang,
Shanshan Gao,
Liangliang Zhang,
Mengdi Yu,
Chunxia Song * and
Ying Lu*
Department of Applied Chemistry, School of Science, Anhui Agricultural University, Hefei 230036, China. E-mail: songchunxia@ahau.edu.cn; luy@ahau.edu.cn
First published on 29th October 2020
Abstract
In this work, we reported a highly rapid and non-enzymatic method for cholesterol measuring based on carbon nitride quantum dots (CNQDs) as fluorescent nanoprobes, which were synthesized through chemical oxidation. The obtained CNQDs displayed high quantum yield up to 35% as well as excellent photostability, water solubility and low toxicity. We found that the fluorescence of CNQDs could be quenched more than 90% within 30 seconds by cholesterol through the formation of hydrogen bonds between –NH2, –NH on the surface of CNQDs and cholesterol containing –OH. According to this phenomenon, a cholesterol detection method was constructed with a wide linear region over the range of 0–500 μmol L−1 and a detection limit as low as 10.93 μmol L−1, and it possessed the obvious advantages of being a very rapid process and avoiding the use of enzymes. In addition, this method showed high selectivity in the presence of various interfering reagents and applicability to the measurement of cholesterol in fetal bovine serum, which indicated its potential application value in clinical settings.
Introduction
Cholesterol is an indispensable substance in the cells and tissues of humans. It not only plays an important role in modulating membrane structural fluidity and permeability, but also serves as a precursor for the biosynthesis of vitamin D, bile acid and the steroid hormone.1,2 The cholesterol level in healthy human serum should be controlled at about 200 mg dL−1. An increased level of cholesterol in blood serum can form plaques in the arteries of blood vessels, blocking the blood circulation and causing atherosclerosis, Alzheimer's disease, cardiovascular disease, cerebral hemorrhage or other diseases. However a low level of cholesterol (<167 mg dL−1) may lead to various illnesses such as depression, septicaemia and malnutrition.3–5 Thus, the content of total cholesterol in serum is a crucial parameter for clinical diagnostics. Traditional methods of cholesterol detection include electrochemical assay,6 fluorescence analysis,7 high performance liquid chromatography,8 colorimetry,9 electrochemiluminescence methods,10 etc. Among them, fluorescence analysis methods have been widely concerned due to their high sensitivity, easy reading, small sample volume and fast response time.11–13 However, many types of fluorescence methods for cholesterol detection reported thus far are based on oxidation reaction of cholesterol with cholesterol oxidase, which is easily denatured and expensive.14,15 In addition, these measuring processes are usually complexity and time-consuming owing to the participation of cholesterol oxidase.Therefore, it is necessary to establish a rapid and non-enzymatic approach for the detection of cholesterol.
Carbon nitride materials, including carbon nitride nanosheets (CNNS) and carbon nitride quantum dots (CNQDs) etc., which a metal-free semiconductor composes of carbon and nitrogen, have attracted extensive interests owing to their excellent advantages of catalysis, cost-effective, good stability, low toxicity and so on.16 They are widely applied in energy conversion,17 photocatalysis,18,19 drug delivery,20 oxygen reduction21 and biological imaging.22 Recently, CNQDs, which not only possess the excellent properties of carbon nitride materials but also have the advantages of quantum dots (stable fluorescence, long Stoke shift, anti-photobleaching and so on), have been assessed for various biochemical applications.23 For instance, glucose and ascorbic acid detection are successfully realized by using CNQDs as fluorescent nanoprobes.24,25 These researches demonstrated that CNQDs hold promising potential for detecting a broader range of analytes in clinical and bio-analysis.
In this work, we have presented a simple fluorescence approach using CNQDs as fluorescent nanoprobes for highly rapid and non-enzymatic detection of cholesterol. As shown in Fig. 1, firstly, the melamine was pyrolyzed to form the bulk g-C3N4, and the product was processed through simply hydrothermal and ultrasonic method to get CNQDs with high quantum yield (35%). The as-prepared CNQDs had a strong emission peak (λem = 367 nm) with excitation wavelength at 250 nm. Then, the fluorescence of CNQDs could be efficiently quenched by cholesterol owing to the formation of hydrogen bond between –NH2, –NH on the surface of CNQDs and cholesterol containing –OH. So a rapid and non-enzymatic detection of cholesterol could be realized by measuring the fluorescence intensity of CNQDs.
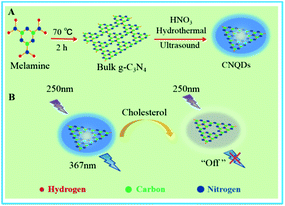 | ||
| Fig. 1 (A) The preparation pathway of CNQDs. (B) The schematic illustration of highly rapid and non-enzymatic detection of cholesterol based on CNQDs as fluorescent nanoprobes. | ||
Experimental sections
Chemicals and apparatus
Melamine, glycine, urea and glucose were ordered from Shanghai Aladdin Biochemical Technology Co., Ltd. Cholesterol was bought from Shanghai Yuanye Biotechnology Co., Ltd. Ethyl alcohol was purchased from Shanghai Titan Scientific Co., Ltd. Nitric acid was obtained from Shanghai Zhenqi Chemical Reagent Co., Ltd. Fetal bovine serum was purchased from Zhejiang Tianhang Biotechnology Co., Ltd. All other chemicals used in this work were of analytical grade and were used as received without any further purification. All solutions were purified with ultrapure water (Millipore-D 24 UV, Millipore Instruments, France, 18.2 MΩ cm).Transmission electron microscopy (TEM) image was obtained by using Hitachi HT-7700 transmission electron microscope (Japan). An Agilent G9800A fluorescence spectrophotometer was used for fluorescence measurements. UV-Vis absorption spectra were recorded with a TU-1901 UV-Vis spectrophotometer (Beijing). Fourier transform infrared (FTIR) spectrum was measured by Thermo Scientific Nicolet iS10. X-ray photoelectron spectroscopy (XPS) was performed on a Thermo Scientific Escalab 250Xi.
Preparation of CNQDs
The bulk g-C3N4 was obtained by direct pyrolysis of melamine according to the literature with minor modification.26 10 g of melamine was dried at 70 °C for 24 h. Then, it was placed in a porcelain boat and heated at 550 °C for 3.5 h in tubular furnace, with a heating rate of 3 °C min−1. The collected yellow powder product was bulk g-C3N4.The CNQDs was prepared via a chemical oxidation and hydrothermal treatment according to the previously reported literature.27 Firstly, 150 mg of bulk g-C3N4 was refluxed under 200 °C for 24 h after sonication for 1 h in 50 mL of HNO3 (5 mol L−1) at room temperature. Secondly, as the white product cooling down to ambient temperature, it was centrifuged at 10![[thin space (1/6-em)]](https://www.rsc.org/images/entities/char_2009.gif) 000 rpm for 5 min, and then the precipitation was re-dispersed in 30 mL ultrapure water after thoroughly washing with ultrapure water to neutral. Thirdly, the obtained solution was transferred into a Teflon-sealed autoclave and maintained at 200 °C for 12 h. The product was centrifuged at 10
000 rpm for 5 min, and then the precipitation was re-dispersed in 30 mL ultrapure water after thoroughly washing with ultrapure water to neutral. Thirdly, the obtained solution was transferred into a Teflon-sealed autoclave and maintained at 200 °C for 12 h. The product was centrifuged at 10![[thin space (1/6-em)]](https://www.rsc.org/images/entities/char_2009.gif) 000 rpm for 5 min and the precipitation was sonicated in 35 mL water for 4 h. Finally, the resultant solution was filtered by 0.22 μm microporous filter to remove the g-C3N4 nanosheets. Thus, the CNQDs solution was obtained and stored in the refrigerator at 4 °C before using.
000 rpm for 5 min and the precipitation was sonicated in 35 mL water for 4 h. Finally, the resultant solution was filtered by 0.22 μm microporous filter to remove the g-C3N4 nanosheets. Thus, the CNQDs solution was obtained and stored in the refrigerator at 4 °C before using.
Fluorescence response of cholesterol
50 μL cholesterol ethanol solution of different concentration was added into 450 μL CNQDs solution and the resultant solution was vibrated in dry bath at 25 °C for 5 min. Then, the fluorescence spectra data were collected with the excitation wavelength at 250 nm. The excitation/emission slits were 2.5 nm and 5 nm respectively, and the scanning range was from 300 to 480 nm.Results and discussion
Characterization of CNQDs
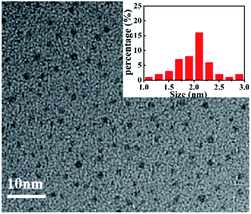
The morphology of produced CNQDs was characterized by TEM. As shown in Fig. 2, it was clearly observed that the prepared CNQDs were monodispersed small particles with mean diameters of about 2 nm, which consists with the previous report.28 So, we supposed that the CNQDs were successfully synthesized. In addition, the FTIR spectrum (Fig. S1, ESI†) was conducted to detect the group of the CNQDs, which indicated that the basic substructure of CNQDs was tri-s-triazine ring unit and the existence of –NH2/–NH on the CNQDs. These results were also supported by the XPS spectra (Fig. S2, ESI†).Optical properties of CNQDs
To investigate the optical properties of the CNQDs, the UV-Vis absorption spectrum and the fluorescence spectra of the CNQDs were measured. As shown in Fig. S3A (ESI†), the maximum absorption peak of CNQDs was at about 212 nm, which was due to the absorption of π–π* electronic transitions of the tri-s-triazine ring of the CNQDs.29 Besides, we could find that the CNQDs had no absorption peak in the visible light region, which was possibly caused by quantum size effects. The fluorescence excitation peak of CNQDs was at 252 nm, and the emission spectrum showed a strong peak at 364 nm. Compared with the bulk g-C3N4, the fluorescence intensity of CNQDs was largely increased by more than 4 times, and the fluorescence emission peak of CNQDs had a remarkably blue shift of 70 nm (Fig. S3B, ESI†). As shown in Fig. S4 (ESI†), the emission wavelength was stayed constant with the increase of excitation wavelength, which indicated an excitation-independent fluorescence behavior. In addition, the fluorescence quantum yield of prepared CNQDs in this work was as high as 35%, which was higher than the other reports for the CNQDs (Table S1 in ESI†).30,31The rapid quenching of CNQDs by cholesterol
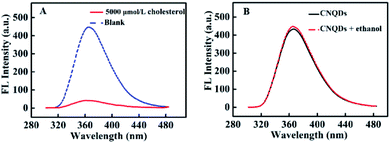
The relationship of the fluorescence signal versus time was shown in Fig. 3, the fluorescence intensity of CNQDs quickly decreased within 30 seconds after the addition of cholesterol, so the reaction process of this method was very rapid. Then, we verified the feasibility by fluorescence signal. As shown in Fig. 4A, in the absence of cholesterol, the fluorescence intensity of CNQDs was high, while in the presence of cholesterol, the fluorescence intensity of CNQDs was quickly quenched by cholesterol due to the interaction between cholesterol and CNQDs, and the quenching efficiency reached 90.30% when cholesterol concentration was 5000 μmol L−1. Moreover, this system was little influenced by the solvent of cholesterol solution (Fig. 4B).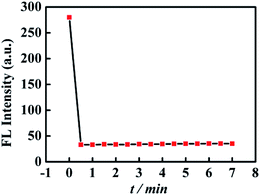 | ||
| Fig. 3 Changes of the fluorescence intensity of CNQDs with the increase of time. The cholesterol with the concentration of 5000 μmol L−1 was added into CNQDs solution at 0 min. | ||
Mechanism involved in the analysis of cholesterol
In order to investigate the fluorescence quenching mechanism, we studied the F0/F (F0 and F denoted the fluorescence intensity of CNQDs in the absence and presence of cholesterol, respectively) against concentration of cholesterol at 25 °C and 50 °C. As shown in Fig. 5A, the slope of the linear fitted equation decreased with the increase of temperature from 25 °C to 50 °C, thus suggesting that the fluorescence quenching of CNQDs by cholesterol belonged to static quenching.32,33 Moreover, the absorption intensity of CNQDs was increased and the maximum absorption peak exhibited slight red-shift with the addition of cholesterol (Fig. 5B). These results indicated the formation of the complex between the CNQDs and cholesterol, thus further confirmed that the quenching mechanism was static quenching.34 In addition, Rong et al. verified that the hydrogen bonding could be formed between graphitic carbon nitride (g-C3N4) nanosheets and 2,4,6-trinitrophenol, causing the fluorescence quenching of g-C3N4.35 It was displayed that the hydrogen bonds could be easily formed between carbon nitride nanomaterials and hydroxyl-contained molecules. Therefore, the fluorescence quenching mechanism was probably that the hydrogen bonds between hydroxyl on the cholesterol and –NH2/–NH on the surface of CNQDs were formed, resulting in the reduction of fluorescence intensity.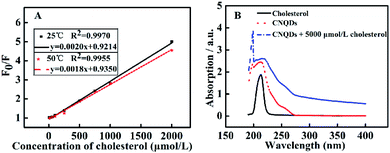 | ||
| Fig. 5 (A) Plot of F0/F vs. cholesterol at different temperatures. (B) The UV-Vis absorption spectra of cholesterol and CNQDs in the absence or presence of 5000 μmol L−1 cholesterol. | ||
Fluorescence determination of cholesterol
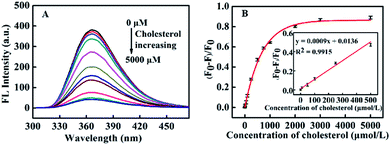
The fluorescence spectra of CNQDs with a series of standard cholesterol solution were obtained. As displayed in Fig. 6A, the fluorescence intensity of the system intermittently decreased with the increase of cholesterol concentration, and it decreased to a stable value after the cholesterol concentration gradually increased to 3000 μmol L−1. In addition, a plot of (F0–F)/F0 on cholesterol concentration was shown in Fig. 6B, it could be seen that the linear response range was 0–500 μmol L−1 (R2 = 0.9915) and the linear fitted equation was y = 0.0009x + 0.0136 (x and y represented the concentration of cholesterol and (F0–F)/F0, respectively). Furthermore, this method exhibited a relatively low detection limit (LOD = 10.93 μmol L−1, S/N = 3) and wide linear range compared with other cholesterol assays (Table S2 in ESI†).Specificity study of CNQDs for analyzing cholesterol
The influence of coexisted species on the detection was studied under the same experimental conditions. As shown in Fig. 7, five kinds of interference species were respectively added into the detection system (with the concentration of 5000 μmol L−1), and (F0–F)/F0 of the system was very little. However, when we added cholesterol of the same concentration into the detection system, the fluorescence signal of the detection system showed significant changes. These results showed that the method was highly specific for the determination of cholesterol in serum.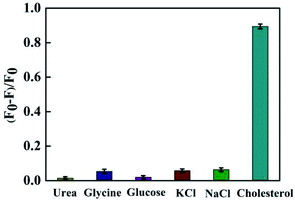 | ||
| Fig. 7 Specificity investigation of cholesterol detection system. The error indicated the standard deviations of three experiments. | ||
Determination of cholesterol in fetal bovine serum
The recovery experiments were carried out by fluorescence detection of the samples spiked with standard cholesterol solutions (the final concentration was 0, 10, 50, 100, 250 and 500 μmol L−1). As shown in Table S3 (ESI†), the obtained recovery ranged from 95.0% to 105.6% and the RSD was of 2.1–4.6%, which displayed that the proposed method could be applicable for the measurement of cholesterol in real sample analysis.Conclusions
In conclusion, we have developed a highly rapid and non-enzymatic florescent method for cholesterol detection using high quantum yield (35%) CNQDs as fluorescent nanoprobes. The fluorescent quenching time of this method was achieved as quickly as 30 seconds, which was more rapid compared to traditional detection method. Moreover, this method could achieve specific detection of cholesterol without using cholesterol oxidase and antibody. It also had the advantage of simple detection process. In addition, the quantitative determination of cholesterol in serum could be achieved, indicating that this method has a potential application prospect in life science and clinical medicine.Conflicts of interest
The authors declare that they have no known competing financial interests or personal relationships that could have appeared to influence the work reported in this paper.Acknowledgements
This work was supported by the National Natural Science Foundation of China (21705002, 21305002).Notes and references
- N. Agnihotri, A. Chowdhury and A. De, Biosens. Bioelectron., 2015, 63, 212–217 CrossRef CAS.
- S. Wu, J. Chen, D. Liu, Q. Zhuang, Q. Pei, L. Xia, Q. Zhang, J. Kikuchi, Y. Hisaedad and X. Song, RSC Adv., 2016, 6, 70781–70790 RSC.
- A. Mondal and N. Jana, Chem. Commun., 2012, 48, 7316–7318 RSC.
- Y. Gao, Y. Wu, K. Zhao, H. Wang and S. Liu, Biosens. Bioelectron., 2019, 126, 249–254 CrossRef CAS.
- L. Yang, H. Zhao, S. Fan, G. Zhao, X. Ran and C. Li, RSC Adv., 2015, 5, 64146–64155 RSC.
- N. Thakur, M. Kumar, S. Adhikary, D. Mandal and T. Nagaiah, Chem. Commun., 2019, 55, 5021–5024 RSC.
- J. Li, T. Liu, S. Liu, J. Li, G. Huang and H. Yang, Biosens. Bioelectron., 2018, 120, 137–143 CrossRef CAS.
- G. Ronsein, F. Prado, F. Mansano, M. Oliveira, M. Medeiros, S. Miyamoto and P. Mascio, Anal. Chem., 2010, 82, 7293–7301 CrossRef CAS.
- N. Nirala, S. Pandey, A. Bansal, V. Singh, B. Mukherjee, P. Saxena and A. Srivastava, Biosens. Bioelectron., 2015, 74, 207–213 CrossRef CAS.
- J. Xu, D. Jiang, Y. Qin, J. Xia, D. Jiang and H. Chen, Anal. Chem., 2017, 89, 2216–2220 CrossRef CAS.
- Z. Qing, A. Baia, S. Xing, Z. Zou, X. He, K. Wang and R. Yang, Biosens. Bioelectron., 2019, 137, 96–109 CrossRef CAS.
- C. Song, W. Hong, X. Zhang and Y. Lu, Analyst, 2018, 143, 1829–1834 RSC.
- Z. Qing, J. Xu, J. Zheng, L. He, Z. Zou, S. Yang, W. Tan and R. Yang, Angew. Chem., Int. Ed., 2019, 58, 11574–11585 CrossRef CAS.
- H. Chang and J. Ho, Anal. Chem., 2015, 87, 10362–10367 CrossRef CAS.
- S. Huang, E. Yang, J. Yao, X. Chu, Y. Liu, Y. Zhang and Q. Xiao, ACS Omega, 2019, 4, 9333–9342 CrossRef CAS.
- M. Rong, L. Lin, X. Song, Y. Wang, Y. Zhong, J. Yan, Y. Feng, X. Zeng and X. Chen, Biosens. Bioelectron., 2015, 68, 210–217 CrossRef CAS.
- Y. Sui, J. Liu, Y. Zhang, X. Tian and W. Chen, Nanoscale, 2013, 5, 9150–9155 RSC.
- P. Yang, H. Ou, Y. Fang and X. Wang, Angew. Chem., Int. Ed., 2017, 56, 3992–3996 CrossRef CAS.
- A. Savateev and M. Antonietti, ChemCatChem, 2019, 11, 6166–6176 CrossRef CAS.
- L. Lin, Z. Cong, J. Li, K. Ke, S. Guo, H. Yang and G. Chen, J. Mater. Chem. B, 2014, 2, 1031–1037 RSC.
- Z. Pei, J. Zhao, Y. Huang, Y. Huang, M. Zhu, Z. Wang, Z. Chen and C. Zhi, J. Mater. Chem. A, 2016, 4, 12205–12211 RSC.
- Y. Tang, H. Song, Y. Su and Y. Lv, Anal. Chem., 2013, 85, 11876–11884 CrossRef CAS.
- D. Wu, D. Wang, X. Ye, K. Yuan, Y. Xie, B. Li, C. Huang, T. Kuang, Z. Yu and Z. Chen, Chin. Chem. Lett., 2020, 31, 1504–1507 CrossRef CAS.
- Y. Ngo, W. Choi, J. Chung and S. Hur, Sens. Actuators, B, 2019, 282, 36–44 CrossRef CAS.
- H. Xie, Y. Fu, Q. Zhang, K. Yan, R. Yang, K. Mao, P. Chu, L. Liu and X. Wu, Talanta, 2019, 196, 530–536 CrossRef CAS.
- K. Lin, T. Yang, H. Zou, Y. Li and C. Huang, Talanta, 2019, 192, 400–406 CrossRef CAS.
- Z. Song, T. Lin, L. Lin, S. Lin, F. Fu, X. Wang and L. Guo, Angew. Chem., Int. Ed., 2016, 55, 2773–2777 CrossRef CAS.
- H. Li, F. Shao, H. Huang, J. Feng and A. Wang, Sens. Actuators, B, 2016, 226, 506–511 CrossRef CAS.
- Y. Tang, Y. Su, N. Yang, L. Zhang and Y. Lv, Anal. Chem., 2014, 86, 4528–4535 CrossRef CAS.
- S. Barman and M. Sadhukhan, J. Mater. Chem., 2012, 22, 21832–21837 RSC.
- J. Zhou, Y. Yang and C. Zhang, Chem. Commun., 2013, 49, 8605–8607 RSC.
- F. Zu, F. Yan, Z. Bai, J. Xu, Y. Wang, Y. Huang and X. Zhou, Microchim. Acta, 2017, 184, 1899–1914 CrossRef CAS.
- L. Guo, Y. Liu, R. Kong, G. Chen, H. Wang, X. Wang, L. Xia and F. Qu, Sens. Actuators, B, 2019, 295, 1–6 CrossRef CAS.
- R. Das, H. Sugimoto, M. Fujii and P. Giri, ACS Appl. Mater. Interfaces, 2020, 12, 4755–4768 CrossRef CAS.
- M. Rong, L. Lin, X. Song, T. Zhao, Y. Zhong, J. Yan, Y. Wang and X. Chen, Anal. Chem., 2015, 87, 1288–1296 CrossRef CAS.
Footnote |
| † Electronic supplementary information (ESI) available. See DOI: 10.1039/d0ra07495k |
| This journal is © The Royal Society of Chemistry 2020 |

