 Open Access Article
Morphology and performance relationship studies on biodegradable ternary blends of poly(3-hydroxybutyrate-co-3-hydroxyvalerate), polylactic acid, and polypropylene carbonate
Mary M. Hedrick ab,
Feng Wub,
Amar K. Mohanty
 *ab and
Manjusri Misra
 *ab
*ab
aSchool of Engineering, University of Guelph, Thornbrough Building, Guelph, Ontario, Canada. E-mail: mmisra@uoguelph.ca; mohanty@uoguelph.ca
bBioproducts Discovery & Development Centre, Department of Plant Agriculture, University of Guelph, Crop Science Building, Guelph, Ontario, Canada
First published on 17th December 2020
Abstract
A biodegradable ternary blend fabricated from polylactic acid (PLA), poly(3-hydroxybutyrate-co-3-hydroxyvalerate) (PHBV) and polypropylene carbonate (PPC) with a good balance of stiffness and toughness via optimizing the composition ratio and morphological structure is, to the best of the authors' knowledge, reported here for the first time. The optimal blend formulation is comprised of 20% PLA, 40% PHBV, and 40% PPC, which possesses a tensile strength measuring 44 MPa and an elongation at break measuring at 215%. Thermal performance analysis revealed an HDT value of 72 °C. The Harkins equation predicts that the three immiscible polymers formed a complete wetting morphology, which was confirmed by scanning electrical microscopy. As the PPC content of the ternary blends is increased, the material undergoes morphological transition from droplet to co-continuous structure, resulting in significant improvement of elongation at break (approximately 40 times higher than that of the PLA–PHBV binary blend). Excellent stiffness and over 200% elongation at break make these sustainable ternary blends feasible for use in packaging as substitutes for certain non-biodegradable petroleum-based single use plastics.
1. Introduction
Petroleum-based plastics are suboptimal materials as they use limited fossil resources and take a long time to break down in the environment.1,2 Biodegradable plastics made from biomass or bacterial processes are a sustainable solution as a substitute for petroleum based plastics in many applications.1,2 Polylactic acid (PLA), poly(3-hydroxybutyrate-co-3-hydroxyvalerate) (PHBV), and polypropylene carbonate (PPC) are biodegradable environmentally friendly biopolymers that would be an excellent alternatives to petroleum-based plastics,1,2 and these biopolymers are currently being used in biocomposite manufacture and design.3 PLA is a polyester produced from renewable resource such as corn starch or sugarcane.4 Lactic acid or lactide monomers fermented from biomass are then polymerized into PLA by ring-opening polymerization or polycondensation.5,6 PLA is chosen for being biodegradable, commercially available, affordable, and comparable in performance to polystyrene. PLA exhibits high modulus and strength, yet, it is brittle and fractures easily, greatly hindering its potential for high performance applications.7–9 PHBV is a linear aliphatic polyester bioplastic that is nontoxic, biodegradable, and biocompatible. It is produced by bacteria and is a good substitute for petroleum-based polymers.10 By itself, PHBV is very brittle but has high thermal resistance and has been studied extensively in fibre-based biocomposites.11 PPC is synthesized using a zinc glutarate catalyst in copolymerization between repurposed CO2 and propylene oxide.12 PPC is an amorphous polymer and useful as a toughening agent in biopolymer blends.However, in an individual biopolymer, mechanical properties may not be sufficient for high performance applications. To achieve comparable properties to fossil-based plastics, biopolymers need chemical or physical modification for desirable mechanical features such as stiffness, high thermal resistance and toughness to be achieved and balanced. Polymer blending has been widely researched as it is versatile, economic, and effective. By optimizing blend ratios, a balance of mechanical–thermal properties for materials can be obtained, making biopolymer blends competitive alternatives for high performance applications. Binary blends prepared by melt blended injection moulding of PHBV–PPC were found to exhibit good dimensional and thermal stability and that increasing crystalline PHBV in PHBV–PPC blends improved the tensile strength and modulus but reduced the elongation at break.13 Previously, it was reported14,15 that the ductility of PPC improved toughness i.e. impact strength and elongation at break of PHBV, with elongation at break increasing from 4% to 74%. Other research of 50![[thin space (1/6-em)]](https://www.rsc.org/images/entities/char_2009.gif) :
:![[thin space (1/6-em)]](https://www.rsc.org/images/entities/char_2009.gif) 50 PHBV–PPC binary blends discovered that PHBV improved the dimensional stability of PPC.13 Thermal properties of PHBV–PPC blends were reported.14–19 PLA–PHBV binary blends were fabricated and the study showed that incorporating PLA improved the modulus and strength of PHBV.8 With increasing PHBV content in the binary blend, the glass transition temperature (Tg) and crystallization temperature (Tc) of PLA were found to decrease. Electron microscope micrographs (SEM) of fractured specimens revealed that PLA and PHBV were phase separated.8 Crystallization kinetics have shown that the incorporation of polycaprolactone (PCL),20 polyglycolide (PGA),20 polyhydroxybutyrate (PHB),20 epichlorohydrin rubber (ECO),21 and polybutylene adipate terephthalate (PBAT)22 into PLA can improve its performance. Blends containing PHBV with PCL, polybutylene succinate (PBS) or poly(ethylene succinate) (PES) showed a reduction in PHBV's crystallization rate due to limited nucleation and heterogeneity for PHBV in binary blends.23–25 The reduction of PHBV crystallization rate in blends was attributed to the physical restriction of crystal growth.
50 PHBV–PPC binary blends discovered that PHBV improved the dimensional stability of PPC.13 Thermal properties of PHBV–PPC blends were reported.14–19 PLA–PHBV binary blends were fabricated and the study showed that incorporating PLA improved the modulus and strength of PHBV.8 With increasing PHBV content in the binary blend, the glass transition temperature (Tg) and crystallization temperature (Tc) of PLA were found to decrease. Electron microscope micrographs (SEM) of fractured specimens revealed that PLA and PHBV were phase separated.8 Crystallization kinetics have shown that the incorporation of polycaprolactone (PCL),20 polyglycolide (PGA),20 polyhydroxybutyrate (PHB),20 epichlorohydrin rubber (ECO),21 and polybutylene adipate terephthalate (PBAT)22 into PLA can improve its performance. Blends containing PHBV with PCL, polybutylene succinate (PBS) or poly(ethylene succinate) (PES) showed a reduction in PHBV's crystallization rate due to limited nucleation and heterogeneity for PHBV in binary blends.23–25 The reduction of PHBV crystallization rate in blends was attributed to the physical restriction of crystal growth.
Other blended types, such as ternary blends of PLA–PHBV–PBS biopolymers, were also studied.26 Dispersions of PHBV as the major phase and PBS as the minor phase showed significant improvement in flexibility and toughness. PLA–PHBV–PBS ternary blends were shown to exhibit good stiffness and toughness balance with PHBV as the matrix. PLA's thermal resistance was shown to improve with the incorporation of PHBV and PBS.26 These newly blended ternary polymers show promise as biodegradable materials that can be used in biomedical or packaging applications.
To further investigate balancing stiffness, heat deflection temperature and toughness, PBS was substituted by PPC to fabricate a novel blend with increased bio-content and reduced carbon footprint as PPC is synthesized from carbon dioxide (CO2). Additionally, experimental studies have shown that the source of propylene glycol,27 precursor to propylene oxide28 to produce PPC,12 can come from biomass. To the best of the authors' knowledge, such PLA–PHBV–PPC ternary blends and its morphological evolution with increasing PPC contents have not been reported before. Ternary blends with different composition ratios were prepared, expecting to achieve a decent stiffness–heat deflection temperature–toughness balance. The mechanical properties and morphology development with increasing PPC content were characterized to give the morphology-properties relationship in this ternary blend. With 40 wt% PPC incorporated, the blend exhibited high elongation at break (∼215%), suitable for use in applications requiring high flexibility.
2. Material and experiment
2.1 Materials
Three different biodegradable polymers, PLA 3251D purchased from NatureWorks LLC (Minnetonka, USA), PHBV ENMAT Y1000P (3% HV) from Tianan Biological Materials Co., Ltd. (Ningbo City, China) and PPC QPACVR 40 purchased from Empower Materials (New Castle, USA) were used in this study. The PPC was stored in a freezer to avoid physical aging due to its low glass transition temperature (Tg).2.2 Sample preparation
PLA and PHBV were dried in an 80 °C oven for 4 hours prior to handling. PPC was kept in the freezer until used to retain shape and usability. The moisture content of neat biopolymers was measured to be lower than 0.5 wt% prior to melt processing. Twin screw extrusion was performed using a lab-scale DSM (Netherlands) extruder. The barrel had a volume of 15 cm3 with 150 mm long screws. Extruder temperature was set to 180 °C, with screw speed of 100 rpm and a mixing time of 120 seconds. The extruded material was inserted into a 180 °C micro injector and injected into ASTM test moulds at a temperature of 30 °C. The moulded samples were then allowed to condition at room temperature for two days. Neat biopolymers of PLA and PHBV, 35![[thin space (1/6-em)]](https://www.rsc.org/images/entities/char_2009.gif) :
:![[thin space (1/6-em)]](https://www.rsc.org/images/entities/char_2009.gif) 65 PLA–PHBV binary blend, and ternary blends of PLA–PHBV–PPC with increasing PPC content from 20 wt% to 40 wt%, i.e., PLA–PHBV–PPC (30
65 PLA–PHBV binary blend, and ternary blends of PLA–PHBV–PPC with increasing PPC content from 20 wt% to 40 wt%, i.e., PLA–PHBV–PPC (30![[thin space (1/6-em)]](https://www.rsc.org/images/entities/char_2009.gif) :
:![[thin space (1/6-em)]](https://www.rsc.org/images/entities/char_2009.gif) 50
50![[thin space (1/6-em)]](https://www.rsc.org/images/entities/char_2009.gif) :
:![[thin space (1/6-em)]](https://www.rsc.org/images/entities/char_2009.gif) 20, 25
20, 25![[thin space (1/6-em)]](https://www.rsc.org/images/entities/char_2009.gif) :
:![[thin space (1/6-em)]](https://www.rsc.org/images/entities/char_2009.gif) 45
45![[thin space (1/6-em)]](https://www.rsc.org/images/entities/char_2009.gif) :
:![[thin space (1/6-em)]](https://www.rsc.org/images/entities/char_2009.gif) 30 and 20
30 and 20![[thin space (1/6-em)]](https://www.rsc.org/images/entities/char_2009.gif) :
:![[thin space (1/6-em)]](https://www.rsc.org/images/entities/char_2009.gif) 40
40![[thin space (1/6-em)]](https://www.rsc.org/images/entities/char_2009.gif) :
:![[thin space (1/6-em)]](https://www.rsc.org/images/entities/char_2009.gif) 40), were prepared. Impact samples were notched prior to testing. After being conditioned, the remaining untested samples were cryofractured and examined by scanning electron microscopy for phase morphology.
40), were prepared. Impact samples were notched prior to testing. After being conditioned, the remaining untested samples were cryofractured and examined by scanning electron microscopy for phase morphology.
2.3 Mechanical properties
ASTM standard D638 Type IV dumbbells were used for tensile testing to obtain strength, elongation at break and modulus. The tests were performed at ambient temperature at a rate of 5 millimetres per minute using an Instron Universal Testing Machine (Norwood, MA). Tensile testing was performed on five replicates of each material. Impact strength was measured using a TMI Monitor Impact Tester (Testing Machines Inc., DE) and followed ASTM standard D256 for notched Izod samples. Six notched samples of each material were prepared two days in advance for conditioning. Statistics for each group of test pieces were obtained.2.4 Heat deflection temperature (HDT)
ASTM Standard D648 was used to determine HDT by dynamic mechanical analysis (DMA) (Q800, TA Instruments) in three-point bending mode. The temperature at which 250 μm displacement was reached at a heating rate of 2 °C min−1 under a load of 0.445 MPa was used to obtain HDT. Measurements for three replicates were obtained.2.5 Thermogravimetric analysis (TGA)
TGA (Q500, TA Instruments) was used to measure thermal characteristics of sample blends. Approximately 15–20 mg of material was measured for each test. The heating rate used was 10 °C min−1 from ambient temperature to 600 °C under inert conditions.2.6 Differential scanning calorimetry (DSC)
5–10 mg of each sample in Tzero aluminium pans was characterized using DSC (Q200). Samples underwent a heat/cool/heat test in the range of −30 to 200 °C, with heating and cooling rates of 10 °C min−1 under nitrogen at a flow rate of 50 mL min−1.2.7 Scanning electron microscopy (SEM)
Before imaging, the samples were cryogenically fractured and coated by nanoparticles using a Cressington sputter coater for 8 seconds. Surface structure of coated, non-etched and etched (using acetone), samples were imaged using SEM (Phenom-World ProX desktop) with an accelerating voltage of 5 kilovolts and were collected at 3000 magnification. The etched samples were prepared by soaking fractured samples in acetone for seven days at ambient temperature until the PPC had completely dissolved. PPC was completely solubilized leaving PHBV and PLA undisturbed.2.8 Contact angle analysis
The instrument used to obtain the contact angle measurements for neat PLA, PHBV and PPC was a Ramé-hart standard goniometer (260-U1). Tests were performed at ambient temperature using deionized water (γp = 51.0 mN m−1 and γd = 21.8 mN m−1) as the polar liquid and diiodomethane (γp = 0.4 mN m−1 and γd = 50.4 mN m−1) as the nonpolar liquid.29 DROPimage software (Version 2.8.05) recorded the interface between liquid and surface, and calculated the contact angles. Three replicates were performed. Surface tension was calculated using Owen–Wendt–Rabel–Kaelble equations.303. Results and discussion
3.1 Thermal–mechanical properties
PHBV was modified by melt blending with semi-crystalline PLA and amorphous PPC to produce a material that had improved toughness. Fig. 1 shows the tensile properties of neat polymers (PLA and PHBV) and their binary/ternary blends. In Fig. 1, PLA neat polymer is represented as A, and neat PHBV is represented as B. C represents a binary blend that contains 35% PLA and 65% PHBV by weight. The PHBV–PPC (65![[thin space (1/6-em)]](https://www.rsc.org/images/entities/char_2009.gif) :
:![[thin space (1/6-em)]](https://www.rsc.org/images/entities/char_2009.gif) 35) blend was chosen for its high heat deflection temperature based on preliminary studies. Blends D, E and F represent PLA–PHBV–PPC in percentage ratios of 30
35) blend was chosen for its high heat deflection temperature based on preliminary studies. Blends D, E and F represent PLA–PHBV–PPC in percentage ratios of 30![[thin space (1/6-em)]](https://www.rsc.org/images/entities/char_2009.gif) :
:![[thin space (1/6-em)]](https://www.rsc.org/images/entities/char_2009.gif) 50
50![[thin space (1/6-em)]](https://www.rsc.org/images/entities/char_2009.gif) :
:![[thin space (1/6-em)]](https://www.rsc.org/images/entities/char_2009.gif) 20, 25
20, 25![[thin space (1/6-em)]](https://www.rsc.org/images/entities/char_2009.gif) :
:![[thin space (1/6-em)]](https://www.rsc.org/images/entities/char_2009.gif) 45
45![[thin space (1/6-em)]](https://www.rsc.org/images/entities/char_2009.gif) :
:![[thin space (1/6-em)]](https://www.rsc.org/images/entities/char_2009.gif) 30 and 20
30 and 20![[thin space (1/6-em)]](https://www.rsc.org/images/entities/char_2009.gif) :
:![[thin space (1/6-em)]](https://www.rsc.org/images/entities/char_2009.gif) 40
40![[thin space (1/6-em)]](https://www.rsc.org/images/entities/char_2009.gif) :
:![[thin space (1/6-em)]](https://www.rsc.org/images/entities/char_2009.gif) 40 respectively, as shown in Table 1. Both PLA and PHBV are semi-crystallization polymers with high modulus and tensile strength, but suffer from inherent brittleness with extremely low elongation at break and impact resistance.13,31 However, PPC is a completely amorphous polymer that has high impact strength and elongation at break.32 The addition of PPC into PLA, PHBV or PLA–PHBV blends is expected to improve the toughness and flexibility of these biopolymers, as PPC can work as a toughening agent for ternary blends due to its ductile and amorphous nature.13 This is counter-intuitive as it has been seen previously that applying a toughening agent significantly reduces the stiffness of binary blends.8,33–41 However, as shown here and in a recent study,26 both significant stiffness and toughness can be achieved for blends when using PLA for stiffness reinforcement and PPC as toughening component.
40 respectively, as shown in Table 1. Both PLA and PHBV are semi-crystallization polymers with high modulus and tensile strength, but suffer from inherent brittleness with extremely low elongation at break and impact resistance.13,31 However, PPC is a completely amorphous polymer that has high impact strength and elongation at break.32 The addition of PPC into PLA, PHBV or PLA–PHBV blends is expected to improve the toughness and flexibility of these biopolymers, as PPC can work as a toughening agent for ternary blends due to its ductile and amorphous nature.13 This is counter-intuitive as it has been seen previously that applying a toughening agent significantly reduces the stiffness of binary blends.8,33–41 However, as shown here and in a recent study,26 both significant stiffness and toughness can be achieved for blends when using PLA for stiffness reinforcement and PPC as toughening component.
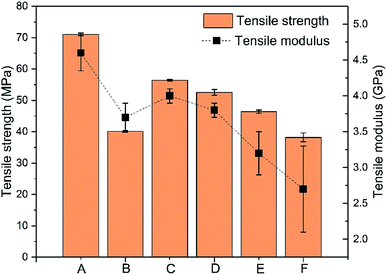 | ||
Fig. 1 Tensile strength and modulus of samples where A: 100% PLA, B: 100% PHBV, C: PLA![[thin space (1/6-em)]](https://www.rsc.org/images/entities/char_2009.gif) : :![[thin space (1/6-em)]](https://www.rsc.org/images/entities/char_2009.gif) PHBV (35 PHBV (35![[thin space (1/6-em)]](https://www.rsc.org/images/entities/char_2009.gif) : :![[thin space (1/6-em)]](https://www.rsc.org/images/entities/char_2009.gif) 65), D: PLA 65), D: PLA![[thin space (1/6-em)]](https://www.rsc.org/images/entities/char_2009.gif) : :![[thin space (1/6-em)]](https://www.rsc.org/images/entities/char_2009.gif) PHBV PHBV![[thin space (1/6-em)]](https://www.rsc.org/images/entities/char_2009.gif) : :![[thin space (1/6-em)]](https://www.rsc.org/images/entities/char_2009.gif) PPC (30 PPC (30![[thin space (1/6-em)]](https://www.rsc.org/images/entities/char_2009.gif) : :![[thin space (1/6-em)]](https://www.rsc.org/images/entities/char_2009.gif) 50 50![[thin space (1/6-em)]](https://www.rsc.org/images/entities/char_2009.gif) : :![[thin space (1/6-em)]](https://www.rsc.org/images/entities/char_2009.gif) 20), E: PLA 20), E: PLA![[thin space (1/6-em)]](https://www.rsc.org/images/entities/char_2009.gif) : :![[thin space (1/6-em)]](https://www.rsc.org/images/entities/char_2009.gif) PHBV PHBV![[thin space (1/6-em)]](https://www.rsc.org/images/entities/char_2009.gif) : :![[thin space (1/6-em)]](https://www.rsc.org/images/entities/char_2009.gif) PPC (25 PPC (25![[thin space (1/6-em)]](https://www.rsc.org/images/entities/char_2009.gif) : :![[thin space (1/6-em)]](https://www.rsc.org/images/entities/char_2009.gif) 45 45![[thin space (1/6-em)]](https://www.rsc.org/images/entities/char_2009.gif) : :![[thin space (1/6-em)]](https://www.rsc.org/images/entities/char_2009.gif) 30), and F: PLA 30), and F: PLA![[thin space (1/6-em)]](https://www.rsc.org/images/entities/char_2009.gif) : :![[thin space (1/6-em)]](https://www.rsc.org/images/entities/char_2009.gif) PHBV PHBV![[thin space (1/6-em)]](https://www.rsc.org/images/entities/char_2009.gif) : :![[thin space (1/6-em)]](https://www.rsc.org/images/entities/char_2009.gif) PPC (20 PPC (20![[thin space (1/6-em)]](https://www.rsc.org/images/entities/char_2009.gif) : :![[thin space (1/6-em)]](https://www.rsc.org/images/entities/char_2009.gif) 40 40![[thin space (1/6-em)]](https://www.rsc.org/images/entities/char_2009.gif) : :![[thin space (1/6-em)]](https://www.rsc.org/images/entities/char_2009.gif) 40). 40). | ||
| Blend formulations (wt%) | |||
|---|---|---|---|
| PLA | PHBV | PPC | |
| A | 100 | — | — |
| B | — | 100 | — |
| C | 35 | 65 | — |
| D | 30 | 50 | 20 |
| E | 25 | 45 | 30 |
| F | 20 | 40 | 40 |
From Fig. 1, the incorporation of 35% of PLA in the PLA–PHBV binary blend increased tensile strength by ∼20% compared to neat PHBV polymer, with unchanged modulus. The addition of amorphous and ductile PPC to the PLA–PHBV binary blends slightly decreased the modulus and tensile stress. The decrease is more significant as the PPC content increases. As well as the fact that addition of rubber material normally leads to a decrease of stiffness, phase separation between the three biopolymers might also be responsible for this behaviour.42 The type and strength of interface bonding between polymeric phases is a critical factor in determining mechanical and physical properties for blends.21,43 The voids formed allowed some relief of the stress present between interfaces22,43 and, during yielding, the PPC domain absorbed the stress before the matrix and disperse phases separated, which would probably have occurred in this case. Phase separation in PLA–PHBV–PPC ternary blends will be further explored using SEM.
The impact strength and elongation at break of the neat polymers and their blends are shown in Fig. 2. The impact strength of PLA–PHBV (35![[thin space (1/6-em)]](https://www.rsc.org/images/entities/char_2009.gif) :
:![[thin space (1/6-em)]](https://www.rsc.org/images/entities/char_2009.gif) 65) was between that of neat PLA and PHBV, with a value of ∼20 J m−1. The addition of PPC slightly increased the impact strength of the binary blends which was optimal at 40 wt% PPC. However, even with 40% PPC, the toughness represented by impact strength of ∼23 J m−1 is still very low. This means that the rubber PPC phase could not absorb energy during high speed fracture, resulting from the poor compatibility between amorphous PPC and the crystalline components contained in PLA–PHBV blend. The addition of flexible polymeric phase imparts not only toughness, but has the ability to absorb energy from shear deformation processes occurring during impact.22,43 However, improvements in miscibility (addition of compatibilizer) or the presence of more polar surface groups to blends would need to be made to significantly improve impact performance.
65) was between that of neat PLA and PHBV, with a value of ∼20 J m−1. The addition of PPC slightly increased the impact strength of the binary blends which was optimal at 40 wt% PPC. However, even with 40% PPC, the toughness represented by impact strength of ∼23 J m−1 is still very low. This means that the rubber PPC phase could not absorb energy during high speed fracture, resulting from the poor compatibility between amorphous PPC and the crystalline components contained in PLA–PHBV blend. The addition of flexible polymeric phase imparts not only toughness, but has the ability to absorb energy from shear deformation processes occurring during impact.22,43 However, improvements in miscibility (addition of compatibilizer) or the presence of more polar surface groups to blends would need to be made to significantly improve impact performance.
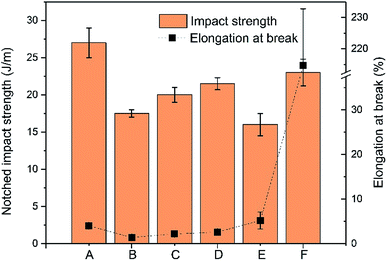 | ||
Fig. 2 Impact strength and elongation at break of samples where A: 100% PLA, B: 100% PHBV, C: PLA![[thin space (1/6-em)]](https://www.rsc.org/images/entities/char_2009.gif) : :![[thin space (1/6-em)]](https://www.rsc.org/images/entities/char_2009.gif) PHBV (35 PHBV (35![[thin space (1/6-em)]](https://www.rsc.org/images/entities/char_2009.gif) : :![[thin space (1/6-em)]](https://www.rsc.org/images/entities/char_2009.gif) 65), D: PLA 65), D: PLA![[thin space (1/6-em)]](https://www.rsc.org/images/entities/char_2009.gif) : :![[thin space (1/6-em)]](https://www.rsc.org/images/entities/char_2009.gif) PHBV PHBV![[thin space (1/6-em)]](https://www.rsc.org/images/entities/char_2009.gif) : :![[thin space (1/6-em)]](https://www.rsc.org/images/entities/char_2009.gif) PPC (30 PPC (30![[thin space (1/6-em)]](https://www.rsc.org/images/entities/char_2009.gif) : :![[thin space (1/6-em)]](https://www.rsc.org/images/entities/char_2009.gif) 50 50![[thin space (1/6-em)]](https://www.rsc.org/images/entities/char_2009.gif) : :![[thin space (1/6-em)]](https://www.rsc.org/images/entities/char_2009.gif) 20), E: PLA 20), E: PLA![[thin space (1/6-em)]](https://www.rsc.org/images/entities/char_2009.gif) : :![[thin space (1/6-em)]](https://www.rsc.org/images/entities/char_2009.gif) PHBV PHBV![[thin space (1/6-em)]](https://www.rsc.org/images/entities/char_2009.gif) : :![[thin space (1/6-em)]](https://www.rsc.org/images/entities/char_2009.gif) PPC (25 PPC (25![[thin space (1/6-em)]](https://www.rsc.org/images/entities/char_2009.gif) : :![[thin space (1/6-em)]](https://www.rsc.org/images/entities/char_2009.gif) 45 45![[thin space (1/6-em)]](https://www.rsc.org/images/entities/char_2009.gif) : :![[thin space (1/6-em)]](https://www.rsc.org/images/entities/char_2009.gif) 30), and F: PLA 30), and F: PLA![[thin space (1/6-em)]](https://www.rsc.org/images/entities/char_2009.gif) : :![[thin space (1/6-em)]](https://www.rsc.org/images/entities/char_2009.gif) PHBV PHBV![[thin space (1/6-em)]](https://www.rsc.org/images/entities/char_2009.gif) : :![[thin space (1/6-em)]](https://www.rsc.org/images/entities/char_2009.gif) PPC (20 PPC (20![[thin space (1/6-em)]](https://www.rsc.org/images/entities/char_2009.gif) : :![[thin space (1/6-em)]](https://www.rsc.org/images/entities/char_2009.gif) 40 40![[thin space (1/6-em)]](https://www.rsc.org/images/entities/char_2009.gif) : :![[thin space (1/6-em)]](https://www.rsc.org/images/entities/char_2009.gif) 40). 40). | ||
Different to impact strength, the elongation at break of the binary blends can be significantly improved by addition of 40% PPC, achieving a significant value of 215%. Surprisingly, this significant improvement only occurred when PPC increased from 30% to 40%, while at 30% PPC the elongation at break of the ternary blend was only 5.2%, almost identical to that of PLA–PHBV (35![[thin space (1/6-em)]](https://www.rsc.org/images/entities/char_2009.gif) :
:![[thin space (1/6-em)]](https://www.rsc.org/images/entities/char_2009.gif) 65) binary blend. The significant improvement at 40% PPC results from the morphology evolution from sea-island dispersion at 30% PPC to co-continuous structure with 40% PPC, which will be discussed later in the SEM morphology observations. The improvement of elongation at break but not impact strength with 40% PPC mainly resulted from the two different facture modes. In tensile characterization, the sample breaks in a low speed mode, in which the rubber PPC phase has enough time to deform. The deformation of rubber PPC phase consumes energy generated during extension and leads to the improvement of the flexibility of blends.
65) binary blend. The significant improvement at 40% PPC results from the morphology evolution from sea-island dispersion at 30% PPC to co-continuous structure with 40% PPC, which will be discussed later in the SEM morphology observations. The improvement of elongation at break but not impact strength with 40% PPC mainly resulted from the two different facture modes. In tensile characterization, the sample breaks in a low speed mode, in which the rubber PPC phase has enough time to deform. The deformation of rubber PPC phase consumes energy generated during extension and leads to the improvement of the flexibility of blends.
Heat deflection temperature (HDT) is important for materials because it determines the highest temperature a material can withstand before deformation.7 It is well known that PLA exhibits rather low HDT (∼55 °C) and the addition of PLA normally leads to a decrease of HDT of blends.8 In this study, the addition of 35% PLA did not weaken the HDT of PHBV dramatically. The binary blend exhibits a rather high HDT of ∼135 °C (similar value to pure PHBV), as shown in Fig. 3. This mainly resulted from the high crystallinity of PHBV in the blend. As expected, the addition of thermoplastic elastomer, PPC, resulted in reduction of HDT of the binary blends. The HDT reduced more with increasing PPC content, from 100 °C (20% PPC) to 72 °C (40% PPC). The HDT of the flexible sample (PLA–PHBV–PPC (20![[thin space (1/6-em)]](https://www.rsc.org/images/entities/char_2009.gif) :
:![[thin space (1/6-em)]](https://www.rsc.org/images/entities/char_2009.gif) 40
40![[thin space (1/6-em)]](https://www.rsc.org/images/entities/char_2009.gif) :
:![[thin space (1/6-em)]](https://www.rsc.org/images/entities/char_2009.gif) 40)) with 40% PPC was much higher than that of pure PLA, which will benefit the application of this biopolymer blend at higher temperature.
40)) with 40% PPC was much higher than that of pure PLA, which will benefit the application of this biopolymer blend at higher temperature.
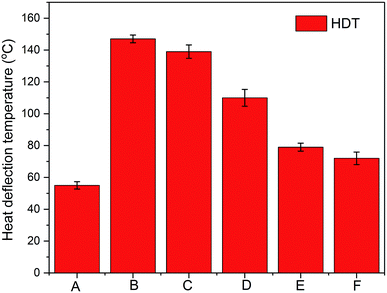 | ||
Fig. 3 HDT of samples where A: 100% PLA, B: 100% PHBV, C: PLA![[thin space (1/6-em)]](https://www.rsc.org/images/entities/char_2009.gif) : :![[thin space (1/6-em)]](https://www.rsc.org/images/entities/char_2009.gif) PHBV (35 PHBV (35![[thin space (1/6-em)]](https://www.rsc.org/images/entities/char_2009.gif) : :![[thin space (1/6-em)]](https://www.rsc.org/images/entities/char_2009.gif) 65), D: PLA 65), D: PLA![[thin space (1/6-em)]](https://www.rsc.org/images/entities/char_2009.gif) : :![[thin space (1/6-em)]](https://www.rsc.org/images/entities/char_2009.gif) PHBV PHBV![[thin space (1/6-em)]](https://www.rsc.org/images/entities/char_2009.gif) : :![[thin space (1/6-em)]](https://www.rsc.org/images/entities/char_2009.gif) PPC (30 PPC (30![[thin space (1/6-em)]](https://www.rsc.org/images/entities/char_2009.gif) : :![[thin space (1/6-em)]](https://www.rsc.org/images/entities/char_2009.gif) 50 50![[thin space (1/6-em)]](https://www.rsc.org/images/entities/char_2009.gif) : :![[thin space (1/6-em)]](https://www.rsc.org/images/entities/char_2009.gif) 20), E: PLA 20), E: PLA![[thin space (1/6-em)]](https://www.rsc.org/images/entities/char_2009.gif) : :![[thin space (1/6-em)]](https://www.rsc.org/images/entities/char_2009.gif) PHBV PHBV![[thin space (1/6-em)]](https://www.rsc.org/images/entities/char_2009.gif) : :![[thin space (1/6-em)]](https://www.rsc.org/images/entities/char_2009.gif) PPC (25 PPC (25![[thin space (1/6-em)]](https://www.rsc.org/images/entities/char_2009.gif) : :![[thin space (1/6-em)]](https://www.rsc.org/images/entities/char_2009.gif) 45 45![[thin space (1/6-em)]](https://www.rsc.org/images/entities/char_2009.gif) : :![[thin space (1/6-em)]](https://www.rsc.org/images/entities/char_2009.gif) 30), and F: PLA 30), and F: PLA![[thin space (1/6-em)]](https://www.rsc.org/images/entities/char_2009.gif) : :![[thin space (1/6-em)]](https://www.rsc.org/images/entities/char_2009.gif) PHBV PHBV![[thin space (1/6-em)]](https://www.rsc.org/images/entities/char_2009.gif) : :![[thin space (1/6-em)]](https://www.rsc.org/images/entities/char_2009.gif) PPC (20 PPC (20![[thin space (1/6-em)]](https://www.rsc.org/images/entities/char_2009.gif) : :![[thin space (1/6-em)]](https://www.rsc.org/images/entities/char_2009.gif) 40 40![[thin space (1/6-em)]](https://www.rsc.org/images/entities/char_2009.gif) : :![[thin space (1/6-em)]](https://www.rsc.org/images/entities/char_2009.gif) 40). 40). | ||
In summary, the biodegradable blends can be tailored to form stiffness–HDT–toughness balanced materials by adjusting the composition ratios appropriately. With 40% PPC added, the ternary blends of PLA–PHBV–PPC (20![[thin space (1/6-em)]](https://www.rsc.org/images/entities/char_2009.gif) :
:![[thin space (1/6-em)]](https://www.rsc.org/images/entities/char_2009.gif) 40
40![[thin space (1/6-em)]](https://www.rsc.org/images/entities/char_2009.gif) :
:![[thin space (1/6-em)]](https://www.rsc.org/images/entities/char_2009.gif) 40) exhibited high stiffness with modulus of 2.7 GPa, acceptable HDT of 72 °C and high flexibility with elongation at break of 215%. The designed ternary blend (PLA–PHBV–PPC (20
40) exhibited high stiffness with modulus of 2.7 GPa, acceptable HDT of 72 °C and high flexibility with elongation at break of 215%. The designed ternary blend (PLA–PHBV–PPC (20![[thin space (1/6-em)]](https://www.rsc.org/images/entities/char_2009.gif) :
:![[thin space (1/6-em)]](https://www.rsc.org/images/entities/char_2009.gif) 40
40![[thin space (1/6-em)]](https://www.rsc.org/images/entities/char_2009.gif) :
:![[thin space (1/6-em)]](https://www.rsc.org/images/entities/char_2009.gif) 40)) is expected to be used in different applications to substitute for petroleum-based plastics. To reveal the mechanism behind the thermal-mechanical performance of ternary blends, the crystallization, thermal degradation, and morphology were evaluated and analysed and are discussed in the following sections.
40)) is expected to be used in different applications to substitute for petroleum-based plastics. To reveal the mechanism behind the thermal-mechanical performance of ternary blends, the crystallization, thermal degradation, and morphology were evaluated and analysed and are discussed in the following sections.
3.2 Thermogravimetric analysis (TGA)
Thermal behaviour of ternary blends as analysed by TGA is presented in Fig. 4. Compared to PLA, the thermal stability of PHBV is poor with much lower maximum degradation temperature. As PHBV contents are greater than 40% in the ternary blends, the thermal stability is dramatically influenced by PHBV, where all ternary blends show similar onset and maximum degradation temperature to that of PHBV.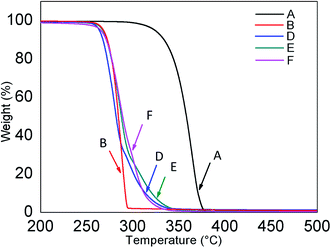 | ||
Fig. 4 Thermal decomposition of samples where A: 100% PLA, B: 100% PHBV, D: PLA![[thin space (1/6-em)]](https://www.rsc.org/images/entities/char_2009.gif) : :![[thin space (1/6-em)]](https://www.rsc.org/images/entities/char_2009.gif) PHBV PHBV![[thin space (1/6-em)]](https://www.rsc.org/images/entities/char_2009.gif) : :![[thin space (1/6-em)]](https://www.rsc.org/images/entities/char_2009.gif) PPC (30 PPC (30![[thin space (1/6-em)]](https://www.rsc.org/images/entities/char_2009.gif) : :![[thin space (1/6-em)]](https://www.rsc.org/images/entities/char_2009.gif) 50 50![[thin space (1/6-em)]](https://www.rsc.org/images/entities/char_2009.gif) : :![[thin space (1/6-em)]](https://www.rsc.org/images/entities/char_2009.gif) 20), E: PLA 20), E: PLA![[thin space (1/6-em)]](https://www.rsc.org/images/entities/char_2009.gif) : :![[thin space (1/6-em)]](https://www.rsc.org/images/entities/char_2009.gif) PHBV PHBV![[thin space (1/6-em)]](https://www.rsc.org/images/entities/char_2009.gif) : :![[thin space (1/6-em)]](https://www.rsc.org/images/entities/char_2009.gif) PPC (25 PPC (25![[thin space (1/6-em)]](https://www.rsc.org/images/entities/char_2009.gif) : :![[thin space (1/6-em)]](https://www.rsc.org/images/entities/char_2009.gif) 45 45![[thin space (1/6-em)]](https://www.rsc.org/images/entities/char_2009.gif) : :![[thin space (1/6-em)]](https://www.rsc.org/images/entities/char_2009.gif) 30), and F: PLA 30), and F: PLA![[thin space (1/6-em)]](https://www.rsc.org/images/entities/char_2009.gif) : :![[thin space (1/6-em)]](https://www.rsc.org/images/entities/char_2009.gif) PHBV PHBV![[thin space (1/6-em)]](https://www.rsc.org/images/entities/char_2009.gif) : :![[thin space (1/6-em)]](https://www.rsc.org/images/entities/char_2009.gif) PPC (20 PPC (20![[thin space (1/6-em)]](https://www.rsc.org/images/entities/char_2009.gif) : :![[thin space (1/6-em)]](https://www.rsc.org/images/entities/char_2009.gif) 40 40![[thin space (1/6-em)]](https://www.rsc.org/images/entities/char_2009.gif) : :![[thin space (1/6-em)]](https://www.rsc.org/images/entities/char_2009.gif) 40). 40). | ||
3.3 Differential scanning calorimetry (DSC)
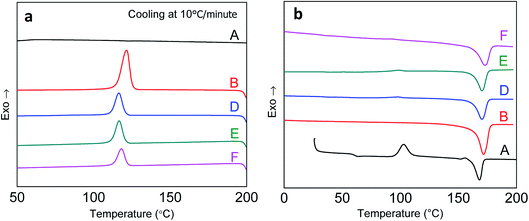
The DSC curves of the ternary blends are presented in Fig. 5, and the corresponding crystallization-melting properties were compared with those of the neat PLA and PHBV. At 10 °C min−1 cooling, PLA showed an amorphous state because of its slow crystallization rate. Zero crystallization peaks were observed for neat PLA, as shown in Fig. 5(a). However, for the neat PHBV and its ternary blends, crystallization peaks at 115–125 °C were found, resulting from fast crystallization of the PHBV matrix. Compared to that of neat PHBV, the crystallization temperature of ternary blends reduced slightly, indicating the decreased crystallization of PHBV in the presence of PLA and PPC. This is probably due to the phase separation of the three biopolymers where PLA and amorphous PPC hindered the crystalline growth of PHBV.Because of the slow crystallization rate, PLA exhibits cold crystallization in the following heating cycles, as shown in Fig. 5(b). The cold crystallization peak at 110 °C for PLA disappeared in the ternary blends, indicating that the crystallization rate of PLA had been improved with the addition of PHBV and PPC. If there is sufficient chain and surface mobility, as seen in binary44 and ternary blends,26 PHBV can act as nucleating centres to enhance PLA crystallization. Specifically, the phase interface has a strong effect in determining nucleation enhancement.44 The interface between phase domains must be taken into account in order to properly evaluate rate of crystallization in melt blended polymers.45,46 Differing terminal and bulk biopolymer functionality of small molecules that contain an abundance of shorter chain ends encourages free mobility of biopolymer chains to the interface, as well as being oriented, where localized alignment could promote crystalline growth.45,47,48
The overlap of melting peaks of PLA and PHBV results in only one melting point being found in the ternary blends. The melting points of ternary blends are slightly higher than that of neat PLA and PHBV, indicating the probability of special crystals forming between PLA and PHBV, which needs to be further investigated in the future.
3.4 Morphology
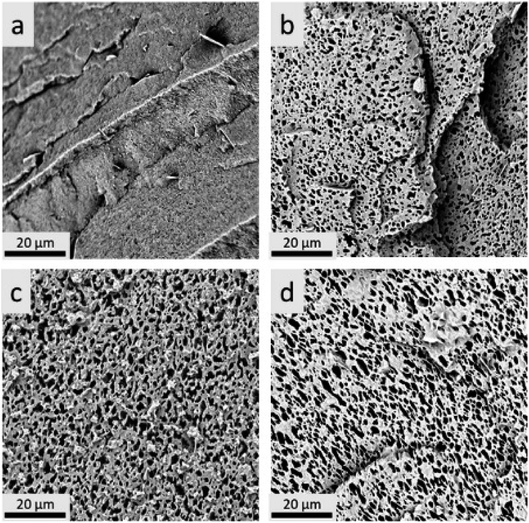
Morphologies of the ternary blends were observed by Scanning Electron Microscopy (SEM) and are shown in Fig. 6 and 7. It was difficult to distinguish the different phases from the PLA–PHBV binary blends and PLA–PHBV–PPC ternary blends without phase etching due to the multi-phase structures of the blends, as shown in Fig. 6. To better differentiate between polymer domains in the ternary blends, and determine changes in polymeric particle sizes, samples were soaked in acetone to extract the PPC particle phase then sputter coated with gold nanoparticles and observed by SEM. The images of etched samples are shown in Fig. 7.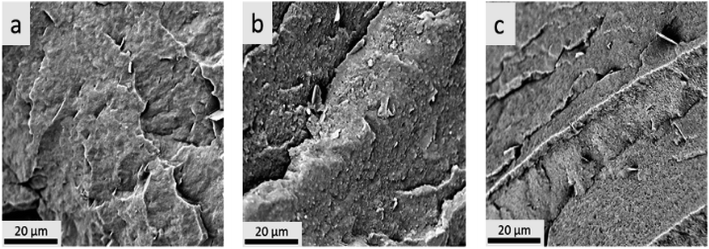 | ||
Fig. 6 SEM for cryofractured samples before acetone treatment where a: 100% PHBV, b: PLA![[thin space (1/6-em)]](https://www.rsc.org/images/entities/char_2009.gif) : :![[thin space (1/6-em)]](https://www.rsc.org/images/entities/char_2009.gif) PHBV (35 PHBV (35![[thin space (1/6-em)]](https://www.rsc.org/images/entities/char_2009.gif) : :![[thin space (1/6-em)]](https://www.rsc.org/images/entities/char_2009.gif) 65), and c: PLA 65), and c: PLA![[thin space (1/6-em)]](https://www.rsc.org/images/entities/char_2009.gif) : :![[thin space (1/6-em)]](https://www.rsc.org/images/entities/char_2009.gif) PHBV PHBV![[thin space (1/6-em)]](https://www.rsc.org/images/entities/char_2009.gif) : :![[thin space (1/6-em)]](https://www.rsc.org/images/entities/char_2009.gif) PPC (30 PPC (30![[thin space (1/6-em)]](https://www.rsc.org/images/entities/char_2009.gif) : :![[thin space (1/6-em)]](https://www.rsc.org/images/entities/char_2009.gif) 50 50![[thin space (1/6-em)]](https://www.rsc.org/images/entities/char_2009.gif) : :![[thin space (1/6-em)]](https://www.rsc.org/images/entities/char_2009.gif) 20). 20). | ||
From the SEM images of etched samples, ternary blend morphology transitioned from sea-island structure with elliptical shaped droplets at low PPC contents (20%) to co-continuous structure at higher PPC contents (30 and 40%). Particle size was shown to increase slightly with the increasing PPC contents where it was more pronounced with 40% PPC. However, this is not necessarily indicative of improved miscibility but rather the effect of adding higher contents of PPC. For polymer blends with high compatibility, a considerable reduction in particle size of the minor phase was observed resulting from enhanced interfacial adhesion.49 However, the three biodegradable biopolymers are not completely immiscible, leading to the slightly increased PPC size at higher PPC contents. Therefore, it can be expected that the continuity would be greater with 40% PPC, which is why the elongation at break experienced a dramatic improvement at 40% PPC, jumping from 5.2% to 215%. The mechanical performance of the ternary blends was determined, not only by the phase morphology of co-continuous droplets, but also by the wetting behaviour of the different components. The blends can form complete wetting or partial wetting scenarios which can be predicted by the spreading coefficient from the Harkins equation.
Hobbs et al. adjusted the Harkins equation to account for a spreading coefficient that would determine if separate or miscible phases were present in the matrix and detail ternary blend morphology.26,50 The modified Harkins equation is shown below.
| λ31 = γ12 − γ32 − γ13 |
The data for surface tension of polymers at 180 °C are listed in Table 2.
| Polymer | γs (mN m−1) | γd (mN m−1) | γp (mN m−1) |
|---|---|---|---|
| PLA | 32.4 | 29.2 | 3.2 |
| PHBV | 35.2 | 26.9 | 8.3 |
| PPC | 32.9 | 25.8 | 7.0 |
The spreading coefficient equation was used to calculate the surface tension of neat polymer at a mixing temperature of 180 °C. Those results are shown in Table 3.
| Sample | λ31 (mN m−1) |
|---|---|
| PLA/PPC/PHBV harmonic 1/3/2 = γ12 | −3.98 |
| PLA/PHBV/PPC harmonic 1/2/3 = γ13 | −0.84 |
| PPC/PLA/PHBV harmonic 3/1/2 = γ32 | 0.58 |
It was demonstrated that 30% PLA, 60% PHBV and 10% PBS had a calculated λ31 of 3.83 mN m−1. PBS enveloped PLA lending itself to a core–shell scenario.26 However, for PLA–PHBV–PPC ternary blends, both γ13 and λ31 were found to be negative, indicating that PLA and PPC formed separate phases. This means that the three components were separated from each other, and complete wetting morphology was formed in the ternary blends. That is why the flexibility of ternary blends can only be improved at 40% PPC where a co-continuous structure was successfully formed. This is unlike the previous study where only 10% PBS surrounded by 30% rigid PLA (40% (PLA + PBS)) could improve the toughness and flexibility of blends.17 In this study, PPC not only played the role of a toughening agent but also improved sample flexibility.
Fig. 8 shows the schematic representation of phase morphology of the ternary blends. PLA, PHBV and PPC are separated from each other with morphology evolution from elliptical shaped droplets to co-continuous structures. As such, the toughness of PLA–PHBV matrix can only be improved with high contents of PPC (40%), in which co-continuous structures can be formed in the melt blending. Since all three biodegradable biopolymers are mostly immiscible with each other, as predicted by spreading coefficients from interfacial interaction, use of compatibilizer such as peroxide or modification of the surface groups of biopolymers such as maleic anhydride grafting would increase miscibility among the three polymers where added functionality promote intermolecular interactions between each biopolymeric species.
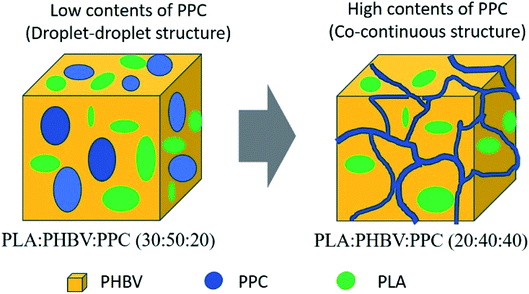 | ||
| Fig. 8 Schematic illustration detailing the transition from droplet–droplet to co-continuous morphology for biopolymer phases of ternary blends. | ||
4. Conclusions
Ternary blend containing 20![[thin space (1/6-em)]](https://www.rsc.org/images/entities/char_2009.gif) :
:![[thin space (1/6-em)]](https://www.rsc.org/images/entities/char_2009.gif) 40
40![[thin space (1/6-em)]](https://www.rsc.org/images/entities/char_2009.gif) :
:![[thin space (1/6-em)]](https://www.rsc.org/images/entities/char_2009.gif) 40 weight percentage of PLA–PHBV–PPC was found to be an optimal blend with high stiffness of 2.7 GPa, an HDT of 72 °C and a high elongation at break of ∼215%. HDT was seen to reduce with 40% PPC, however tensile flexibility showed great improvement compared to neat PHBV. To reveal the mechanism behind mechanical performance of ternary blends, the crystallization and morphology were studied. The SEM studies showed that a co-continuous structure was formed at 40% PPC, leading to significant improvement in elongation at break of the ternary blends. Furthermore, the phase morphology was predicted by theoretical spreading coefficient calculations. It was found that PLA, PHBV, and PPC were separated from each other in the ternary blends and as such the toughness of blends could only be improved at high PPC content. Overall, ternary blends containing at least 40% PPC provided a balance of mechanical and thermal properties necessary for high performance applications. In the future, compatibilizer or surface polarity modification of PLA or PPC will be investigated to further enhance mechanical and thermal properties of the blends using low amounts of PPC.
40 weight percentage of PLA–PHBV–PPC was found to be an optimal blend with high stiffness of 2.7 GPa, an HDT of 72 °C and a high elongation at break of ∼215%. HDT was seen to reduce with 40% PPC, however tensile flexibility showed great improvement compared to neat PHBV. To reveal the mechanism behind mechanical performance of ternary blends, the crystallization and morphology were studied. The SEM studies showed that a co-continuous structure was formed at 40% PPC, leading to significant improvement in elongation at break of the ternary blends. Furthermore, the phase morphology was predicted by theoretical spreading coefficient calculations. It was found that PLA, PHBV, and PPC were separated from each other in the ternary blends and as such the toughness of blends could only be improved at high PPC content. Overall, ternary blends containing at least 40% PPC provided a balance of mechanical and thermal properties necessary for high performance applications. In the future, compatibilizer or surface polarity modification of PLA or PPC will be investigated to further enhance mechanical and thermal properties of the blends using low amounts of PPC.
Conflicts of interest
The authors declare no conflicts of interest.Acknowledgements
The financial support from (i) Agriculture and Agri-Food Canada (AAFC), Maple Leaf Food, Canada and Bank of Montreal (BMO), Canada through Bioindustrial Innovation Canada (BIC) Bioproducts AgSci Cluster Program (Project No. 054015, 054449 and 800148), (ii) the Ontario Ministry of Agriculture, Food and Rural Affairs (OMAFRA)/University of Guelph – Bioeconomy for Industrial Uses Research Program (Project No. 030486 and 030251) and (iii) the Natural Sciences and Engineering Research Council (NSERC), Canada Discovery Grants (Project No. 400320) are gratefully acknowledged.References
- A. K. Mohanty, M. Misra and L. T. Drzal, J. Polym. Environ., 2002, 10, 19–26 Search PubMed.
- A. K. Mohanty, M. Misra and G. Hinrichsen, Macromol. Mater. Eng., 2000, 276/277, 1–24 Search PubMed.
- A. K. Mohanty, S. Vivekanandhan, J.-M. Pin and M. Misra, Science, 2018, 362, 536–542 Search PubMed.
- A. Morão and F. de Bie, J. Polym. Environ., 2019, 27, 2523–2539 Search PubMed.
- E. T. H. Vink, K. R. Rábago, D. A. Glassner and P. R. Gruber, Polym. Degrad. Stab., 2003, 80, 403–419 Search PubMed.
- E. T. H. Vink and S. Davies, Ind. Biotechnol., 2015, 11, 167–180 Search PubMed.
- F. Wu, M. Misra and A. K. Mohanty, ACS Omega, 2019, 4, 1955–1968 Search PubMed.
- M. R. Nanda, M. Misra and A. K. Mohanty, Macromol. Mater. Eng., 2011, 296, 719–728 Search PubMed.
- V. Nagarajan, A. K. Mohanty and M. Misra, ACS Sustainable Chem. Eng., 2016, 4, 2899–2916 Search PubMed.
- M. M. Reddy, S. Vivekanandhan, M. Misra, S. K. Bhatia and A. K. Mohanty, Prog. Polym. Sci., 2013, 38, 1653–1689 Search PubMed.
- S. Singh, A. K. Mohanty, T. Sugie, Y. Takai and H. Hamada, Composites, Part A, 2008, 39, 875–886 Search PubMed.
- M. H. Chisholm, D. Navarro-Llobet and Z. Zhou, Macromolecules, 2002, 35(17), 6494–6504 Search PubMed.
- E. Enriquez, A. K. Mohanty and M. Misra, J. Appl. Polym. Sci., 2017, 134, 44420 Search PubMed.
- J. Li, M. F. Lai and J. J. Liu, J. Appl. Polym. Sci., 2005, 98, 1427–1436 Search PubMed.
- Y.-M. Corre, S. Bruzaud and Y. Grohens, Macromol. Mater. Eng., 2013, 298, 1176–1183 Search PubMed.
- S. Peng, Y. An, C. Chen, B. Fei, Y. Zhuang and L. Dong, J. Appl. Polym. Sci., 2003, 90, 4054–4060 Search PubMed.
- J. Tao, C. Song, M. Cao, D. Hu, L. Liu, N. Liu and S. Wang, Polym. Degrad. Stab., 2009, 94, 575–583 Search PubMed.
- J. Li, M. F. Lai and J. J. Liu, J. Appl. Polym. Sci., 2004, 92, 2514–2521 Search PubMed.
- J. Li, C. R. Sun and X. Q. Zhang, Polym. Compos., 2012, 33, 1737–1749 Search PubMed.
- H. Tsuji, M. Sawada and L. Bouapao, ACS Appl. Mater. Interfaces, 2009, 1, 1719–1730 Search PubMed.
- K. Zhang, X. Ran, X. Wang, C. Han, L. Han, X. Wen, Y. Zhuang and L. Dong, Polym. Eng. Sci., 2011, 51, 2370–2380 Search PubMed.
- L. Jiang, M. P. Wolcott and J. Zhang, Biomacromolecules, 2006, 7, 199–207 Search PubMed.
- Y. S. Chun and W. N. Kim, Polymer, 2000, 41, 2305–2308 Search PubMed.
- Z. Qiu, T. Ikehara and T. Nishi, Polymer, 2003, 44, 7519–7527 Search PubMed.
- L. Miao, Z. Qiu, W. Yang and T. Ikehara, React. Funct. Polym., 2008, 68, 446–457 Search PubMed.
- K. Zhang, A. K. Mohanty and M. Misra, ACS Appl. Mater. Interfaces, 2012, 4, 3091–3101 Search PubMed.
- A. Gonzalez-Garay, M. Gonzalez-Miquel and G. Guillen-Gosalbez, ACS Sustainable Chem. Eng., 2017, 5, 5723–5732 Search PubMed.
- Z. Yu, L. Xu, Y. Wei, Y. Wang, Y. He, Q. Xia, X. Zhang and Z. Liu, Chem. Commun., 2009, 3934–3936, 10.1039/b907530e.
- B. B. Jańczuk and T. Biallopiotrowicz, J. Colloid Interface Sci., 1989, 127, 189–204 Search PubMed.
- M. R. Snowdon, A. K. Mohanty and M. Misra, ACS Omega, 2018, 3, 7300–7309 Search PubMed.
- S. Pilla, in Handbook of Bioplastics and Biocomposites Engineering Applications, ed. S. Pilla, Scrivener Publishing LLC, University of Wisconsin-Madison, USA, 2011, ch. 14, p. 383 Search PubMed.
- F. P. de Carvalho, M. Isabel Felisberti, M. A. Soto Oviedo, M. Davila Vargas, M. Farah and M. P. Fortes Ferreira, J. Appl. Polym. Sci., 2012, 123, 3337–3344 Search PubMed.
- M. Harada, T. Ohya, K. Iida, H. Hayashi, K. Hirano and H. Fukuda, J. Appl. Polym. Sci., 2007, 106, 1813–1820 Search PubMed.
- J. W. Park and S. S. Im, J. Appl. Polym. Sci., 2002, 86, 647–655 Search PubMed.
- T. Yokohara and M. Yamaguchi, Eur. Polym. J., 2008, 44, 677–685 Search PubMed.
- T. Yokohara, K. Okamoto and M. Yamaguchi, J. Appl. Polym. Sci., 2010, 117, 2226–2232 Search PubMed.
- R. Wang, S. Wang, Y. Zhang, C. Wan and P. Ma, Polym. Eng. Sci., 2009, 49, 26–33 Search PubMed.
- E.-S. Park, H. K. Kim, J. H. Shim, H. S. Kim, L. W. Jang and J.-S. Yoon, J. Appl. Polym. Sci., 2003, 92, 3508–3513 Search PubMed.
- B. M. P. Ferreira, C. A. C. Zavaglia and E. A. R. Duek, J. Appl. Polym. Sci., 2002, 86, 2898–2906 Search PubMed.
- S. Wang, P. Ma, R. Wang, S. Wang, Y. Zhang and Y. Zhang, Polym. Degrad. Stab., 2008, 93, 1364–1369 Search PubMed.
- S. Iannace, L. Ambrosio, S. J. Huang and L. Nicolais, J. Appl. Polym. Sci., 1994, 54, 1525–1536 Search PubMed.
- M. Shibata, Y. Inoue and M. Miyoshi, Polymer, 2006, 47, 3557–3564 Search PubMed.
- Y. Lin, K.-Y. Zhang, Z.-M. Dong, L.-S. Dong and Y.-S. Li, Macromolecules, 2007, 40, 6257–6267 Search PubMed.
- F. Sakai, K. Nishikawa, Y. Inoue and K. Yazawa, Macromolecules, 2009, 42, 8335–8342 Search PubMed.
- T. Dollase, M. Wilhelm, H. W. Spiess, Y. Yagen, R. Yerushalmi-Rozen and M. Gottlieb, Interface Sci., 2003, 11, 199–209 Search PubMed.
- A. M. Mayes, Macromolecules, 1994, 27, 3114–3115 Search PubMed.
- C. B. Roth, K. L. McNerny, W. F. Jager and J. M. Torkelson, Macromolecules, 2007, 40, 2568–2574 Search PubMed.
- B. J. Factor, T. P. Russell and M. F. Toney, Phys. Rev. Lett., 1991, 66, 1181–1184 Search PubMed.
- P. Ma, D. G. Hristova-Bogaerds, P. J. Lemstra, Y. Zhang and S. Wang, Macromol. Mater. Eng., 2012, 297, 402–410 Search PubMed.
- S. Y. Hobbs, M. E. J. Dekkers and V. H. Watkins, Polymer, 1988, 29, 1598–1602 Search PubMed.
- S. Wu, J. Polym. Sci., Part C: Polym. Symp., 1971, 34, 19–30 Search PubMed.
| This journal is © The Royal Society of Chemistry 2020 |

